
Saving Topology Map
Last updated – 09 January, 2026
To repeatedly access a topology map or add it to a dashboard as a widget, select the Save button at any point while creating the map to save the map.
Note: Upon first save, there are several configurations to complete. Once these configurations are established, LogicMonitor returns you to the map canvas so that you can continue creating the topology map.
- Select the
 Save located in the upper right corner of the Mapping page and select Settings.
A Topology Properties dialog box is displayed.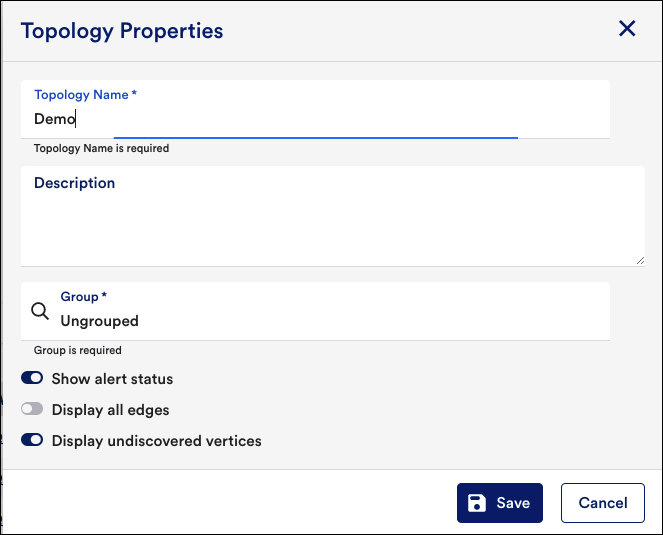
- Enter the “name” and “description” in the Topology Name and the Description fields respectively.
- In the Group field, enter the name of the group in which your topology map will be organized. LogicMonitor only allows you to select a group previously created; if you do not select a group, your topology map will be assigned to the default “Ungrouped” group.
- To display the alert status, toggle the Show alert status button from left to right.
- To display all the edges in the map, toggle the Display all edges button from left to right.
- To display the undiscovered vertices, toggle Display undiscovered vertices from left to right. For more information, see Topology Mapping Overview.
- Select
 Save.
Save.
Once saved, a topology map can be cloned (available in the More options).
Adding Topology Maps to Dashboards
You can add the saved topology maps to dashboards as Topology Map widgets. Select Add to dashboard from
![]() More Options on the Mapping page.
More Options on the Mapping page.
For more information on Topology Map widgets, see Topology Map Widget.
