Alerts Tuning Tab (New UI)

Last updated on 16 February, 2024

You can use the Alert Tuning tab to adjust static thresholds or add new static and dynamic thresholds to your datapoints at the resource group or instance level.

On the Resources page, navigate to the resource group or instance in the tree and open its Alert Tuning tab.

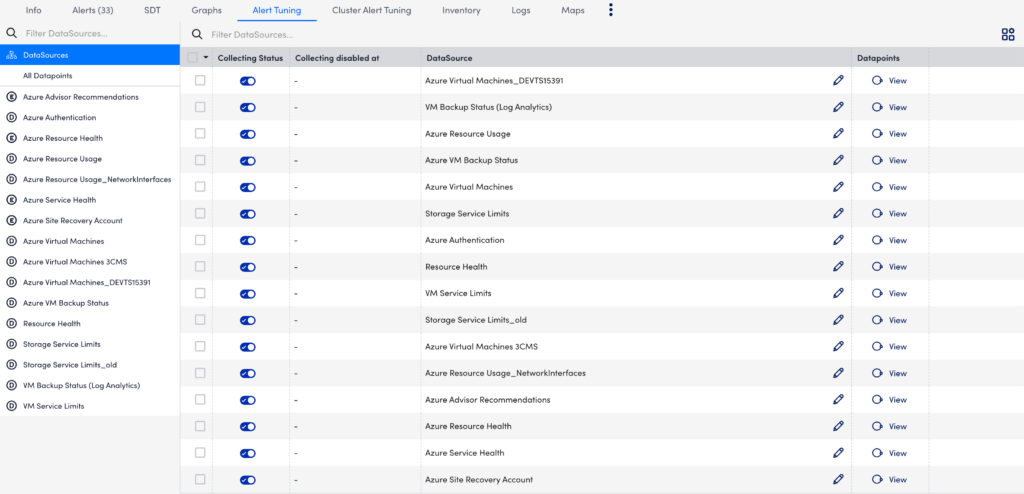
  • The Alert Tuning tab displays a table of the Datapoints and configured Static and Dynamic Thresholds. At the Resource Group level, the table will also list the DataSources and allow you to edit each DataSource.
  • When you select a row, the details panel opens for the selected datapoint. You can edit existing thresholds and add new thresholds to the datapoint. You can also view the Parent and the Alert Routing configurations.
  • You can edit Column Settings to customize the table and only show relevant information.

Managing Alert Generation

Check the boxes at the beginning of the rows to view the bulk Actions menu, which allows you to Enable Alert Generation and Disable Alert Generation for the selected datapoints.

Editing Thresholds

To edit a threshold:

  1. Select the Edit icon for the datapoint in the table. The edit icon appears at the Group level. If you’re at the DataSource or Instance level, select a row in the table to edit it.
  2. In the details panel, select the Threshold tab, and then select the threshold in the calendar.
  3. Select the threshold that you want to edit. The Edit Threshold dialog appears.
  4. Select Edit Global Threshold, and then Continue.
  5. Select from the following options:
    • Edit Global Threshold – Opens the DataSource settings.
    • Add threshold at the current level – Opens the Add Static Threshold dialog, where you can overwrite the current settings. For more information, see Adding a New Static Threshold.
  6. Click Continue.

Adding a New Static Threshold and Setting Alert Tuning Parameters

In addition to setting static alert threshold, you can also set alert trigger interval, alert clear interval, and no data alert at the resource group, instance group, and instance level. For the no data option, you can choose to trigger a warning, error, or critical alert. For more information, see Datapoint Overview. Currently, this feature is applicable only to DataSource Logic modules. 

Note: You can access the new alert tuning parameters (no data, alert trigger interval, and alert clear interval) in the UIv4. If you set a new threshold or update an existing one in the UIv4, then in the old UIv3, LogicMonitor sets the fields with value set at the global level so that there is no change in functionality at the level you are updating. To get optimum benefit of this feature, we encourage you to access the alert tuning parameters on the UIv4.

The alert tuning parameters follow the inheritance model, which means if the alert trigger, alert clear, or no data fields are set at the resource group level, all nodes under it inherit the value. In the absence of parameters set at a level, the parameters set at one level higher are applied. For example, if the alert trigger, alert clear, or no data fields are not set at the instance level or a new instance is discovered, the parameters set at the instance group level are applied. If the fields are not set at the instance group level, then the parameters set at the resource group level are applied. Finally, if the parameters are not set at the resource group level, then the parameters set at the global level are applied. This hierarchy ensures that although you have the option to set the parameters at each supported level, in case you miss to set the parameters, the system will still send an alert.

For static threshold, you can select start and end time during which the threshold is applied and you are alerted. However, the no data, alert trigger interval, and alert clear interval options are not time based. You can only apply them as an all-day event. For example, you add a static threshold from 8 am – 5 pm with no data set to critical alert, alert trigger interval set to 15 polls, and alert clear interval set to 20 polls. If you then add a second static threshold from 5 pm – 12 am, LogicMonitor automatically sets no data to critical alert, the alert trigger interval to 15 polls, and the alert clear interval to 20 polls. You can manually change the values, but then the system will override the previously set values.

The steps to add a new threshold and set alert tuning parameters are similar for resource group, instance group, and instance.

To add a new threshold and set alert tuning parameters to an instance:

  1. Select the instance row in the table.
  2. In the details panel, select the Threshold tab.
  3. Select + and then select Static Threshold.
  4. Set the start and end time for the static threshold. The no data, alert trigger interval, and alert clear interval are applied as an all-day event.  
  5. Specify the criteria when you want to trigger an alert and add the number of consecutive intervals after which a warning, error, or critical alert should be sent.
  6. Add a threshold update note for future reference.
  7. Under the Alert tuning parameters section, select the type of alert you want to trigger if you do not receive data from collector, and when you want the system to trigger an alert and clear an alert.
  8. Select Save to apply the settings. 

Adding a New Dynamic Threshold

To add a new threshold to a datapoint:

  1. Select the datapoint row in the table.
  2. In the details panel, select the threshold tab.
  3. Select +, and then select Dynamic Threshold.

Sending a Test Alert

The Alert Routing tab is present when a threshold is set on a Datapoint. It provides a Send Test Alert function for Critical, Error, and Warning alerts.

Viewing Parents

Select the Parents tab to view parent information for the selected Datapoint.

In This Article