
OpenTelemetry Collector Installation from LogicMonitor Wizard
Last updated – 08 February, 2026
You can install an OpenTelemetry Collector in LogicMonitor using the OpenTelemetry Collector Installation Wizard. This wizard provides a guided process that enables you to do the following:
- Select your installation platform—Choose from Linux, Docker, Kubernetes, or Windows.
- Customize the configuration file—Modify configuration details as needed. For example, you can define your Cross-Origin Resource Sharing (CORS) policy by specifying the domains from which the collector can receive requests.
For more information about CORS, see Mozilla’s Cross-Origin Resource Sharing (CORS) documentation. - Generate installation commands—Obtain the appropriate installation command for your selected platform, and modify it if needed before deployment.
If you are installing the Collector in a containerized environment, you can further customize the installation by editing the provided command to include optional parameters.
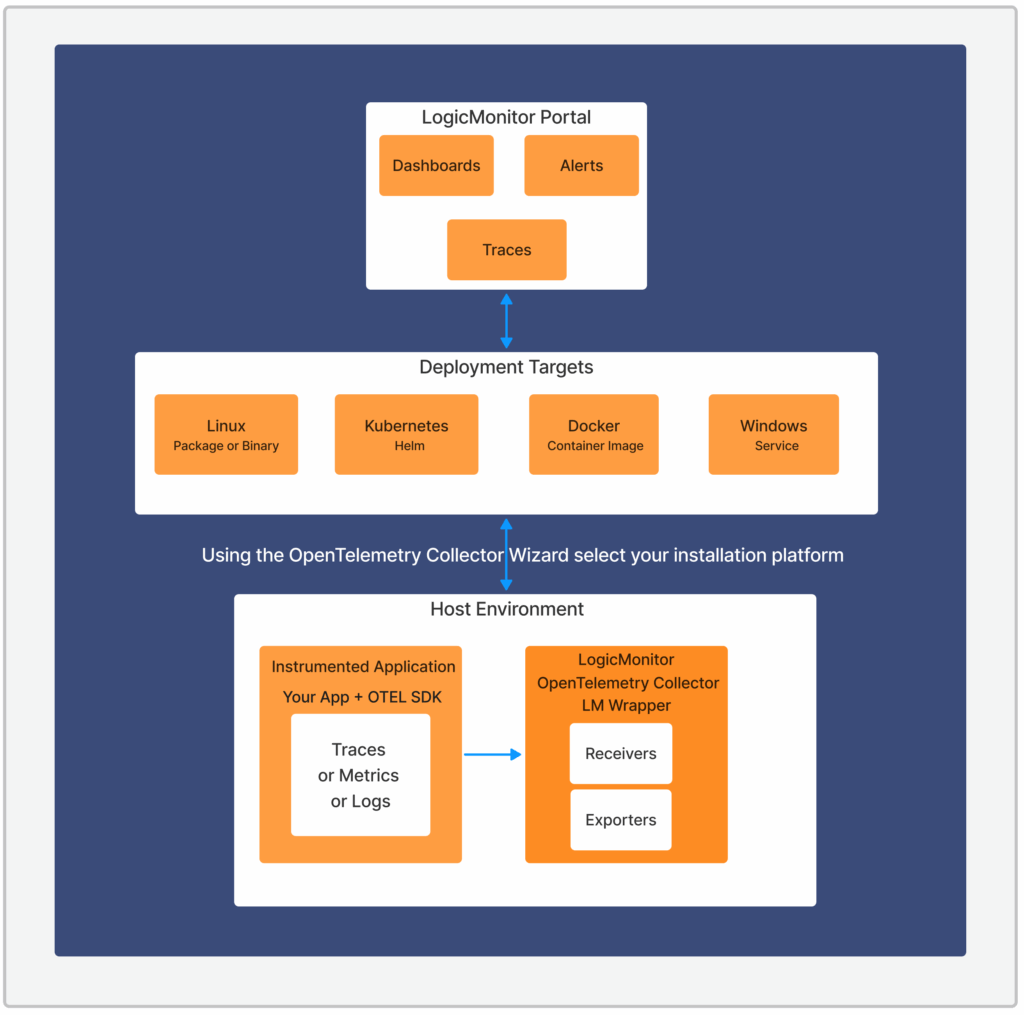
The following diagram illustrates the workflow for installing the OpenTelemetry Collector using the LogicMonitor wizard:
Requirements for OpenTelemetry Collector Installation using LogicMonitor Wizard
To install an OpenTelemetry Collector on Windows, you must have OpenTelemetry Collector version 6.0.00 or later.
Important: With OpenTelemetry Collector version 6.0.00 or later, you can use localhost instead of 0.0.00 in the default configuration for the otlpreceiver to enhance security and protect the lmotel collector fromdenial-of-service (DOS) attacks. For best practices on OpenTelemetry Collector configuration, see Protect against denial of service attacks from OpenTelemetry.
Installing an OpenTelemetry Collector on Linux
You can install the OpenTelemetry Collector on Linux as a root or non-root user. For root users, lmotel runs as a service; and for non-root users, lmotel runs as a process.
- In LogicMonitor, navigate to Settings > OpenTelemetry Collectors > Select Add.
Alternatively, if you have traces enabled, you can navigate to Traces > Onboarding, and then select Install OpenTelemetry Collector.
 - In the OpenTelemetry Collector Name field, enter a name for the Collector, and then select Linux for the platform.
- Select the version of the Collector you want to install from the Select version dropdown menu.
- In the Enable for dropdown menu, select one of the following:
- To configure the OpenTelemetry Collector to export traces, select “Traces”.
- To configure the OpenTelemetry Collector to export logs from local files, select “Logs”.
This includes exporting traces as well.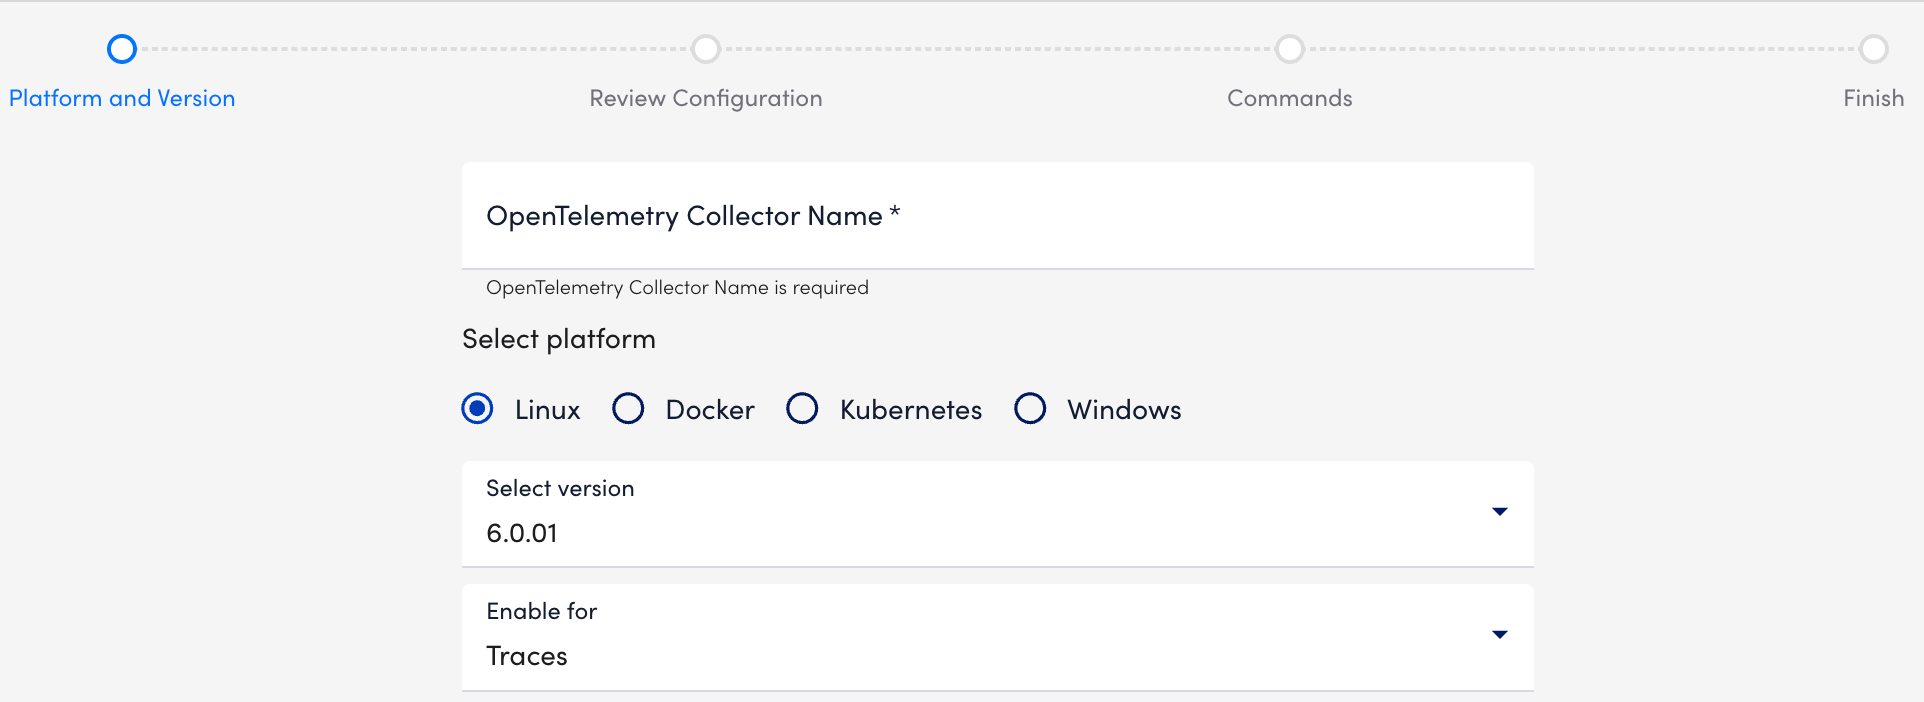
- At the Review Configuration step of the wizard, make changes to the configuration file as necessary to customize the Processors in the OpenTelemetry Collector settings. For more information about the modifications you can make, see Configurations for OpenTelemetry Collector Processors.
You can configure CORS by specifying the origins to allow requests. For more information, see CORS (Cross-origin resource sharing) from OpenTelemetry. - Select Validate to validate the configurations.
A success message displays when validation successfully completes. - At the Commands step of the wizard, modify the cURL command as needed, and then copy the command.
Note: The cURL command to download the Collector binary is only valid for two hours after it is made available.
- Select Finish to download the installer.
- Enable the installer to run, by doing the following:
- Enter the following on your Linux server:
(chmod +x installer_file) - Run the following:
(./installer_file)
- Enter the following on your Linux server:
- Run the following command to verify:
$ ps -ef | grep lmotel
The OpenTelemetry Collector is displayed on the OpenTelemetry Collector Settings page.
Installing an OpenTelemetry Collector in Docker
The wizard provides you with a preconfigured Docker run command for running a container with LogicMonitor’s OpenTelemetry Collector Docker image.
- In LogicMonitor, navigate to Settings > OpenTelemetry Collector > select Add.
Alternatively, navigate to Traces > Onboarding, and select Install OpenTelemetry Collector. - In the OpenTelemetry Collector Name field, enter a name for the Collector, and then select Docker for the platform.
- Select the version of the Collector you want to install from the Select version dropdown menu.
- In the Enable for dropdown menu, select one of the following:
- To configure the OpenTelemetry Collector to export traces, select “Traces”.
- To configure the OpenTelemetry Collector to export logs from local files, select “Logs”.
This includes exporting traces as well.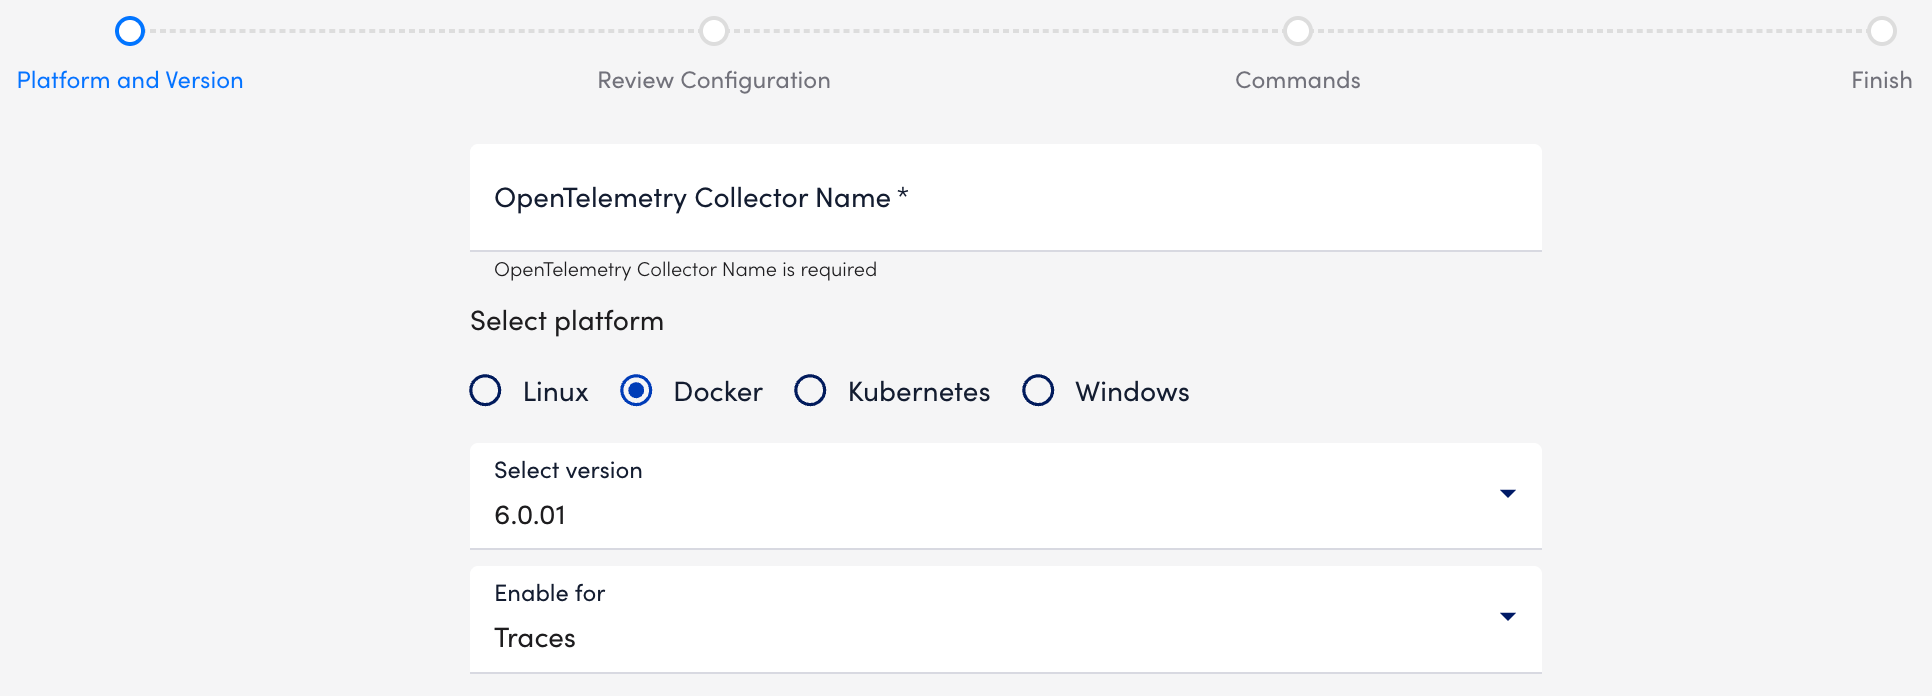
- At the Review Configuration step of the wizard, make changes to the configuration file as necessary to customize the Processors in the OpenTelemetry Collector settings.
For more information about the modifications you can make, see Configurations for OpenTelemetry Collector Processors.
You can configure CORS by specifying the origins to allow requests. For more information, see CORS (Cross-origin resource sharing) from OpenTelemetry. - Select Validate to validate the configurations.
A success message displays when validation successfully completes. - (Optional) Select Download Configuration to save the file as
lmconfig.yamlafter you edit and validate the configuration.
The command updates in the Commands step of the wizard with the-vflag as-v lmconfig.yaml:/lmconfig.yaml. You need to update this command to pass the absolute path of the downloaded config, for example,-v <absolute_path_to_external_config>:/lmconfig.yaml. - Select Next: Commands and do the following:
- In the Username field, enter the username for the user with the minimum privileges.
This is the API-only user you created for installing the OpenTelemetry Collector.
An Access ID and Access Key are automatically created for this user. This is required to authenticate to Docker when you install the OpenTelemetry Collector in your Docker container. - In the Note field, enter any additional information.
- Copy the Run command to use for installing the Collector.
You can modify this command as needed by entering optional parameters in the command. For more information, see Configurations for OpenTelemetry Collector Container Installation.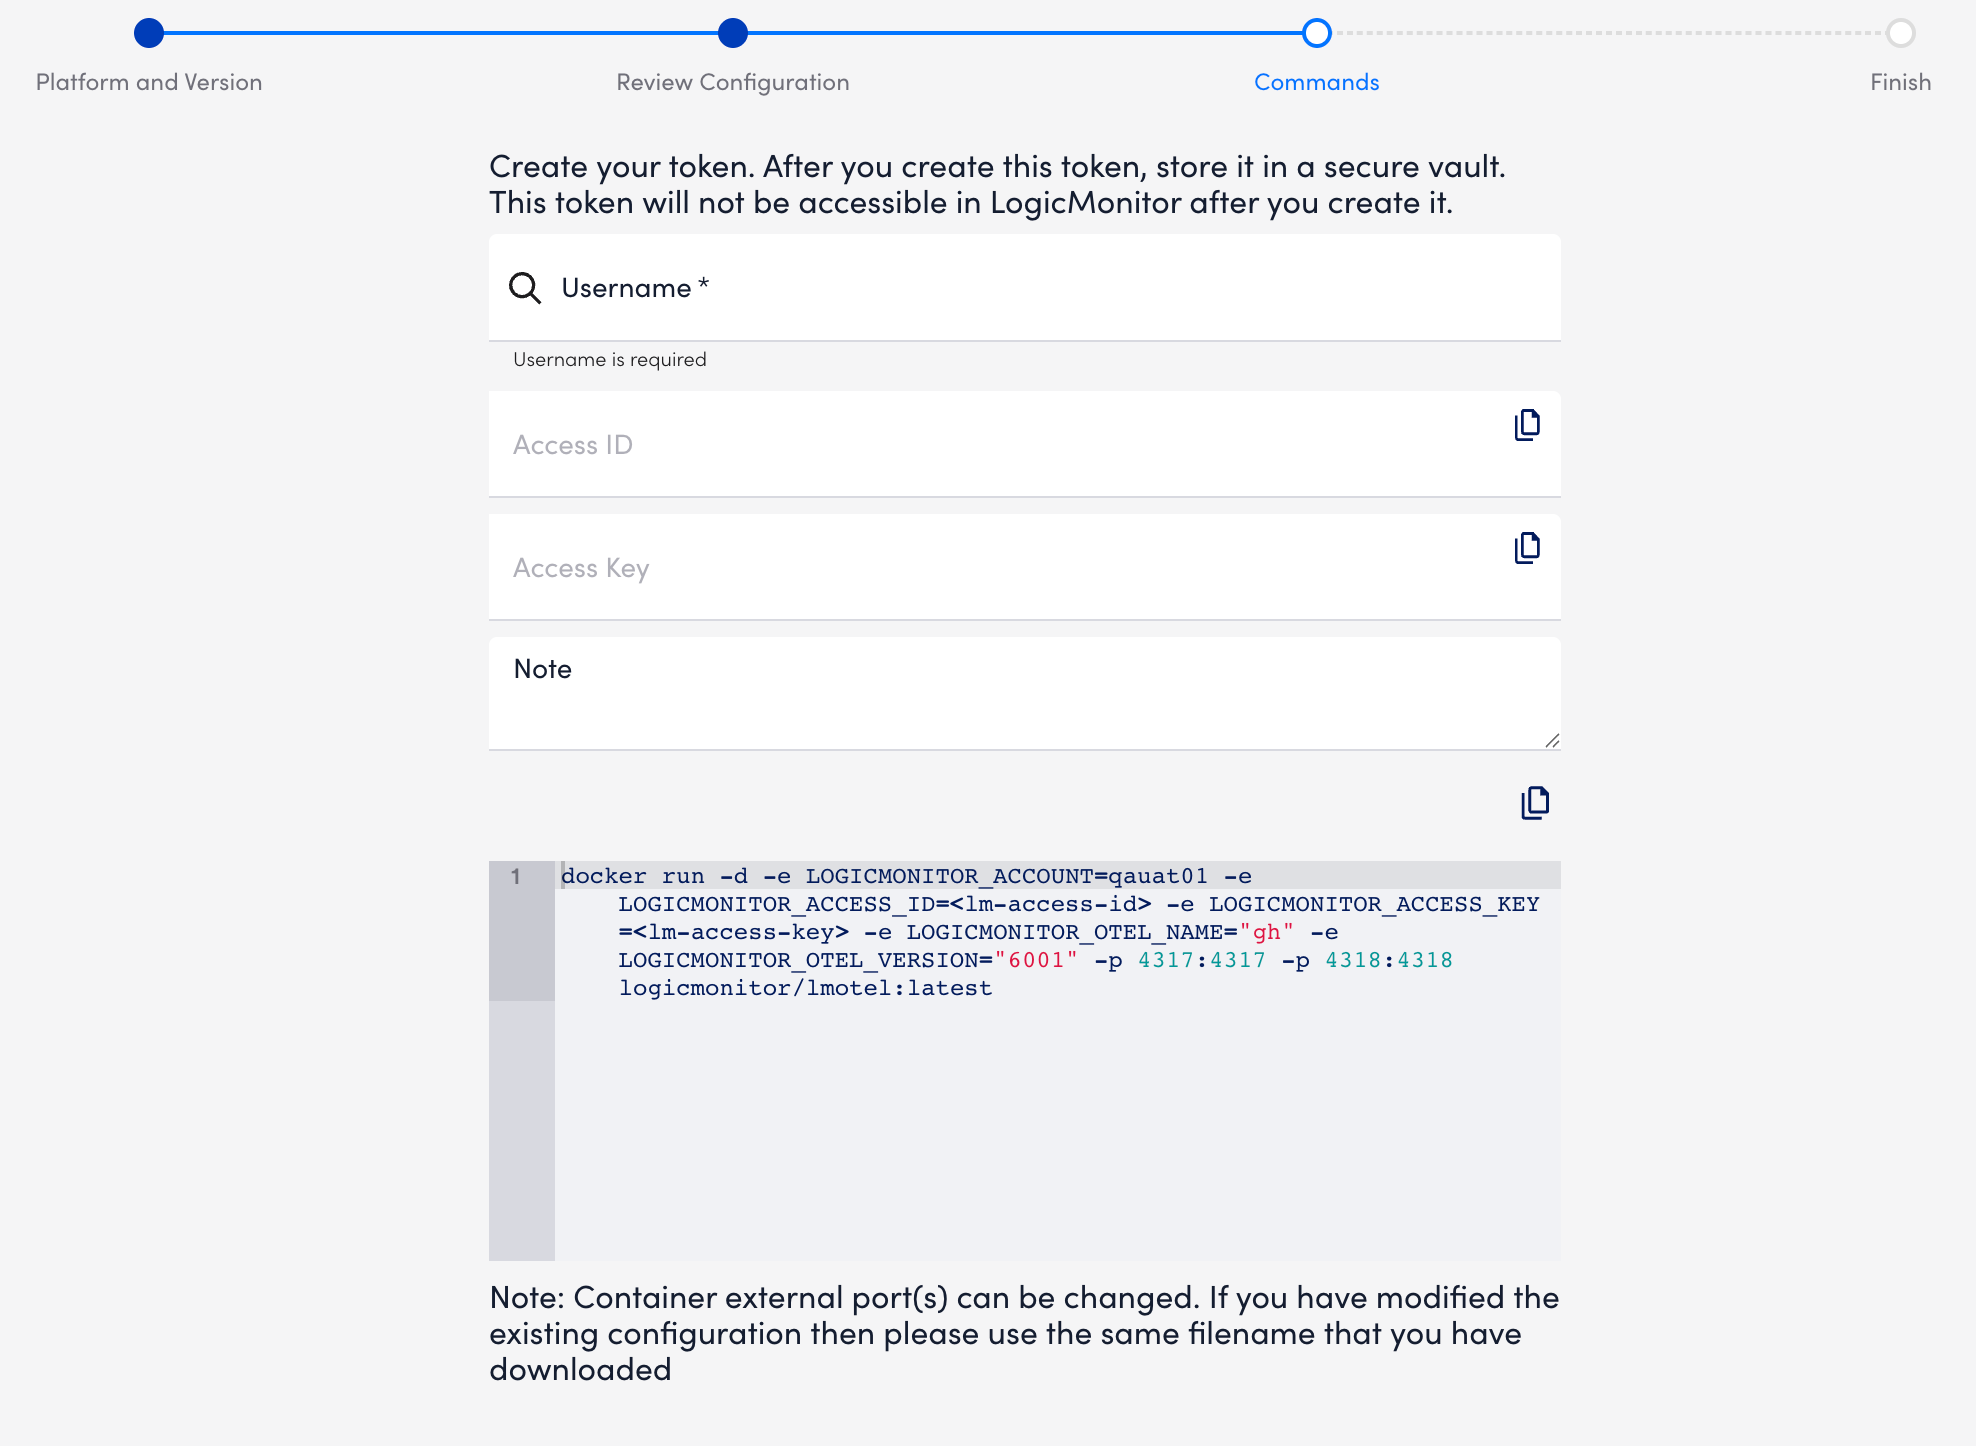
- In the Username field, enter the username for the user with the minimum privileges.
- Select Finish to download the installer.
- Install the OpenTelemetry Collector in Docker by using the command you copied from the OpenTelemetry Wizard in your preferred command-line interface.
Note: If using Microsoft Azure App Service, you can deploy the OpenTelemetry Collector to an Azure Container Instance after you install it in Docker. For more information, see Configurations for OpenTelemetry Collector Deployment in Microsoft Azure Container Instance.
The OpenTelemetry Collector is displayed on the OpenTelemetry Collector Settings page.
Installing an OpenTelemetry Collector in Kubernetes
LogicMonitor provides Helm Charts for deploying the OpenTelemetry Collector as a ReplicaSet within Kubernetes. The setup wizard includes preconfigured Helm commands for adding LogicMonitor charts and installing the Collector with your configuration. You can also specify an Ingress endpoint to enable communication across hybrid environments, ensuring that Kubernetes-based Collectors can interact with services and resources hosted elsewhere.
- In LogicMonitor, navigate to Settings> OpenTelemetry Collectors> Select Add.
Alternatively, if you have traces enabled, you can navigate to Traces> Onboarding, and then select Install OpenTelemetry Collector. - In the OpenTelemetry Collector Name field, enter a name for the Collector, and then select Kubernetes for the platform.
- Select the version of the Collector you want to install from the Select version dropdown menu.
- In the Enable for dropdown menu, select one of the following:
- To configure the OpenTelemetry Collector to export traces, select “Traces”.
- To configure the OpenTelemetry Collector to export logs from local files, select “Logs”.
This includes exporting traces as well.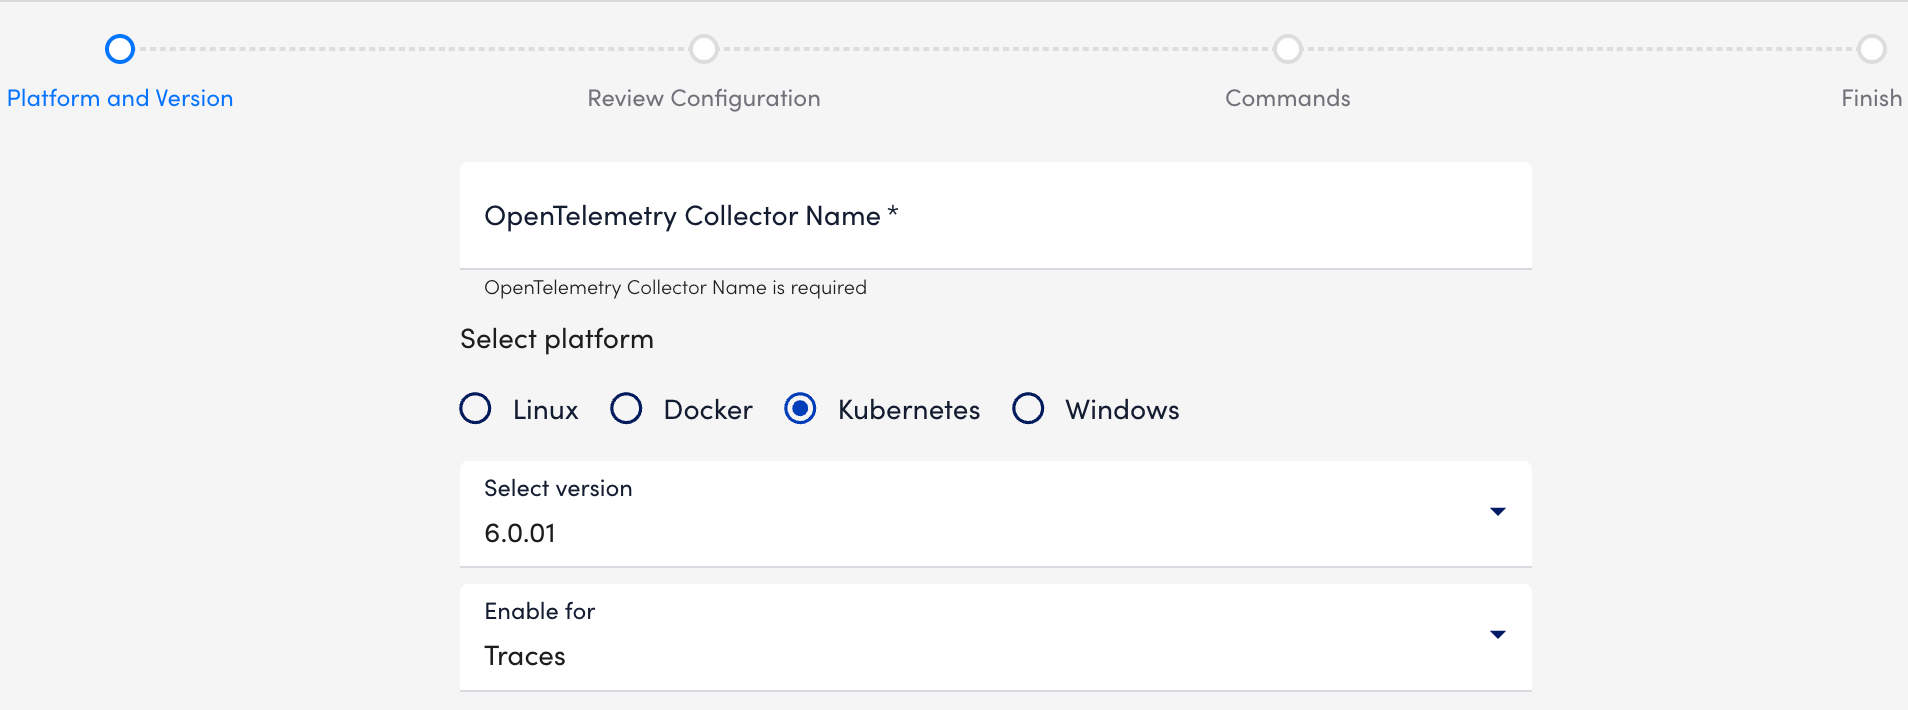
- At the Review Configuration step of the wizard, make changes to the configuration file as necessary to customize the Processors in the OpenTelemetry Collector settings. For more information about the modifications you can make, see Configurations for OpenTelemetry Collector Processors.
You can configure CORS by specifying the origins to allow requests. For more information, see CORS (Cross-origin resource sharing) from OpenTelemetry. - Select Validate to validate the configurations.
A success message displays when validation successfully completes. - (Optional) Select Download Configuration to save the file as
lmconfig.yamlafter you edit and validate the configuration.
The command updates in the Commands step of the wizard with the--setflag as--set-file=external_config.lmconfig=lmconfig.yaml \. You need to update this command to pass the absolute path of the downloaded config, for example,--set-file=external_config.lmconfig=<absolute_path_of_external_config_file>. - Select Next: Commands and do the following:
- In the Username field, enter the username for the user with the minimum privileges.
This is the API-only user you created for installing the OpenTelemetry Collector.
An Access ID and Access Key are automatically created for this user. This is required to authenticate to Kubernetes when you install the OpenTelemetry Collector in your Kubernetes container. - In the Note field, enter any additional information.
- In the Kubernetes Namespace field, enter your namespace name.
- In the Replica Count field, select the required replica count.
The default value is 1. - In the Ingress Endpoint field, enter the Ingress Endpoint on which the Ingress Controller listens for incoming spans if you want to leverage an Ingress resource
- Copy the Helm Chart command to use for installing the Collector.
You can modify this command as needed by entering the following:- Optional parameters
For more information, see Configurations for OpenTelemetry Collector Container Installation. - Additional properties for leveraging an Ingress resource
For more information, see Configuration for Ingress Resource for OpenTelemetry Kubernetes Installation.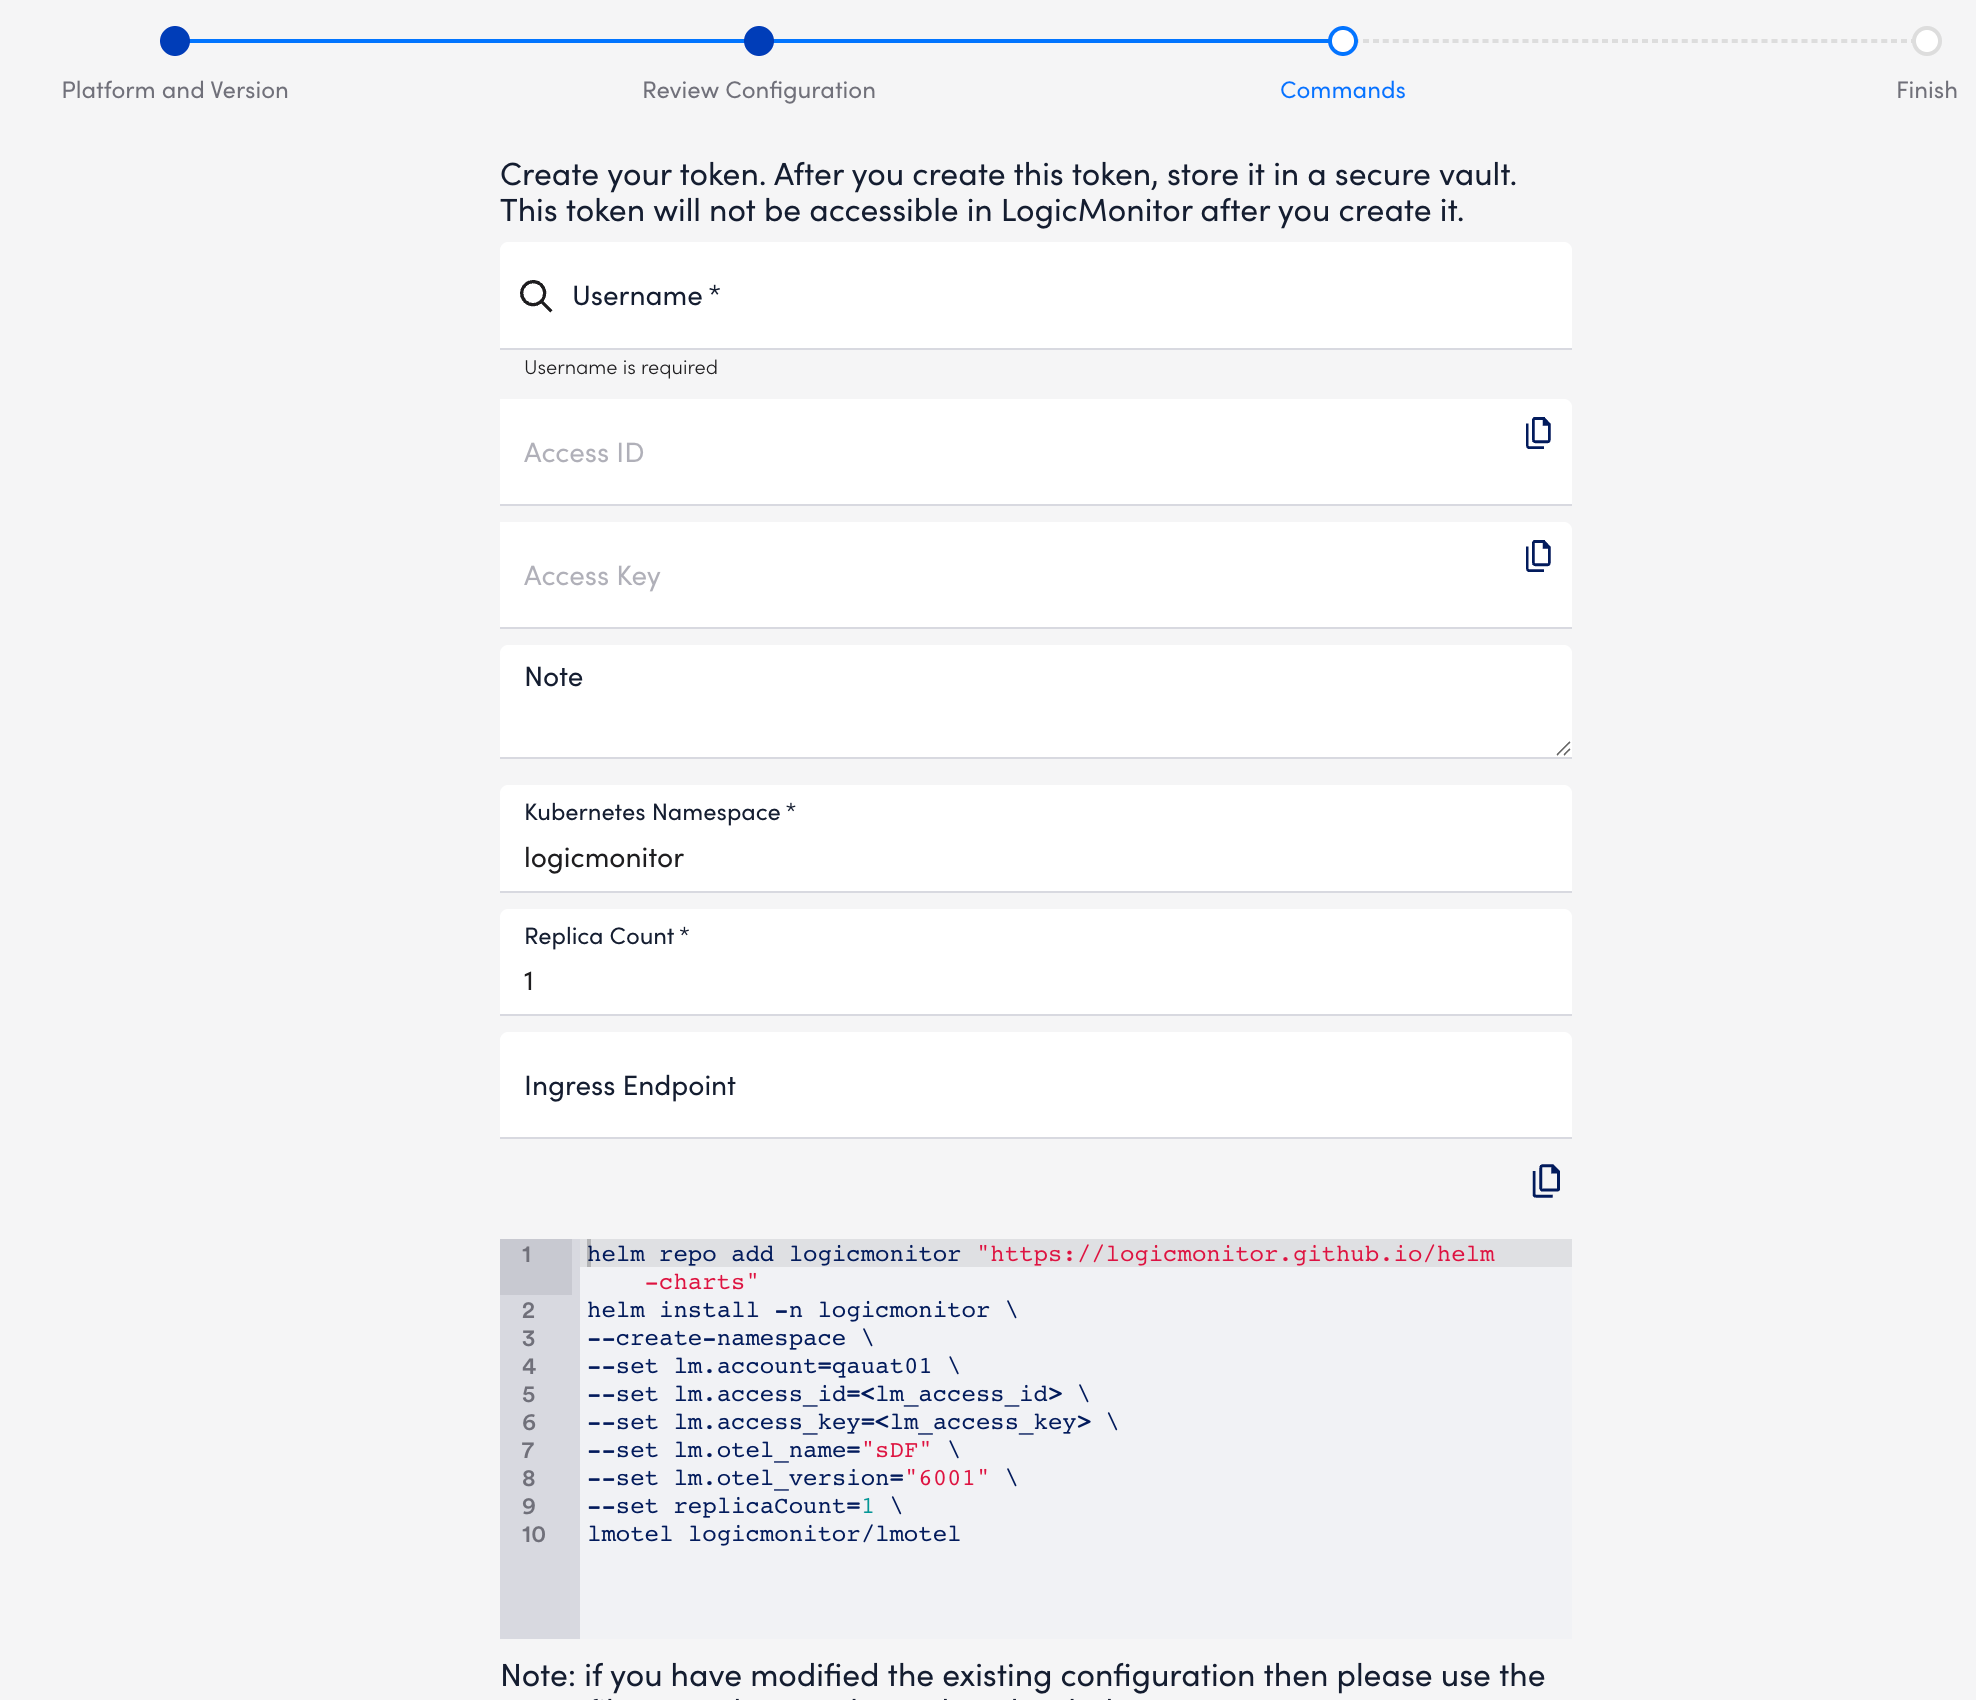
- Optional parameters
- In the Username field, enter the username for the user with the minimum privileges.
- Select Finish to download the installer.
- Install the OpenTelemetry Collector in Kubernetes by using the command you copied from the OpenTelemetry Wizard in your preferred command-line interface.
The OpenTelemetry Collector is displayed on the OpenTelemetry Collector Settings page.
Installing an OpenTelemetry Collector on Windows
- In LogicMonitor, navigate to Settings> OpenTelemetry Collectors> Select Add.
Alternatively, if you have traces enabled, you can navigate to Traces> Onboarding, and then select Install OpenTelemetry Collector. - In the OpenTelemetry Collector Name field, enter a name for the Collector, and then select Windows for the platform.
- Select the version of the Collector you want to install from the Select version dropdown menu.
- In the Enable for dropdown menu, select one of the following:
- To configure the OpenTelemetry Collector to export traces, select “Traces”.
- To configure the OpenTelemetry Collector to export logs from local files, select “Logs”.
This includes exporting traces as well.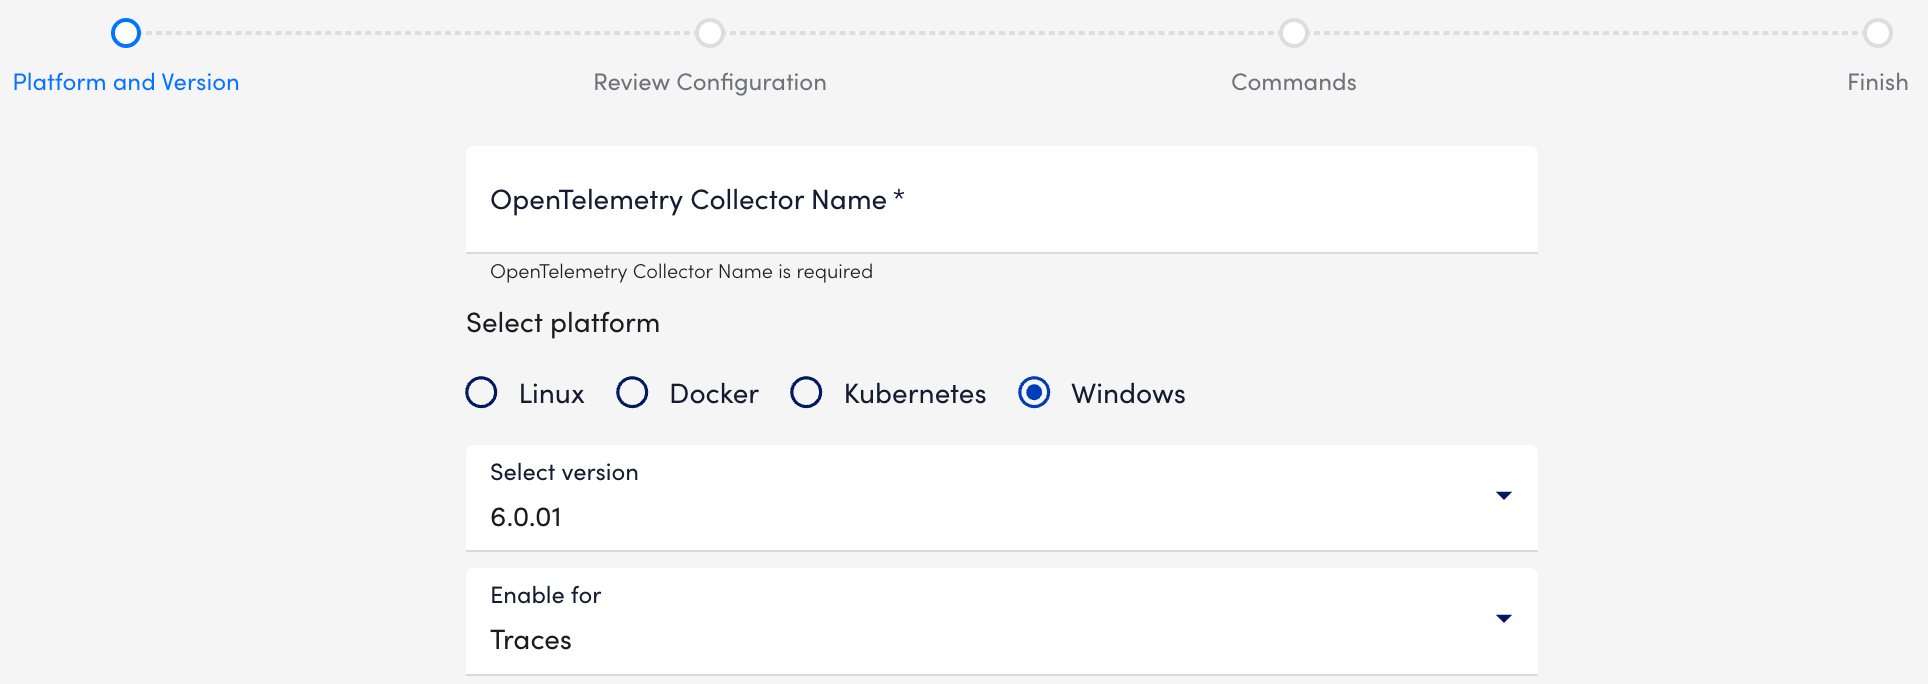
- At the Review Configuration step of the wizard, make changes to the configuration file as necessary to customize the Processors in the OpenTelemetry Collector settings.
For more information about the modifications you can make, see Configurations for OpenTelemetry Collector Processors.
You can configure CORS by specifying the origins to allow requests. For more information, see CORS (Cross-origin resource sharing) from OpenTelemetry. - Select Validate to validate the configurations.
A success message displays when validation successfully completes. - Select Next: Commands and modify the command as needed, and then copy the command.
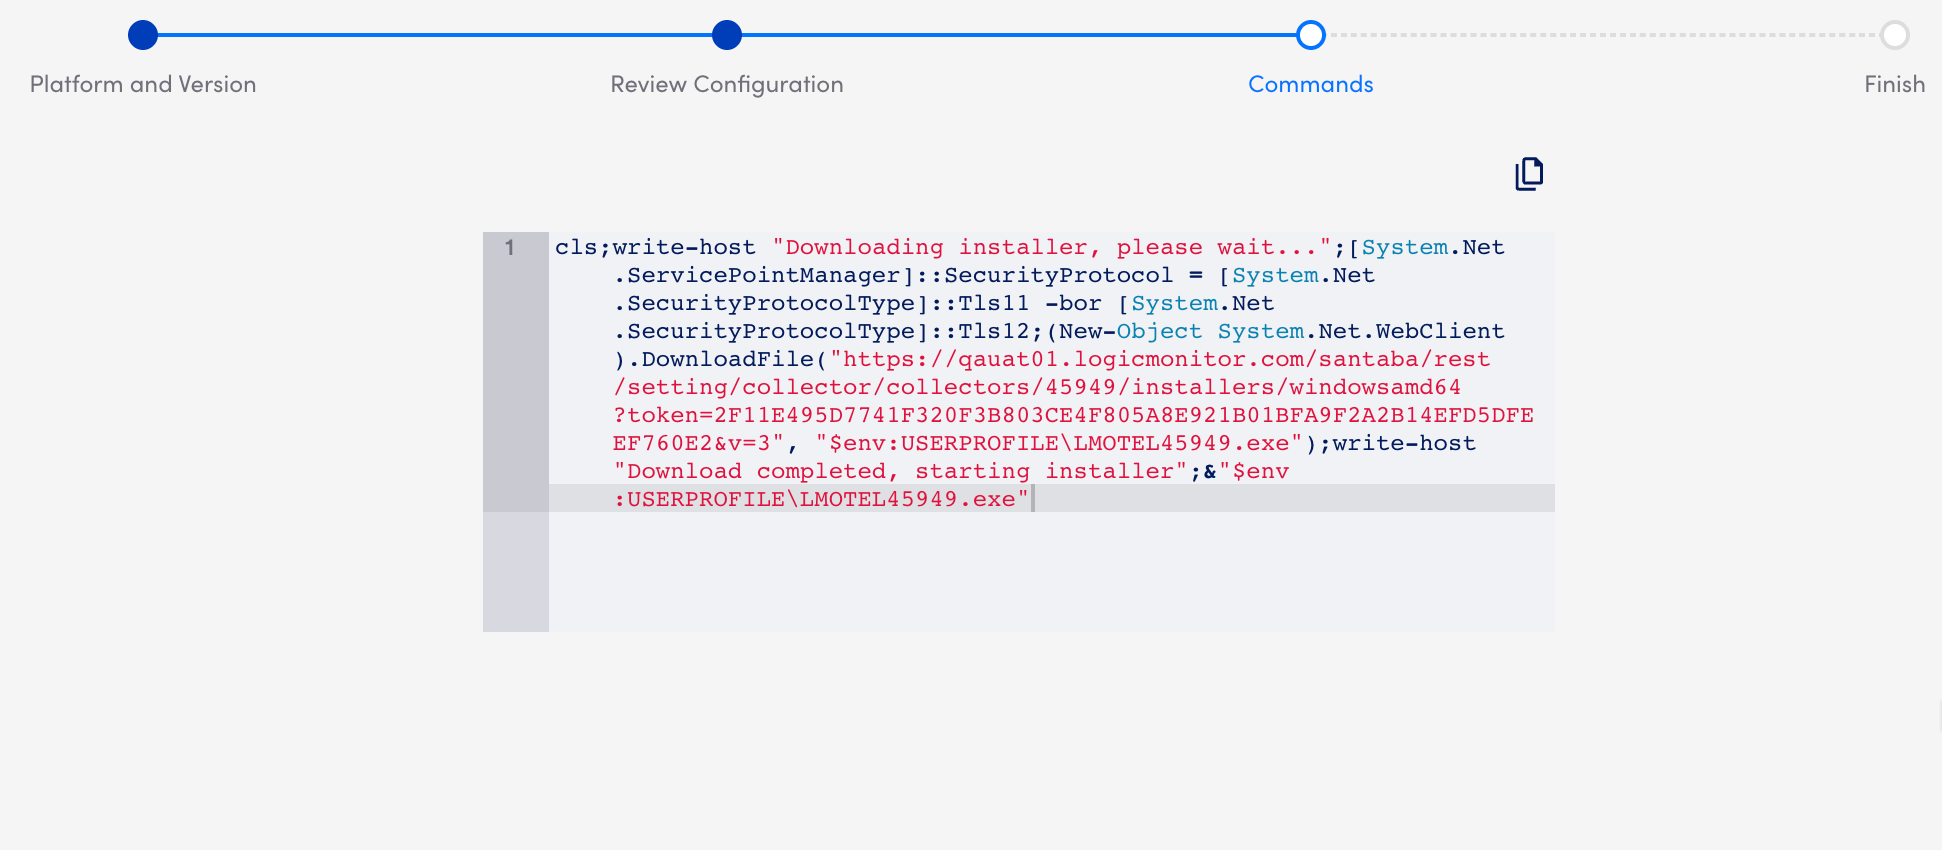
- Select Finish to download the installer.
- On your Windows server, do the following:
- Download the installer file directly to your server and run it using PowerShell.
The InstallShield Wizard starts automatically. - On the InstallShield Wizard, follow the onscreen instructions.
- Select “Create a new default local non-admin account” for least privileges environments to ensure security and restricted access.
- Download the installer file directly to your server and run it using PowerShell.
Note: Use a User Account with adequate permissions to run the LogicMonitor OpenTelemetry Collector service. The Local System Account is not recommended for least-privilege environments.
The OpenTelemetry Collector is installed successfully on your Windows server.
