
Action Rules Configuration
Last updated - 08 May, 2026
The Action Rules enable you to define conditions where an alert that matches the Action rule filters triggers the Action chain (associated with the Action rule) which in turn runs its defined stages (DiagnosticSources or RemediationSources) and associates the results with the resource.
You must define filters to trigger an Action rule that includes resource groups, resources, resource properties, LogicModules, instances, datapoints, and alert severity levels. When the conditions are met, the Action rule runs automatically to diagnose and remediate the issue. If multiple Action rules match the same alert, the first five matching rules run their associated Action chains. The evaluation order is based on the sequence of updates, where the most recently updated Action rule runs first.
Note:
- Action rules run in parallel with Alert rules. When an alert triggers, it triggers both Action rules and Alert rules to run. However, there is no dependency between the two.
- An alert can trigger multiple Action rules, and the evaluation order is based on the sequence of updates, where the most recently updated Action rule is evaluated first.
- If multiple Action rules are triggered, and there are duplicate DiagnosticSource or RemediationSource modules to be run, only one instance of each module is run per alert.
By default, an Action rule is enabled for use. If you disable it, the Action rule does not run Action chains associated with it when alerts match their conditions.
You can define an Action rule that includes all your servers. When the CPU utilization for datapoints reaches a critical alert level, the system automatically runs the top CPU processes DiagnosticSources and RemediationSources on that resource.
In addition, you can manage Action rules to keep them up to date. Managing your Action rules involves editing, deleting, enabling and disabling rules, and creating a duplicate of an Action rule.
Requirements for Configuring Action Rules
To configure Action rules, you need the following:
- LogicMonitor Collector with EA Collector 39.500 or later installed on your machine.
For more information, see Adding Collector. - Action chains to specify in the Action rules.
For more information, see Action Chains Configuration. - A LogicMonitor user with the View and Manage permissions for “Action Chain and Rules” Settings.
For more information, see Users and Roles. - Resources including cloud resources monitored by local Collectors.
For more information, see Enable Monitoring via Local Collector.
Configuring Action Rules
- In LogicMonitor, navigate to Settings > Action Settings > Action Rules.
The Action Rules page displays.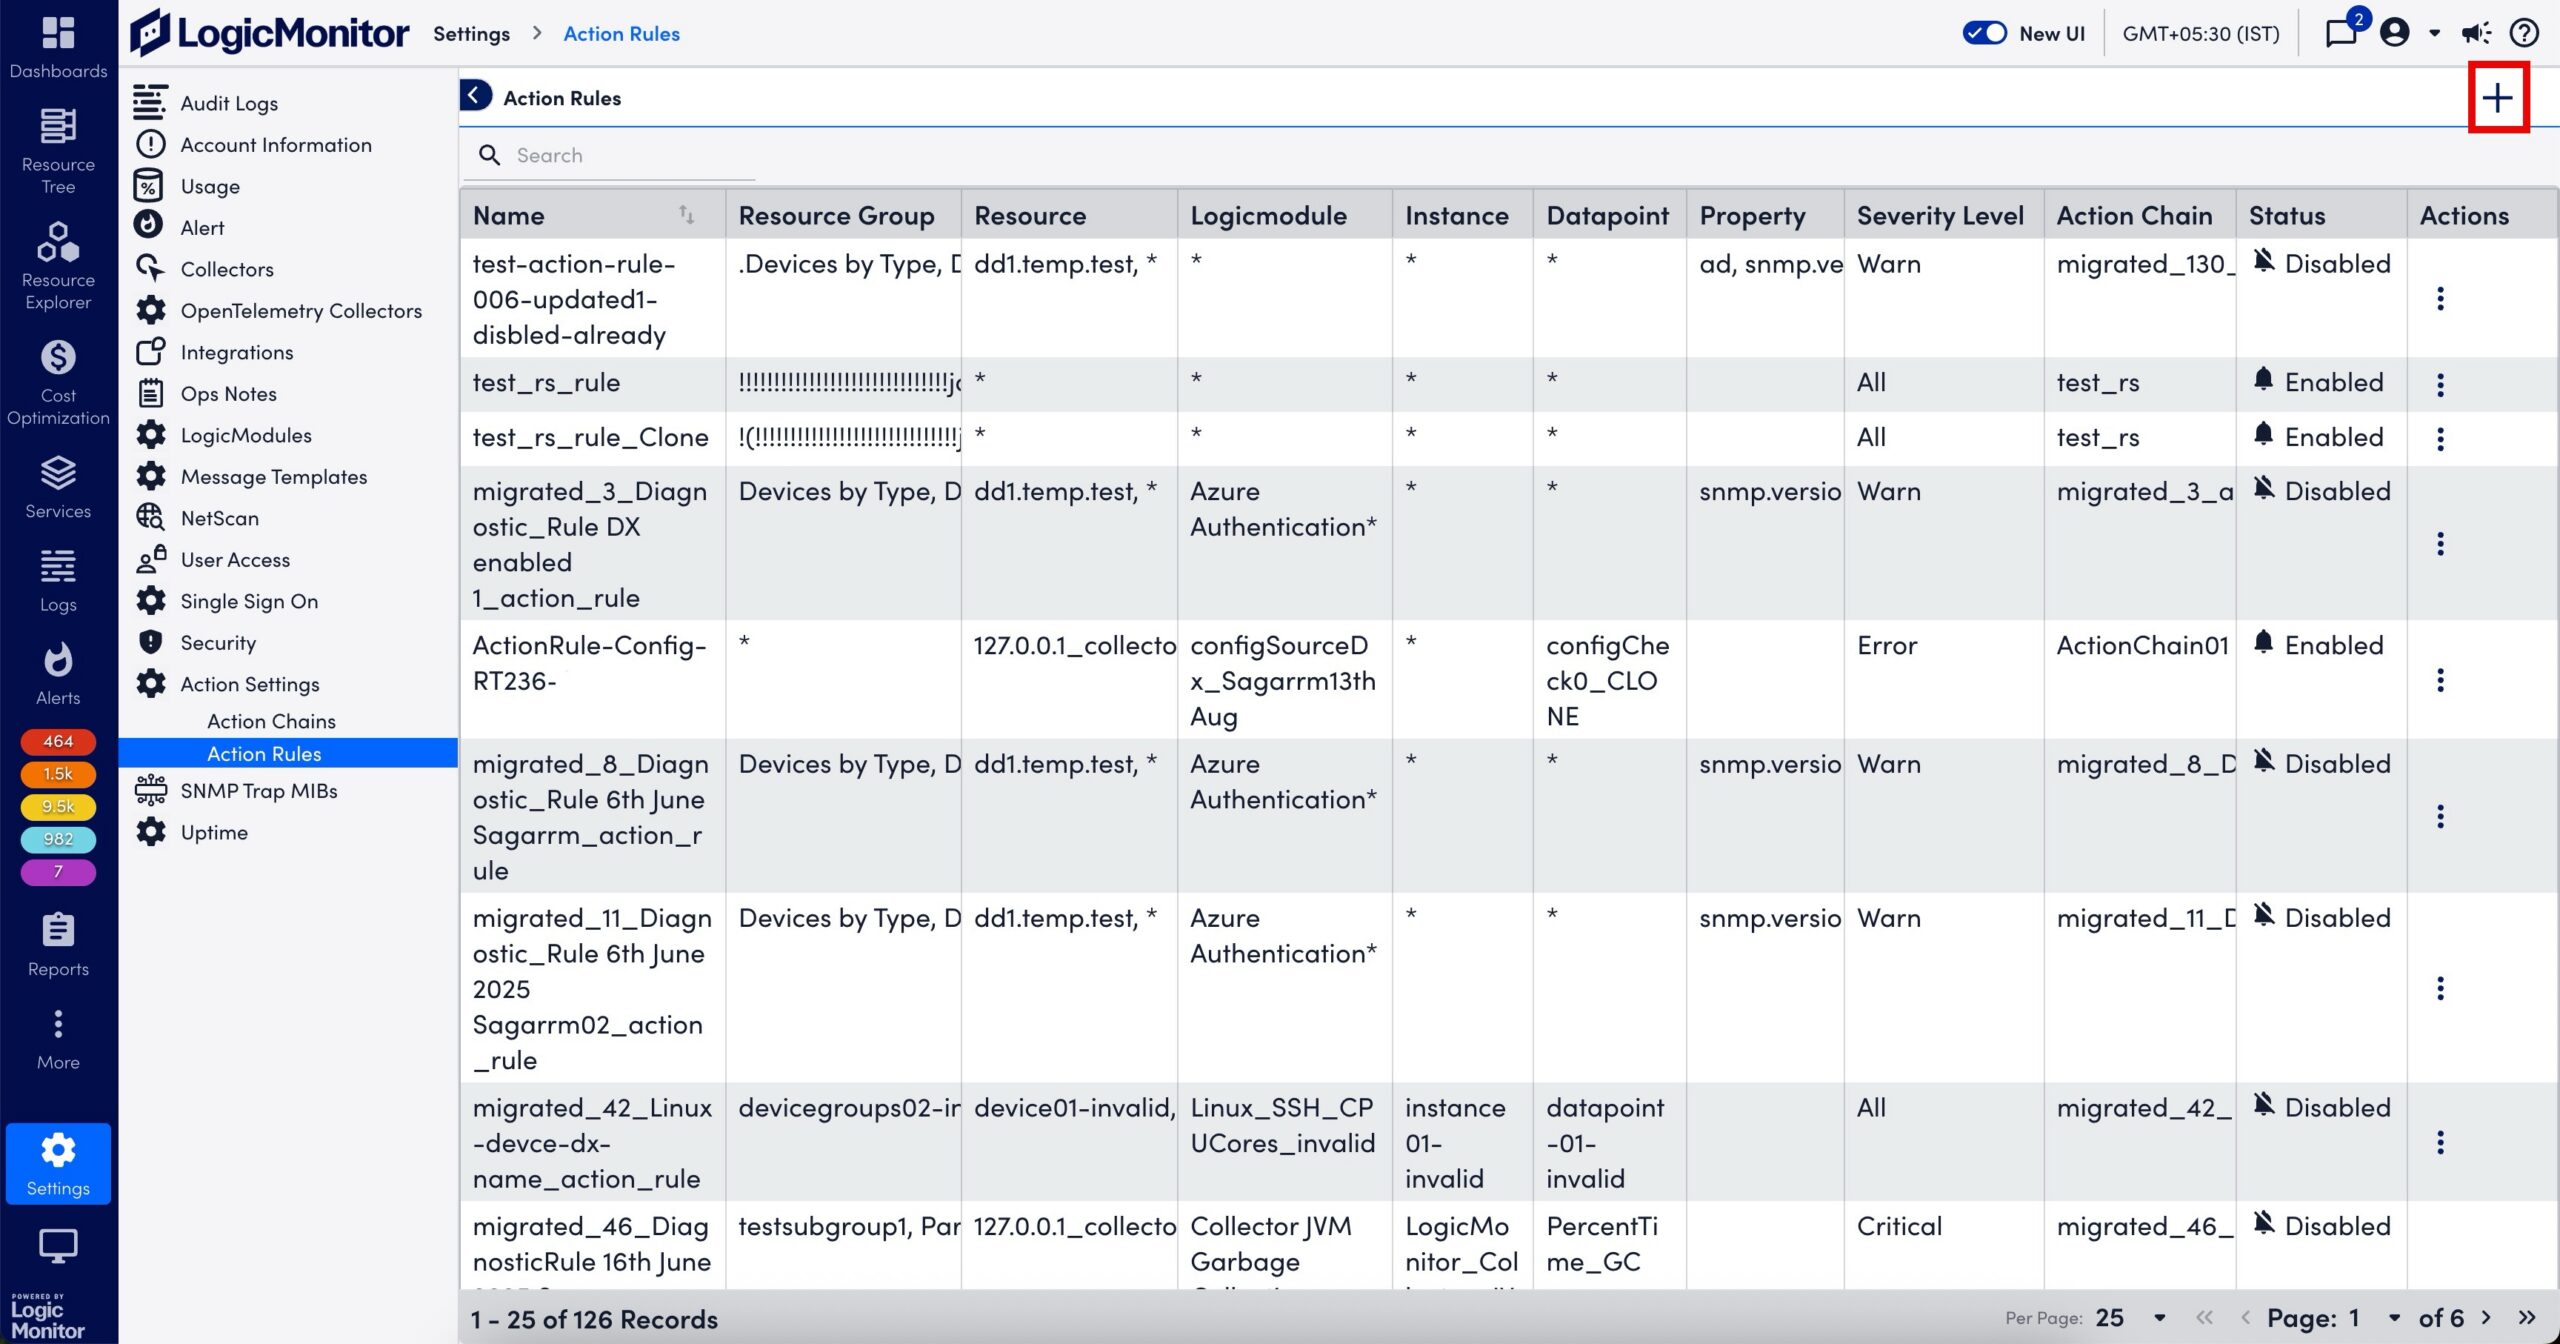
- Select

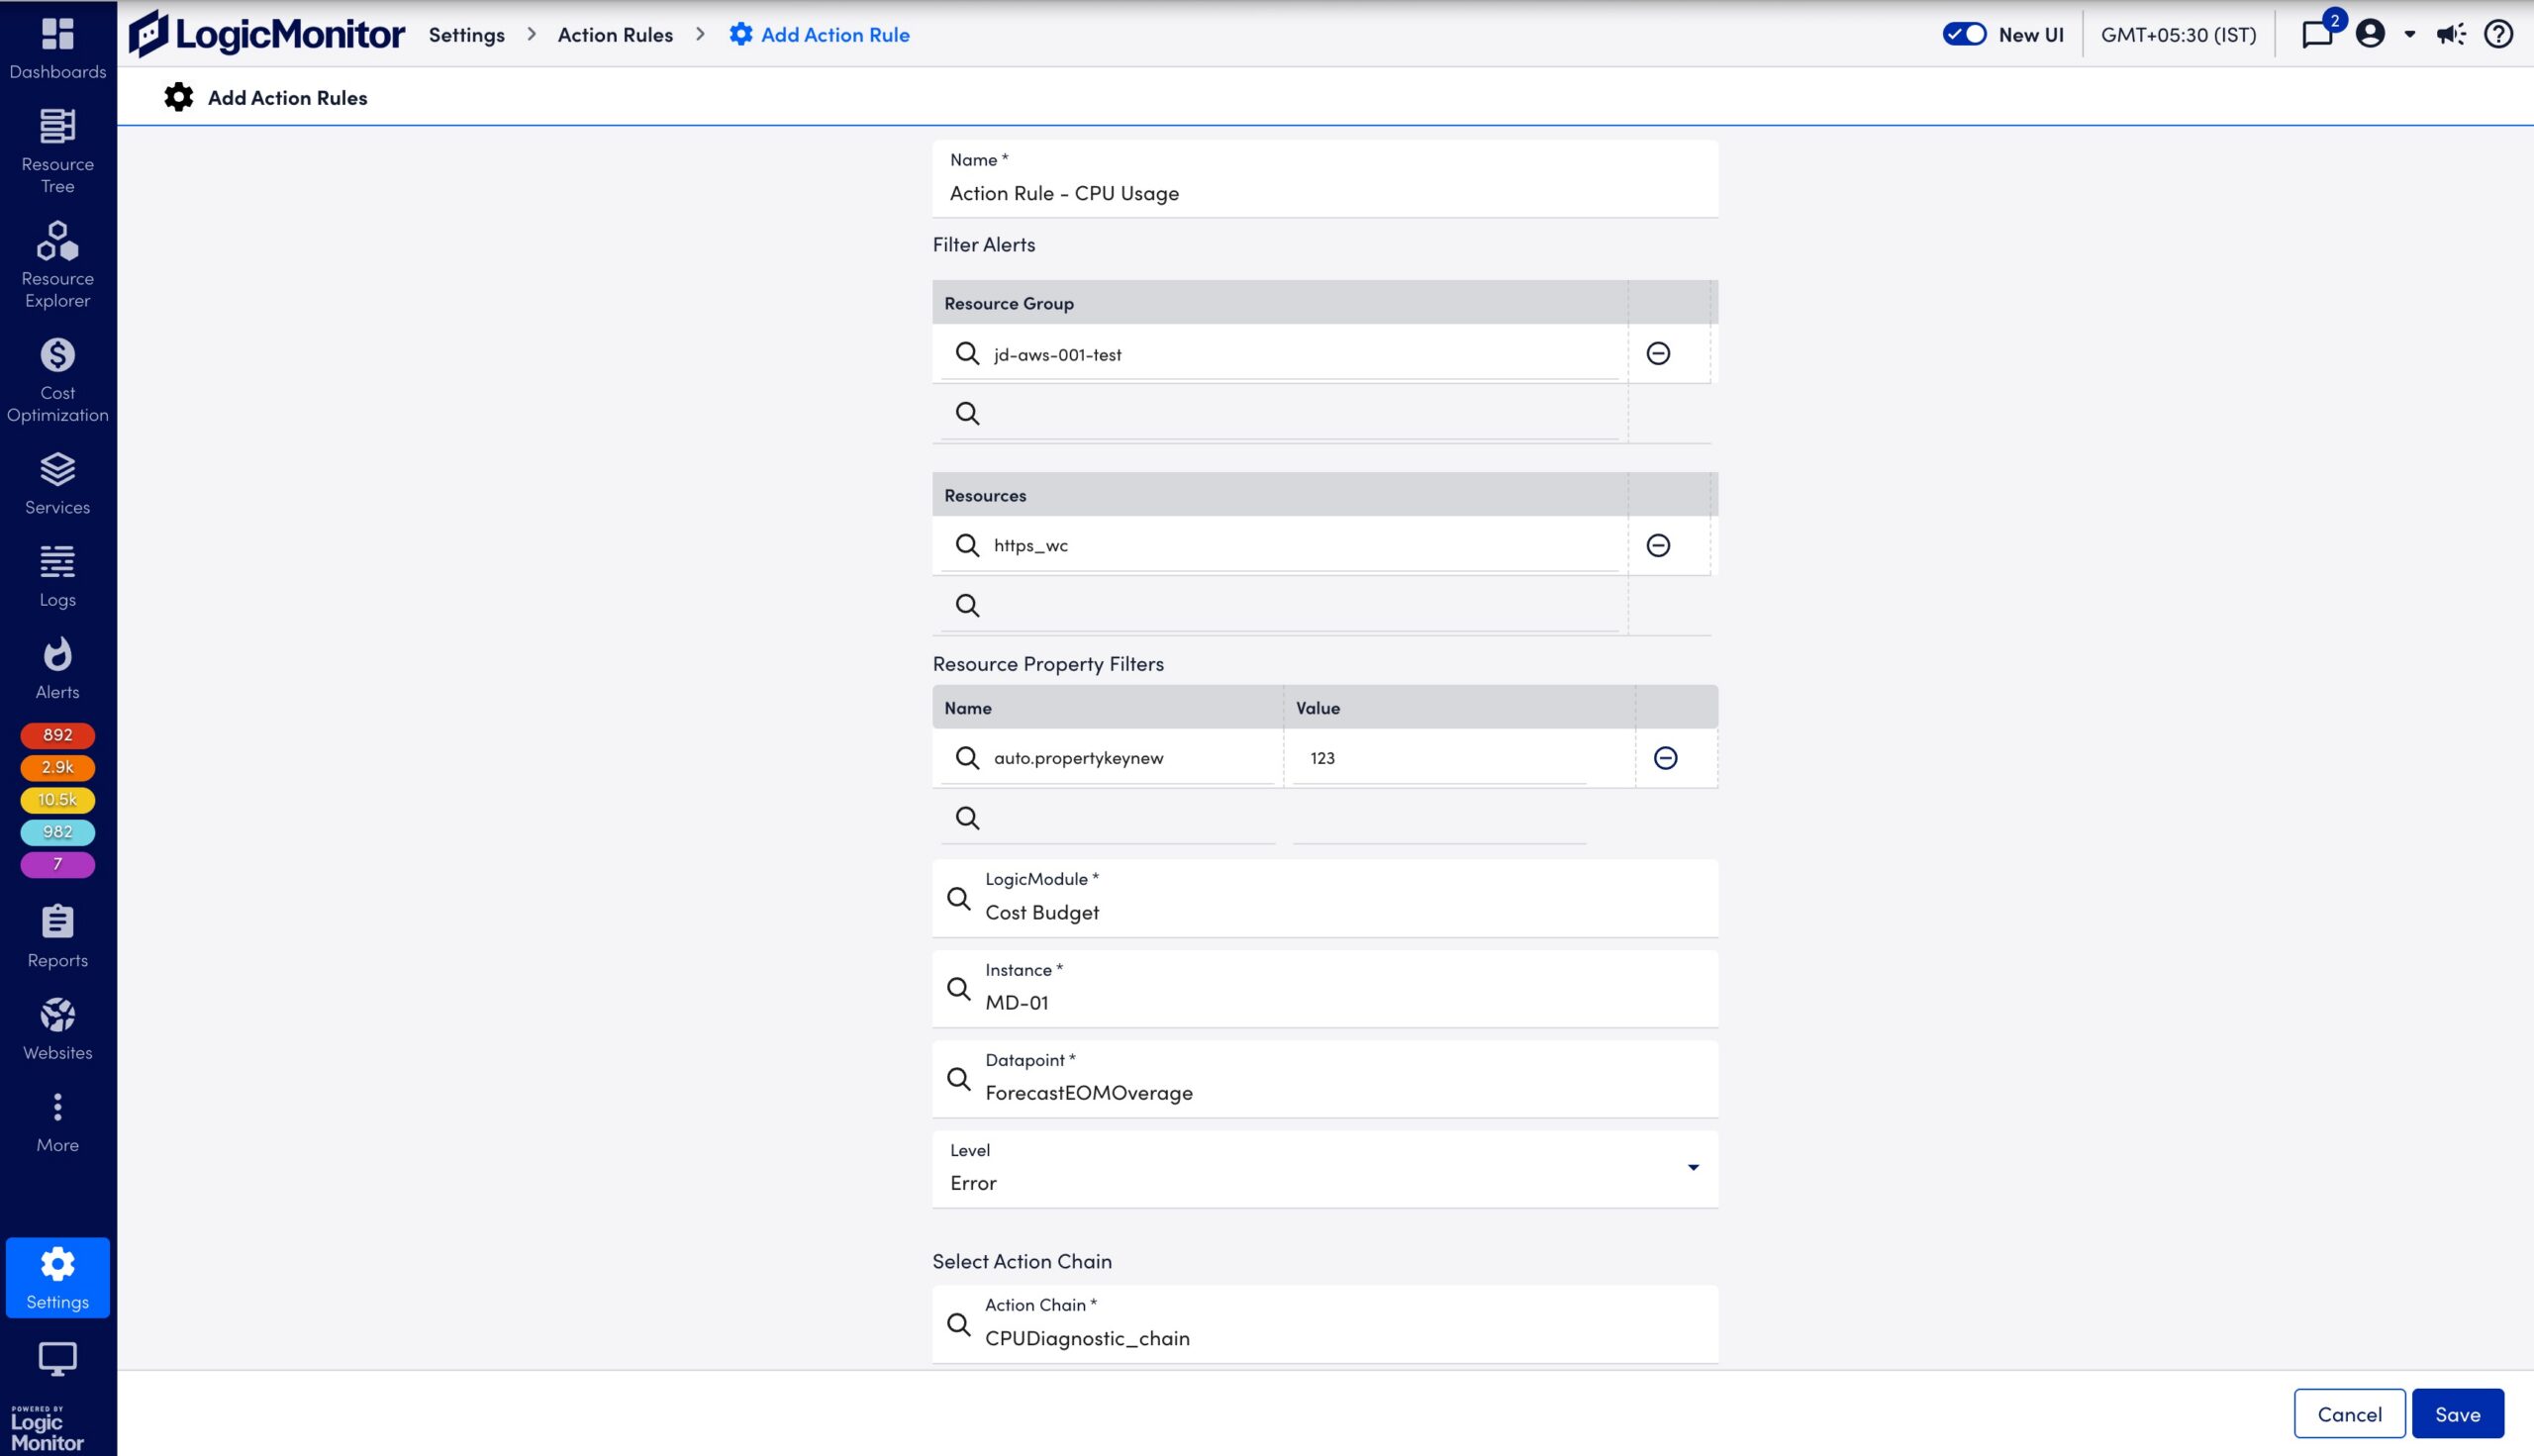
The Add Action Rules page displays. - In the Name field, enter a unique name for the Action rule.
- In the Filter Alerts section, specify the following:
- In the Resource Group field, enter a value for the resource group.
LogicMonitor attempts to match results as you type. - In the Resource field, enter a value for the resource.
LogicMonitor attempts to match results as you type.
- In the Resource Group field, enter a value for the resource group.
- In the Resource Property Filters section, to specify a single or multiple resource properties, do the following:
- In the Name field, select a resource property.
- In the Value field, enter the value of the selected resource property.
- In the LogicModule field, specify a LogicModule the alert must be triggered by to match the Action rule.
- In the Instance field, specify the instance the alert must be triggered by to match the Action rule.
- In the Datapoint field, specify the datapoint the alert must be triggered by to match the Action rule.
Note: In the LogicModule, Instance, and Datapoint fields, you can enter a wildcard (*) to include all LogicModules, instances, and datapoints respectively. You can also use glob expressions and wildcard matching. For more information, see Glob expressions.
- Select a level of alert severity that must automatically trigger execution of Action chain from the Level dropdown menu.
- In the Select Action Chain section, specify the following:
- In the Action Chain field, select a single Action chain.
- In the Action Chain field, select a single Action chain.
- Select Save.
The Action rule is created and added to the Action Rules page. By default, the Action rule is enabled for use.
