Usage Reporting for LM Uptime
Last updated - 17 March, 2026
You can leverage Usage Reporting to view the usage metrics for LM Uptime resources directly in the LogicMonitor portal. The usage metrics display the monthly average number of visits to your monitored websites.
Billing and Usage Calculations for LM Uptime
LM Uptime billing is based on the monthly total number of uptime check executions, calculated across all monitored resources and check types (For example, Web Check or Ping Check). The following table describes how LM Uptime usage is calculated and how it contributes to billing:
| Usage Element | Description | How it Affects Billing |
| Uptime Check Execution | A single execution of a Ping Check or Web Check against a monitored resource | Counts toward the monthly execution total |
| Check Frequency | How often a check runs (up to once per minute) | Higher frequencies increase the number of executions |
| Monthly Execution Total | Sum of all uptime check executions performed during the month | Compared against the included execution allowance |
| Included Usage per Unit | Each LM Uptime unit includes up to 10,000 check executions per month | Usage beyond this amount requires additional units |
| Combined Metrics | Total executions across all LM Uptime check types | Used for billing calculations |
Note: Billing is based on the total number of uptime check executions during the month, not on the number of monitored resources or the maximum checks executed at a single point in time.
Requirements for Viewing Usage Data for LM Uptime Monitoring
To view usage data for LM Uptime resources in Usage Reporting, you must have the LM Uptime license edition.
Viewing Usage Data for LM Uptime
- In LogicMonitor, navigate to Settings > Usage.
- Select “LM Uptime” from the Product dropdown menu.
- To interact with the Usage Contributors table, select “All Child Accounts” from the Contributor Type dropdown menu.
- Select a month to view the usage date for websites.
- Do one of the following:
- To view the combined metrics for all LM Uptime resources, select the Combined Metrics tab.
The total number of datapoints defined for LM Uptime resources is displayed, and the visual components update accordingly. - To view the metrics for Ping Checks, select the Ping Check tab.
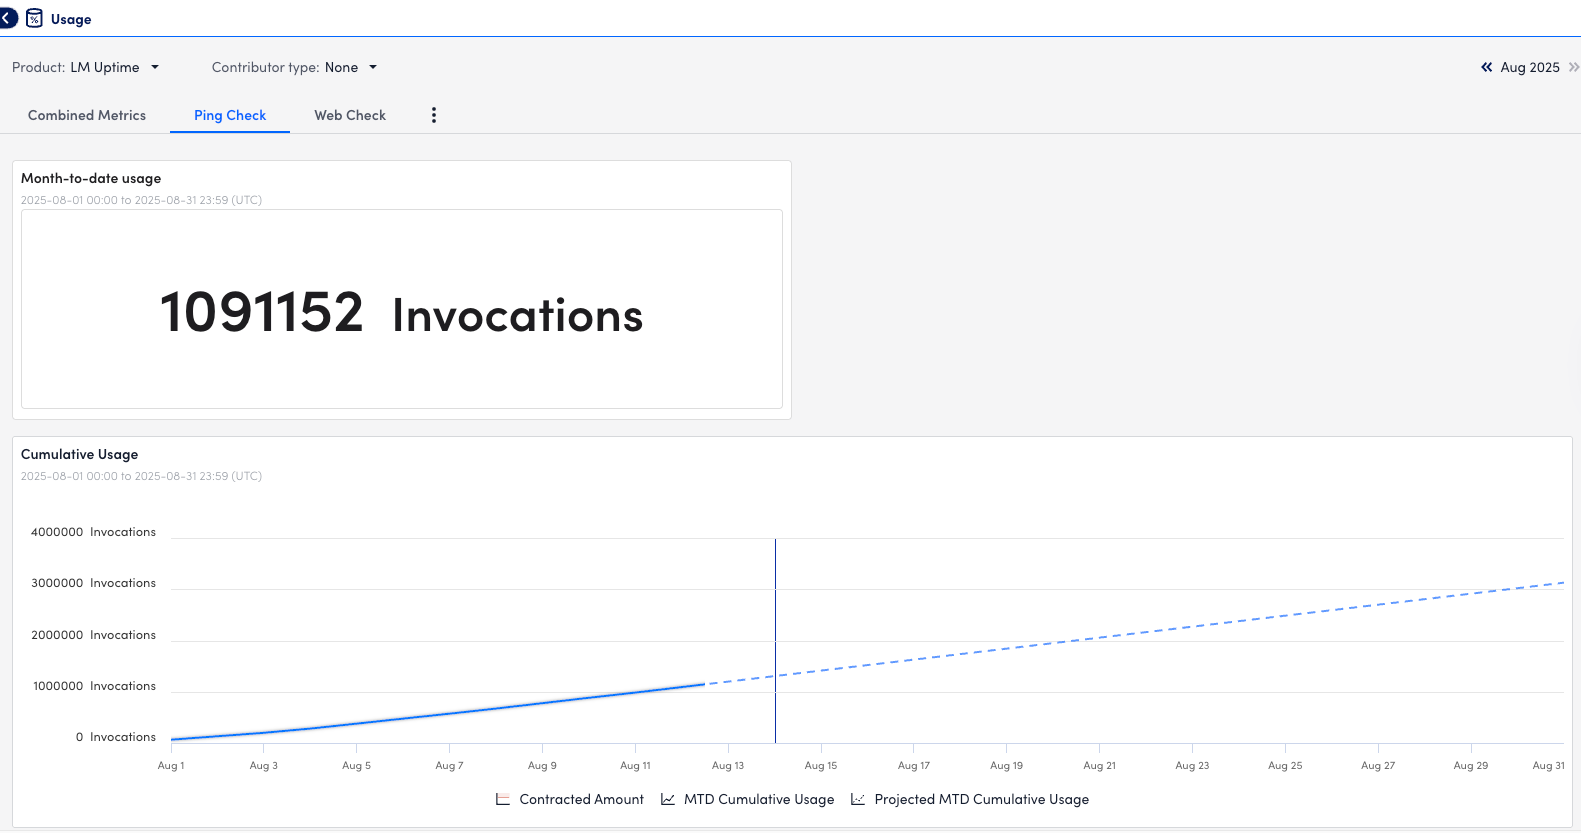
The total number of datapoints for ping checks is displayed, and the components update accordingly. - To view the metrics for Web Checks, select the Web Check tab.
The total number of datapoints for web checks is displayed, and the visual components update accordingly.
- To view the combined metrics for all LM Uptime resources, select the Combined Metrics tab.
- To view usage metrics for a specific date, hover over that date in the bar graph.


