
Using Conditional Count and Service Property
Last updated – 15 September, 2025
Using Conditional Count in Aggregate DataSources
The Conditional count functionality enhances service-level monitoring by enabling conditional aggregation within Aggregate Datapoints on the Modules page. This feature enables you to define a condition and count how many service members meet that condition without needing to modify or maintain custom DataSources.
Requirement for Using the Conditional Count
- To use conditional count functionality, you need the Dynamic Service Insights license.
- This functionality is only available within Aggregate DataSources used in service monitoring.
Recommendation: Use the system.si.member.datasources property when applying any DataSource that uses the Aggregate collection method.
Implementing Conditional Count Functionality
1. In LogicMonitor, navigate to Modules and open the appropriate LogicModule for your service.
2. Select the Aggregate datapoint you want to evaluate (for example, idleInterval).
3. In the Aggregation Method, select Conditional count.
4. In the aggregation rule, define the conditional expression (for example, <600).
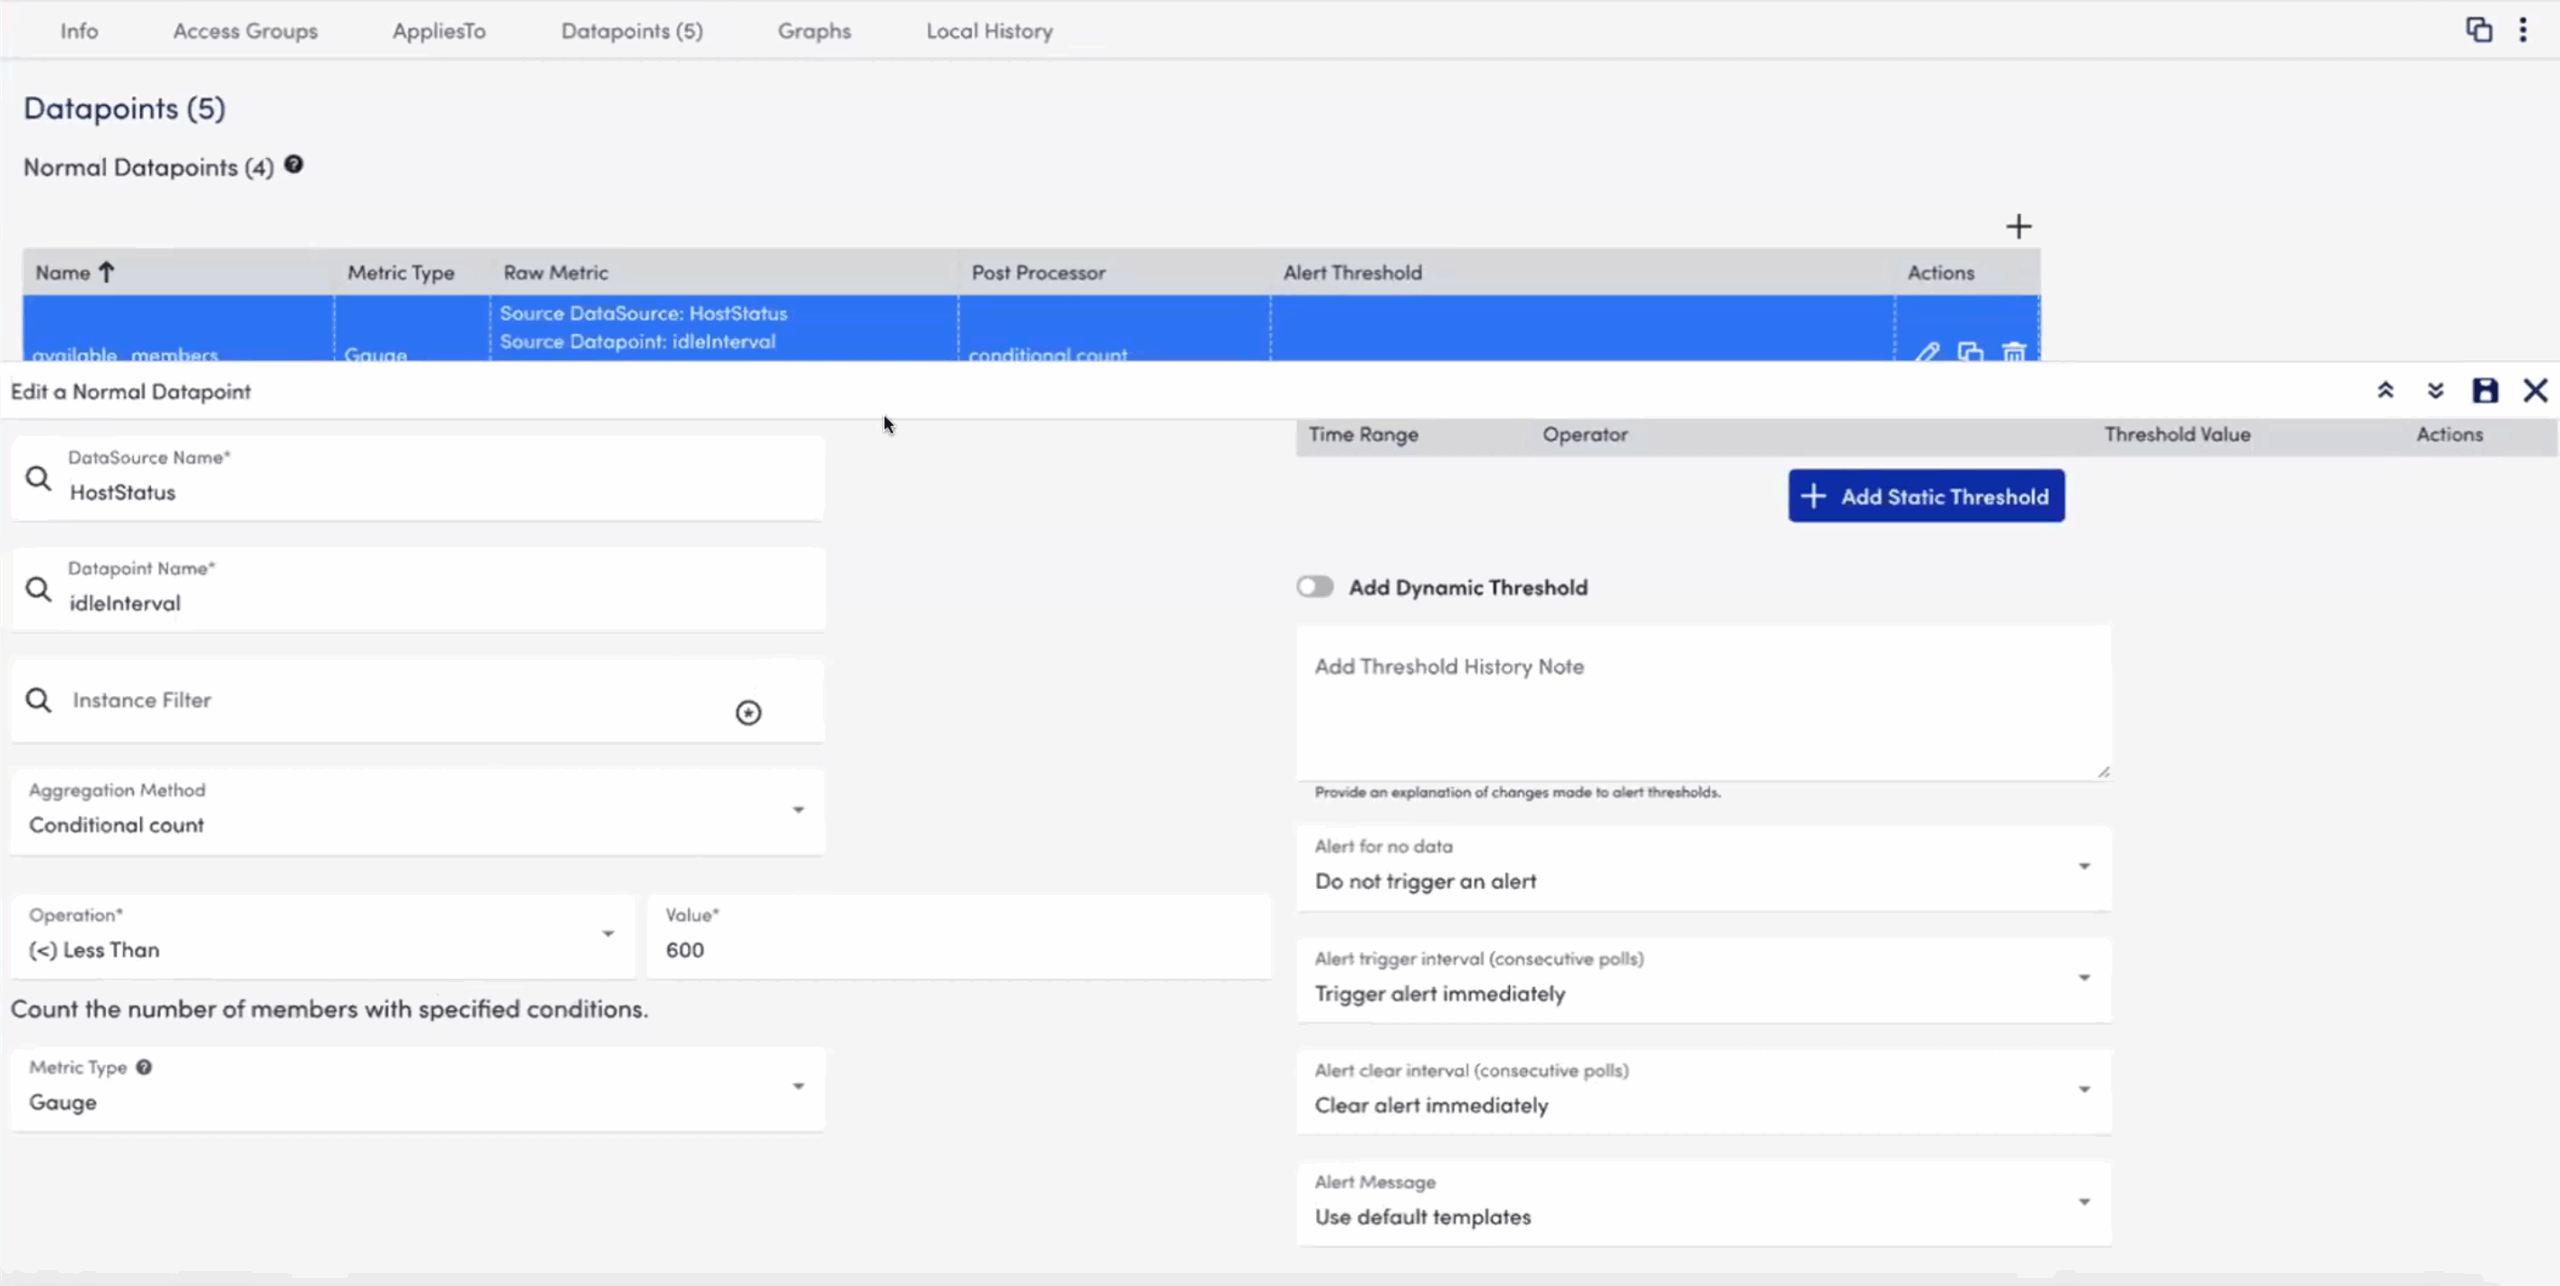
4. Add a descriptive name for the new datapoint appropriately (for example, countOfDownHosts).
5. Create an alert rule for the new datapoint (for example, trigger an alert when countOfDownHosts > 5).
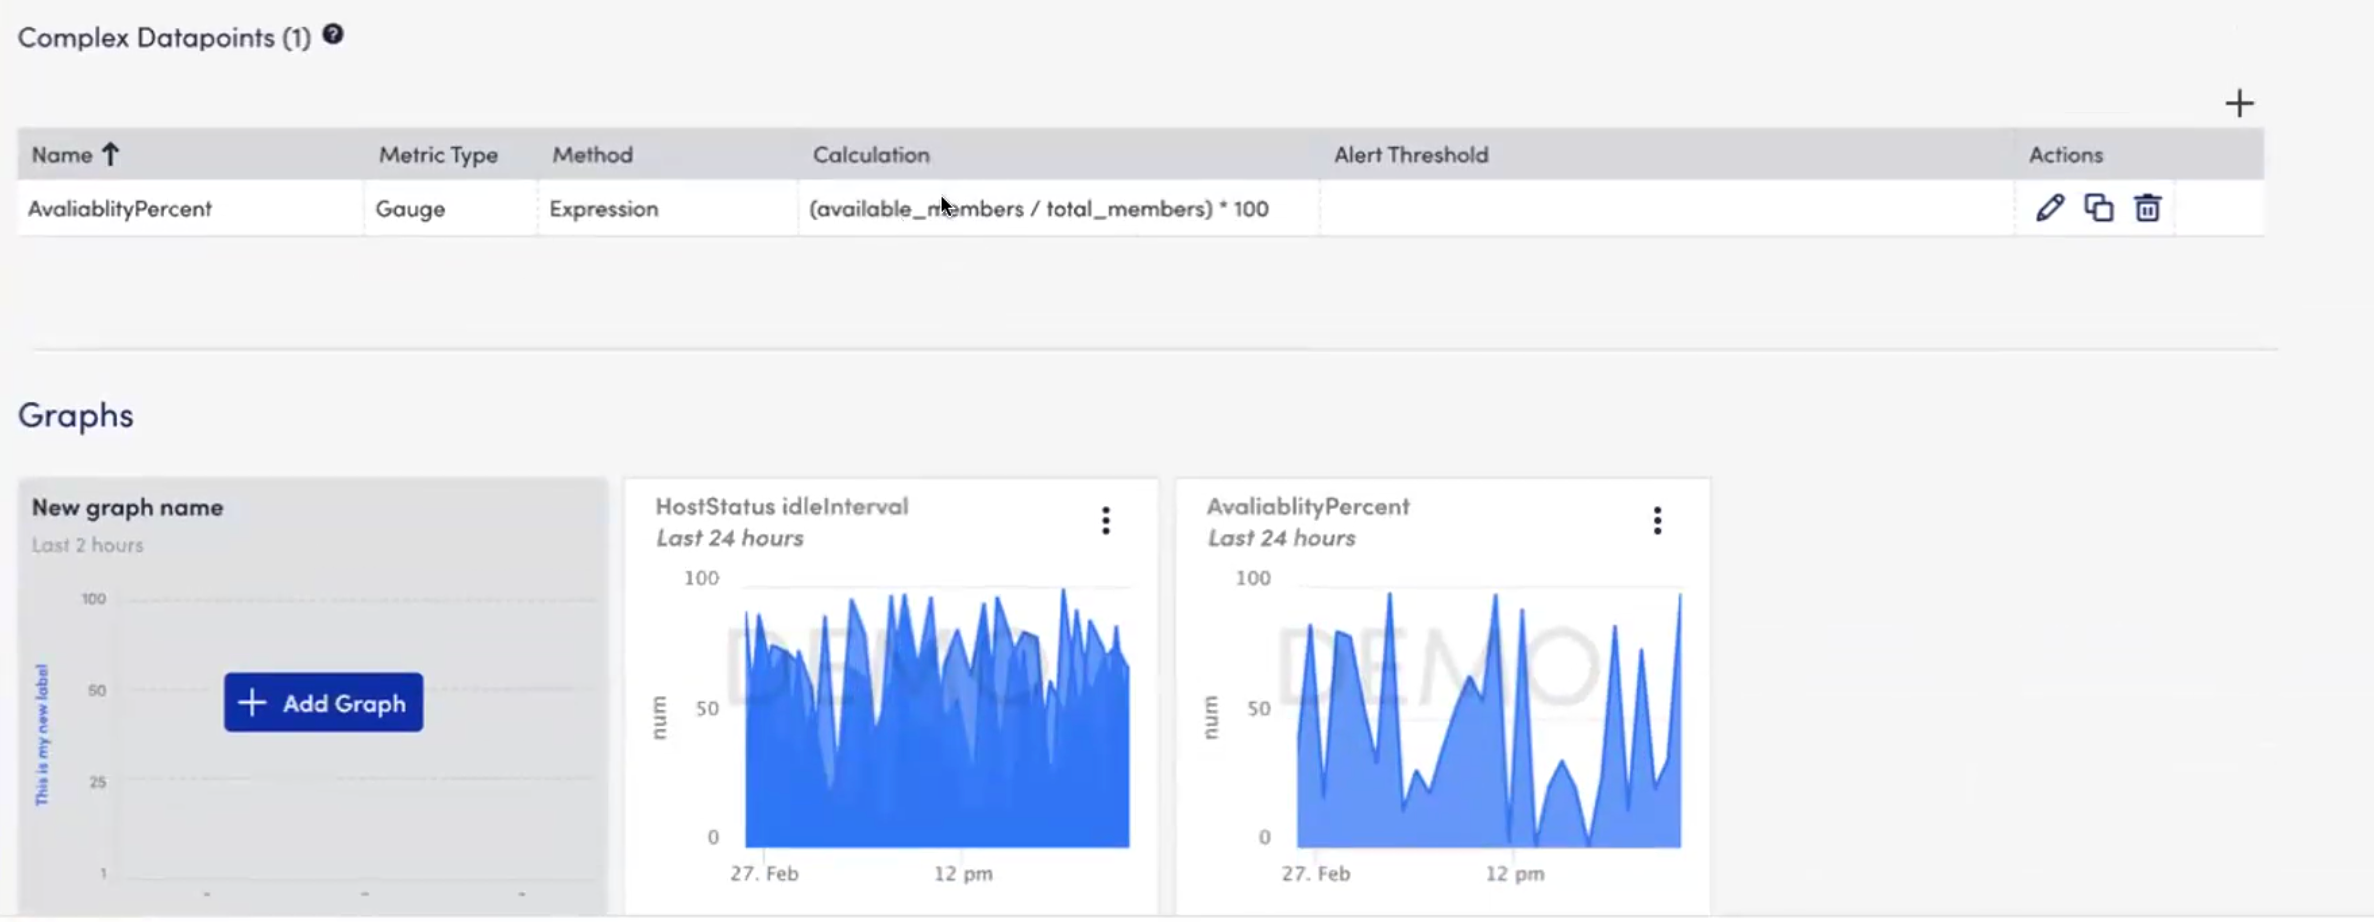
6. (Optional) Create a percentage-based alert as following:
- Count all service members using a simple count aggregation (for example,
total_members). - Add a Complex Datapoint (CDP) to divide
countIf / count(for example,AvailabiltyPercent = available_members / total_members * 100) - Use this result in an alert rule to trigger based on a percentage threshold (for example, alert if more than 50% are affected).
Using system.si.member.datasources to Target Aggregate DataSource
When configuring Aggregate DataSources for Services, LogicMonitor required you to define the AppliesTo field using the Service ID directly. For example: system.serviceId == "12345".
This approach treated each service as a unique entity even when many services used the same underlying DataSources and required manual configuration for each service.
To address this, LogicMonitor provides a new service-level property: system.si.member.datasources
This property lists the actual DataSources applied to the member devices of a service. Instead of targeting services by ID, you can now target them based on what data they actually collect.
Example:
Consider your IT environment includes the following services:
- Service A: Web servers, all using
CPU_UsageandMemory_UsageDataSources - Service B: Database servers using
CPU_Usage,Disk_IO, andNetwork_Usage - Service C: Internal tools with custom DataSources, no
CPU_Usage
You can dynamically apply the Aggregate DataSource using the actual DataSources applied to service members as follows:
contains(system.si.member.datasources, "CPU_Usage")
This expression applies the Aggregate DataSource to Service A and Service B, but excludes Service C, because Service C’s members do not include the CPU_Usage DataSource.
Benefits of using system.si.member.datasources
- Targets relevant services: Ensures that aggregation logic only runs where the required datapoints exist.
- Supports reusable logic: Makes the module applicable across services that use the same DataSources.
