
Log Query Report
Last updated – 21 July, 2026
Log Query Reports in LogicMonitor provide a way to consistently retrieve, export, and share log data by running a defined log query over a specified scope and time range. You can use interactive log searches as repeatable reports that can be generated on demand or on a schedule.
When you configure a Log Query report, you define which log events are included using Log Query Language (LQL). You can specify filtering conditions, field-based matching, and optional aggregation logic to precisely select relevant log data. You can customize the report by selecting the report sections to include, choosing from multiple visualization types, and adding custom metadata columns to provide additional context. In addition, you can control how the results display by choosing the raw log events, aggregated results, or both in the same report.
For more information about Log Query Language (LQL), see Query Language Overview.
Configuring a Log Query Report
- In LogicMonitor, navigate to Reports > Add Report > select Add Logs Query Report.
- In the Name field, enter a name for the report.
Report names cannot include the operators and comparison functions used in LogicMonitor’s datapoint expression syntax. - (Optional) In the Description field, enter description for context of the report.
- From Report Group, select the report group where your report is stored.
- From Format, select the type of format for the output of the report. You can export Logs Query Reports in CSV, HTML, or PDF format.
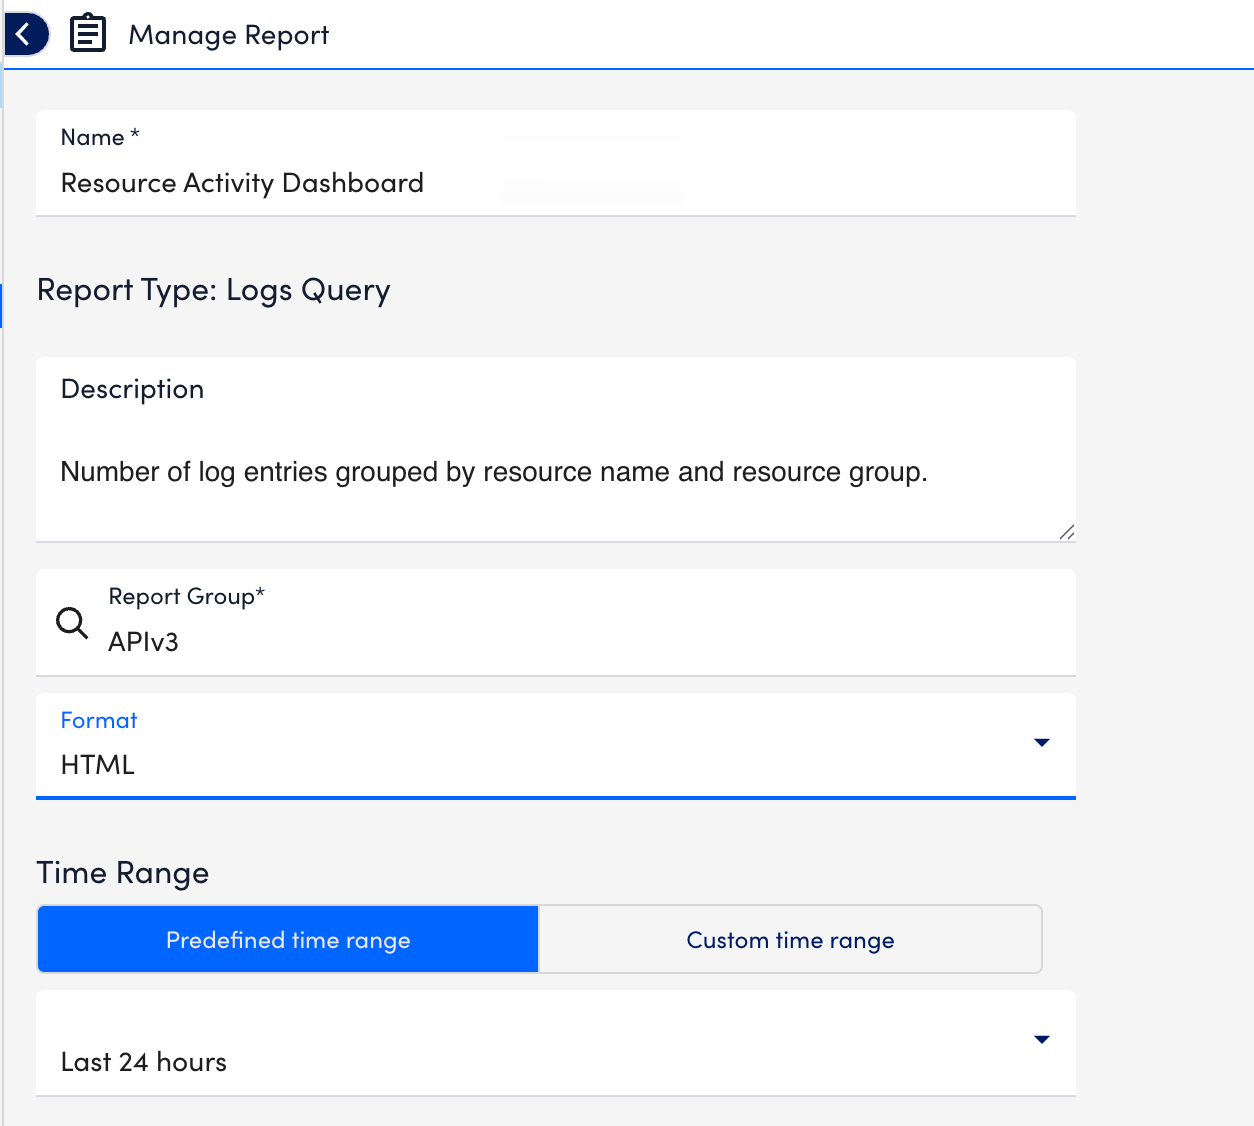
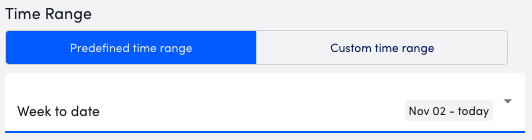
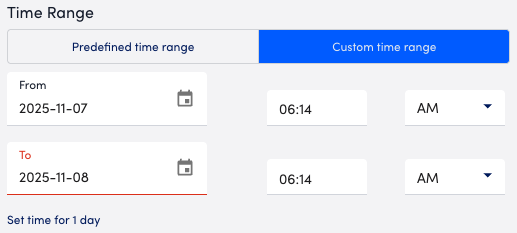
- In the Time Range section, configure the time range you want to base the report on by doing one of the following:
- To configure a predefined time range, select Predefined time range, and then select one of the time range options.
- To configure a custom time range, select Custom time range, and then configure the date and time.
- To configure a predefined time range, select Predefined time range, and then select one of the time range options.
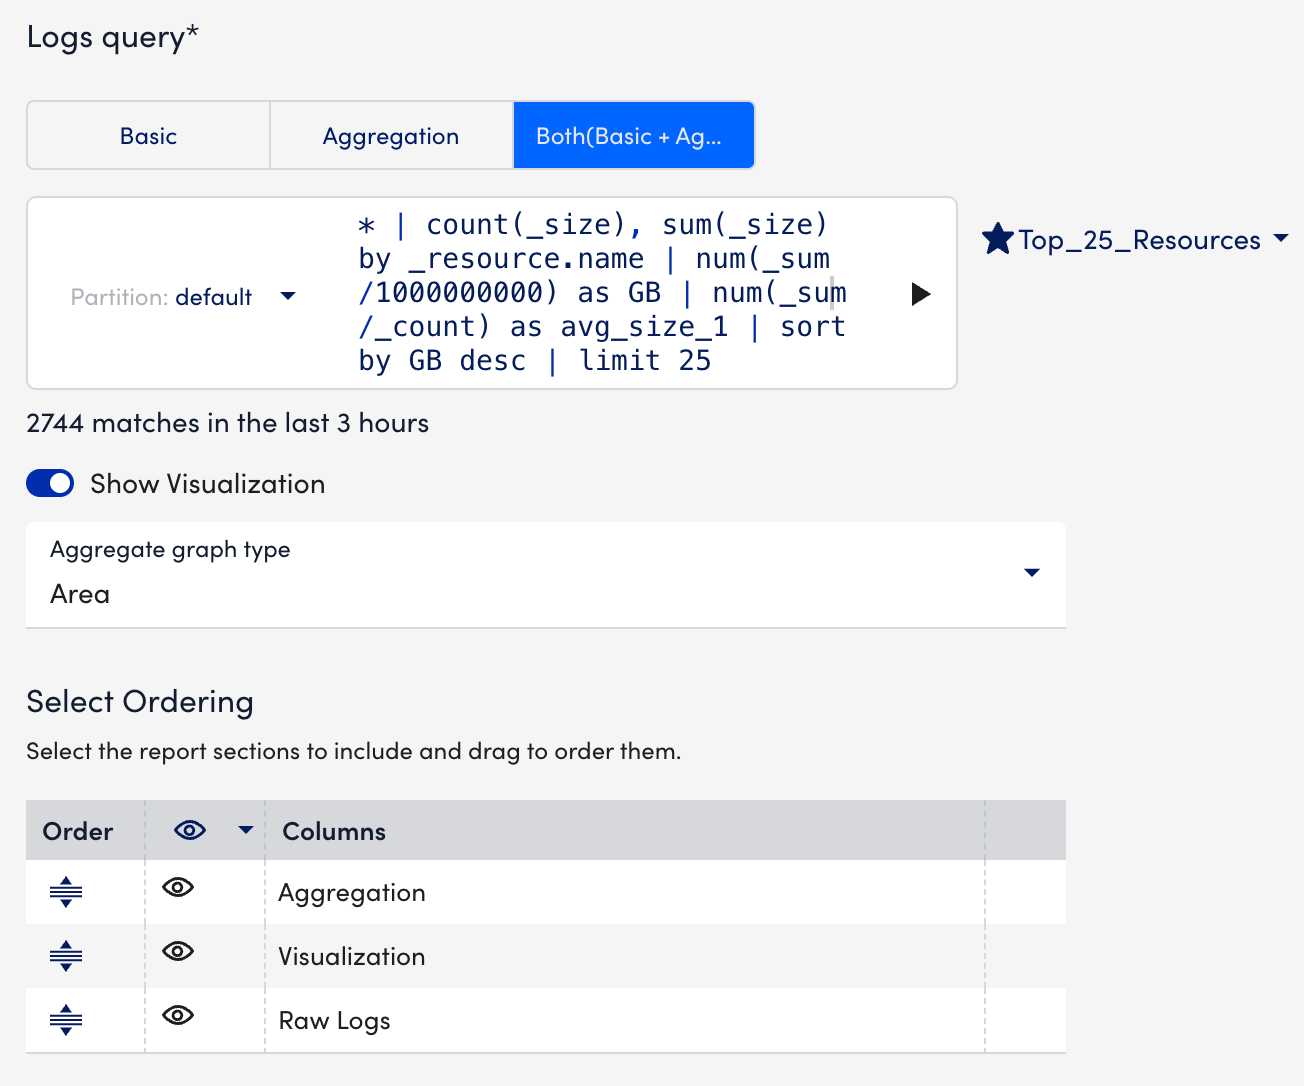
- In the Logs query section, select how you want the results of the query displayed in the report, by selecting one of the following:
- Basic—displays the individual log messages.
This option is useful for auditing and troubleshooting log messages. - Aggregation—include only the aggregate results.
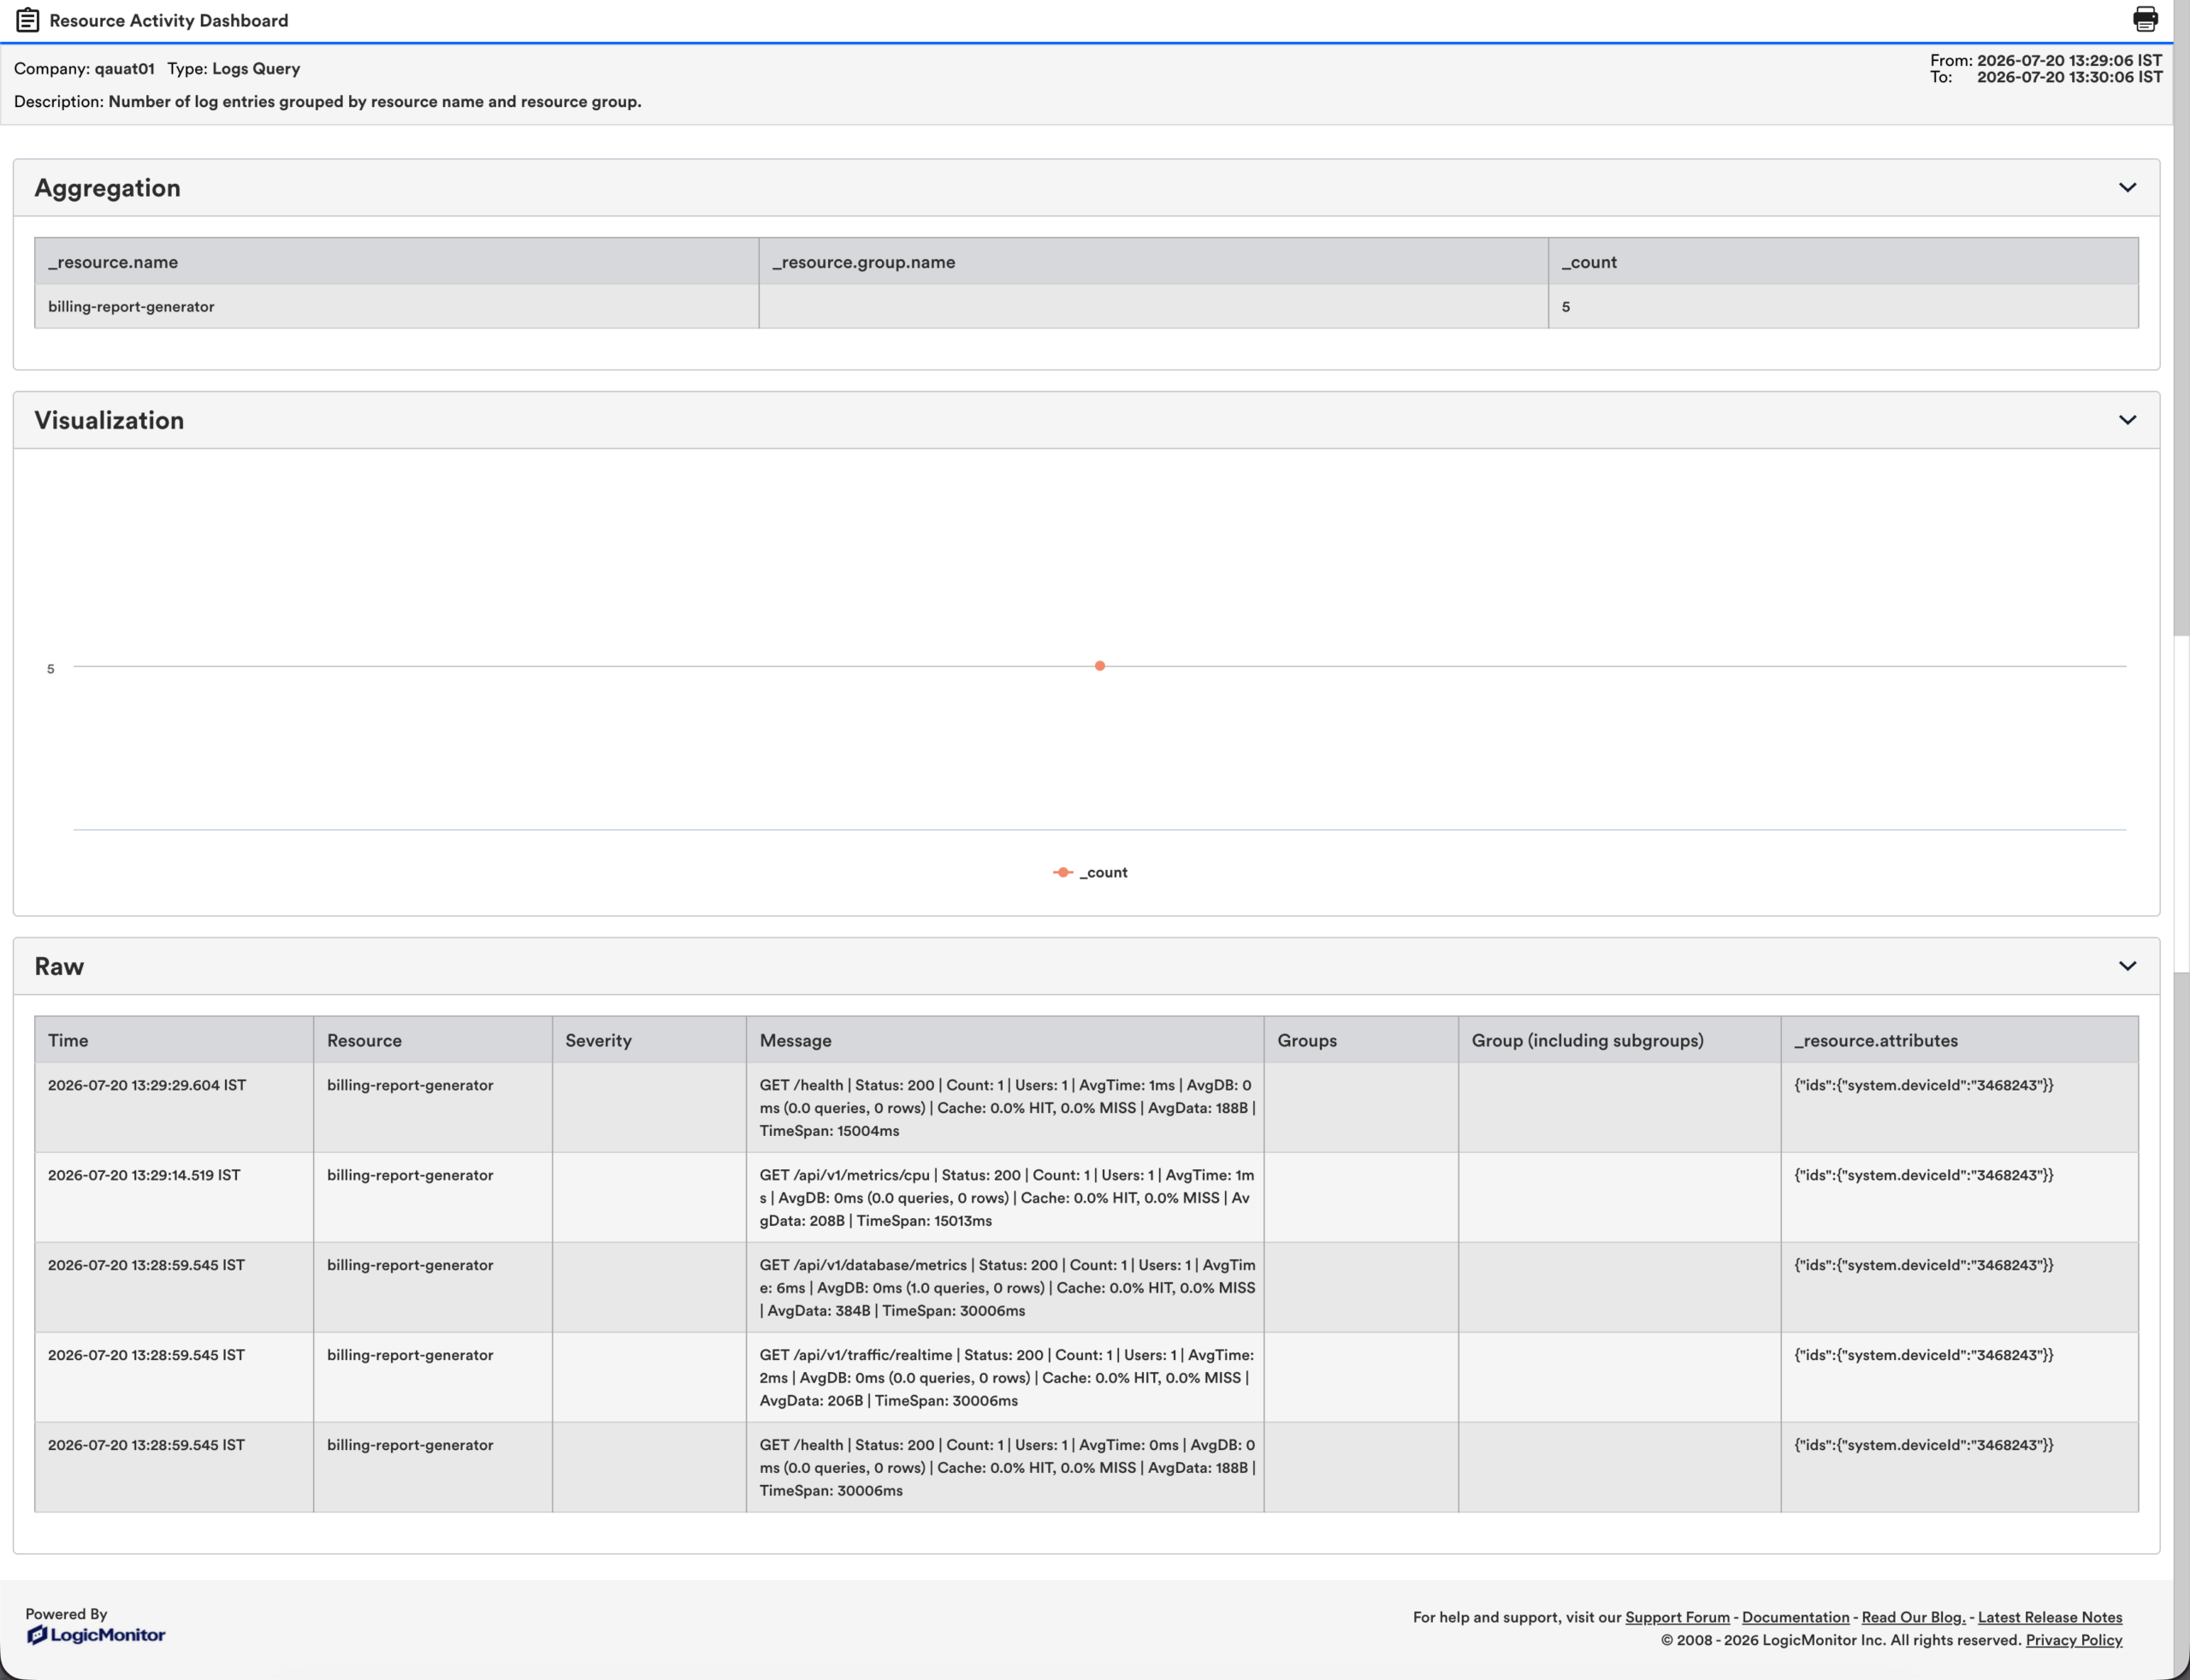
This option is useful for trend analysis and high-level reporting. - Both (Basic + Aggregation)—include a combination of individual log messages and the aggregate results.
This displays as raw events and aggregated summaries together so you can correlate detailed entries with summarized metrics.
- Basic—displays the individual log messages.
- Configure the query for the log events you want included in the report by doing one of the following:
- To manually enter the logs query using the Logs Query Language (LQL), enter the query in the Partition field, and then select
 Run query.
Note: To retrieve all logs for the selected time range, enter an asterisk (*) as the query.
Run query.
Note: To retrieve all logs for the selected time range, enter an asterisk (*) as the query. - To use a saved view, select Saved views, and then select a query.
Note: The saved views are displayed based on the queries created on the Logs page. The query automatically runs, and you can view the preview of the query in the Logs query test results panel.
- To manually enter the logs query using the Logs Query Language (LQL), enter the query in the Partition field, and then select
- After the query runs, toggle the Show Visualization switch to include a chart in the report.
The following visualization types are available:- Area
- Line
- Pie
- Column
Note: The Show Visualization option is available only for PDF and HTML report formats.
- Use Select Ordering to rearrange report sections by dragging and dropping them into the desired order. The selected order is preserved in the generated report.
- You can also hide columns that you do not want to display.
- Use the Columns settings to configure the columns you want displayed in the report.
You can configure the order the columns display in and whether or not to hide certain columns.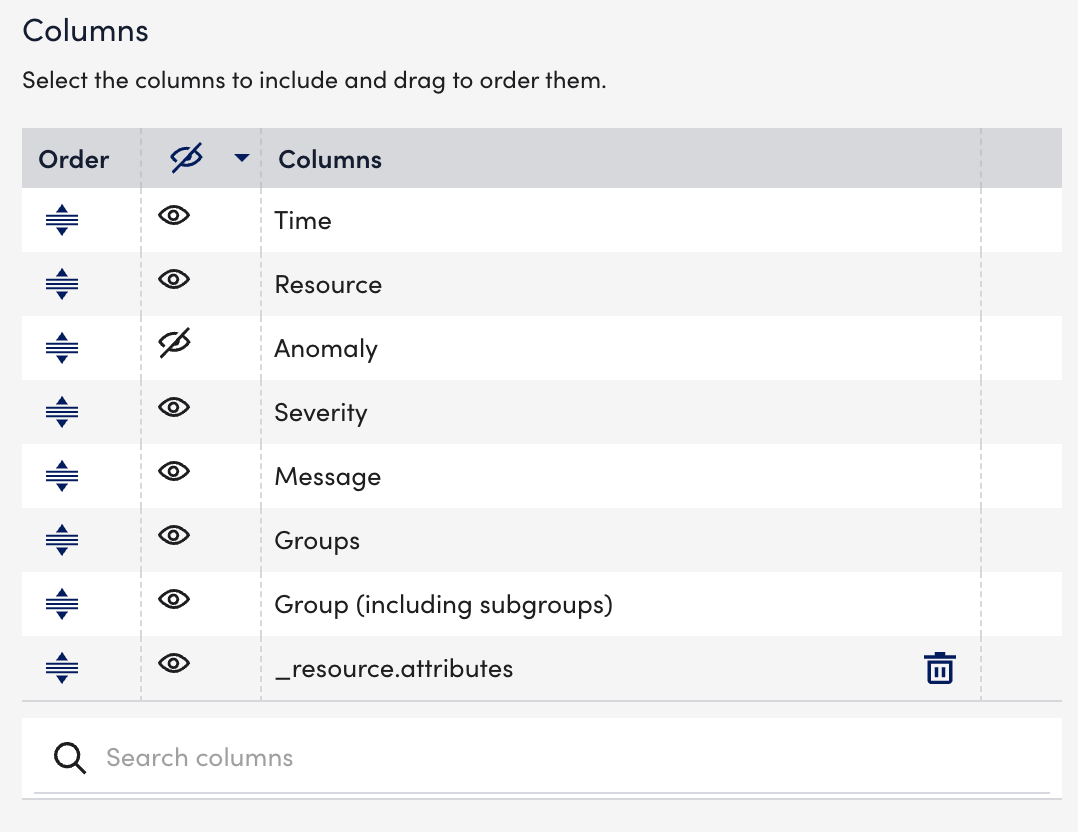
- From the Time Zone dropdown, select the time zone for your report.
- In the Report Schedule section, do the following to configure the report to generate on a schedule:
- Toggle the Generate this report on a schedule switch.
- From the Frequency dropdown menu, select how frequent you want the report to generate, and then configure when you want the report to generate.
Each frequency option provides you a setting for selecting the time zone. - In Recipients Email, enter the name of the user you want to receive the generated report.
The recipients you add to the report are emailed a generated report based on the format you configured and the email associated with the username.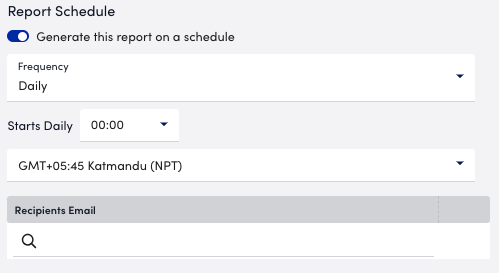
- Do one of the following to save the report:
- Select Save.
The report saves to the Report Group you selected.
If you configured the report to generate on a schedule, the report generates and sends to recipients based on the frequency you configured. - Select Save and Run.
The report saves to the Report Group you selected and generates a report based on the format you configured.
If you configured the report to generate on a schedule, the report generates and sends to recipients based on the frequency you configured.
- Select Save.
Note: The maximum limit for generating the Log Query report is 50. You must wait for 24 hours to generate the next report or contact your system administrator.
The Log Query report is generated in the configured format.
Threshold Limits
Adhoc Requests Thresholds (Limit for number of items) = 10,000 records
Scheduled Requests Thresholds = 50,000 records
