Active Discovery for AWS CloudWatch Metrics
Last updated on 08 May, 2024You can automatically track your Amazon Web Services (AWS) CloudWatch custom metrics in LogicMonitor Cloud by enabling Active Discovery in a DataSource. Active Discovery regularly checks for changes in your monitored environment and updates the relevant resource properties. For more information, see “What is Active Discovery?“
Getting Metrics from AWS CloudWatch
To retrieve the AWS CloudWatch custom metrics, the LM Cloud DataSource needs to call AWS CloudWatch ListMetrics with the following request parameters:
| Parameter | Description |
| namespace | The name space to filter against. |
| metric name | The name of the metric to filter against. |
| dimensions | The list of dimensions to filter against. Each dimension contains a name and value. |
The results returned by ListMetrics are not filterable by time and their content depends on the metrics available based on AWS CloudWatch’s retention for metric data:
| Frequency | Retention Period |
| Data points with a period of less than 60 seconds (high-resolution custom metrics) | 3 hours |
| Data points with a period of 60 seconds (1 minute) | 15 days |
| Data points with a period of 300 seconds (5 minutes) | 63 days |
| Data points with a period of 3600 seconds (1 hour) | 455 days (15 months) |
CloudWatch Metric Timestamps Delay
When receiving metrics from AWS CloudWatch you will observe a discrepancy in the timestamps for when the metric happens, when it is published to AWS CloudWatch, and when it is ingested by LogicMonitor. This delay is illustrated in the following chart:
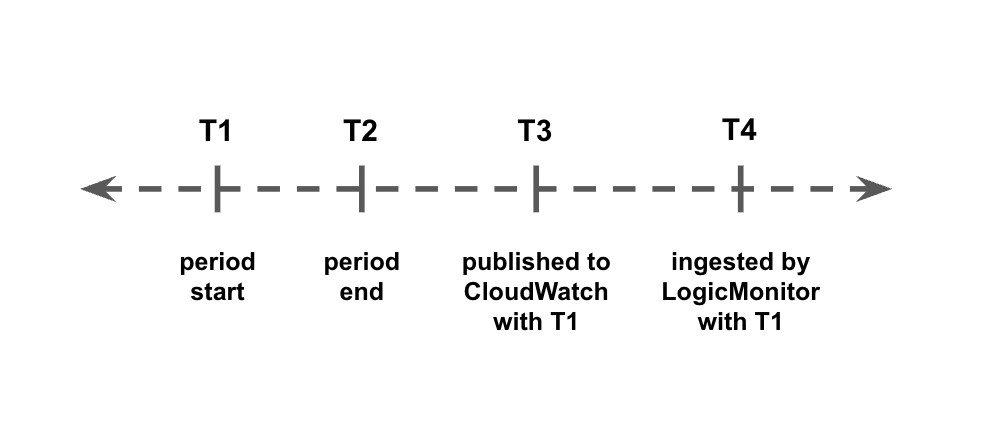
- The time period between T2 and T3 is a delay (typically between 2 and 3 minutes) between when the metric occurs and when it is published to AWS CloudWatch. You cannot control this delay.
- The time period between T3 and T4 is between 0 sec and the DataSource polling interval. You can control this time length by adjusting the polling interval.
Enabling Active Discovery
To enable Active Discovery, complete the following steps:
1. Navigate to Settings > LogicModules > DataSources.
2. From the Add drop-down list, select “DataSource”.
3. Enter the details in the Name, Displayed as, and Applies to fields.
4. In the Collector field, select the “AWS CLOUDWATCH” option.
5. Enable Multi-instance and Enable Active Discovery options.
6. Under the Active Discovery options, in the Discovery Method field, select “AWS CLOUDWATCH”.
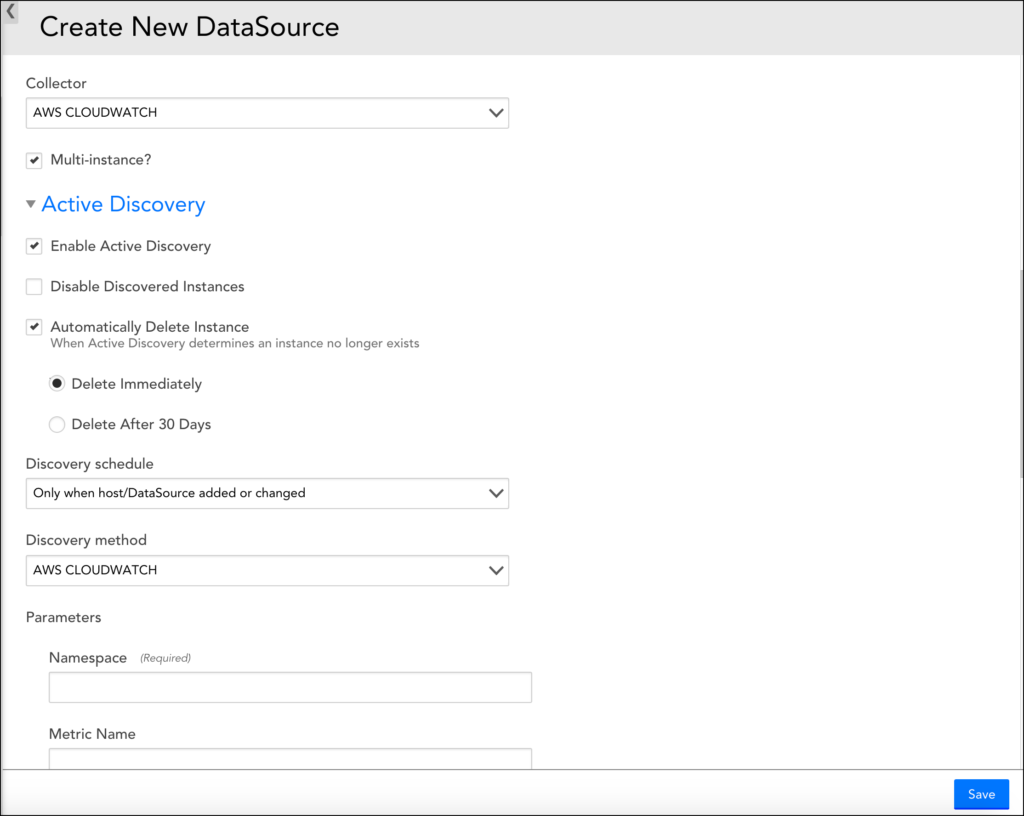
7. Set the following parameters:
| Parameter | Description |
| Namespace | (Required) The namespace to filter the metrics. |
| Metric Name | (Optional, available since version 136) The name of the metric to filter against. Use this to monitor a single specific metric. |
| Device Dimension Name | (Required) The Cluster or Domain Dimension Name to filter the metrics against the device. The value is read from the AWS Properties and is case sensitive. You will need to specify which LogicMonitor property matches this in Device Dimension Value. Example: DomainName. |
| Device Dimension Value | A wildcard value from the instance’s LogicMonitor properties. Example: ##system.aws.DomainName## |
| Instance Dimension | (Required) The name of the dimension used to discover the nodes/instances. For example, “NodeId” adds the AWS NodeId in the metric path. |
| Metrics Period | (Optional) Specifies how often the metrics we are trying to pull are published. If blank, it shows all metric periods. |
The following is an example of a metric path:
AWS/ES>DomainName:##system.aws.DomainName##>NodeId:##WILDVALUE##>CPUUtilization>Maximum
When instances are found, the path translates to:
AWS/ES>DomainName:testdomain>NodeId:TeSt1234>CPUUtilization>Maximum