
Viewing Traces Data
Last updated - 04 April, 2023
While you can view the trace data in different widgets, select View Data to view the details for the selected namespace along with the time period.
Important: You can view span data by selecting Spans from the drop-down list above the graph. The span data options are similar to the traces data.
The Traces page displays the trace data using the following visual components:
- Traces Graph—Displays trace data allowing you to visualize the performance of the traces.
- Traces Table—Lists the spans from your trace data, sorted by time.
You can use filters to narrow your trace data. When you apply the filter to the trace data, the Traces Graph and Traces Table update based on the options selected in the filters. From the Traces Table, you can access the end-to-end trace detail screen.
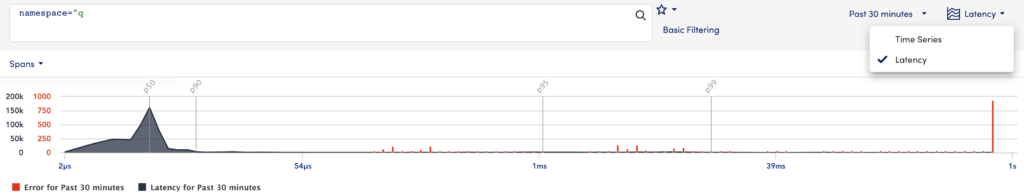
Traces Graph
The Traces Graph allows you to visualize how your traces are performing over time using the following:
- Latency—The Traces Graph displays the operations plotted by latency.
- Time Series—The Traces Graph displays spans and errors ingested over time.
You can select “Latency” or “Time Series” to view the trace data in the Traces Graph for the operation you select.
You can narrow the data in the graph by clicking and dragging your cursor over the desired data. The graph zooms in on the selected data.
Comparing Spans Data on Latency Graph
You can visually compare a single span’s data for two different time ranges on the latency graph. To display these details on the latency graph follow the steps:
- Select
 to open the Compare Spans modal.
 - On the Time tab, select your required time period from the Second Time Period drop-down.
- (Optional) On the Tags tab, specify any tags as required.
- Select Go.
Two overlay graphs display for the specified time ranges.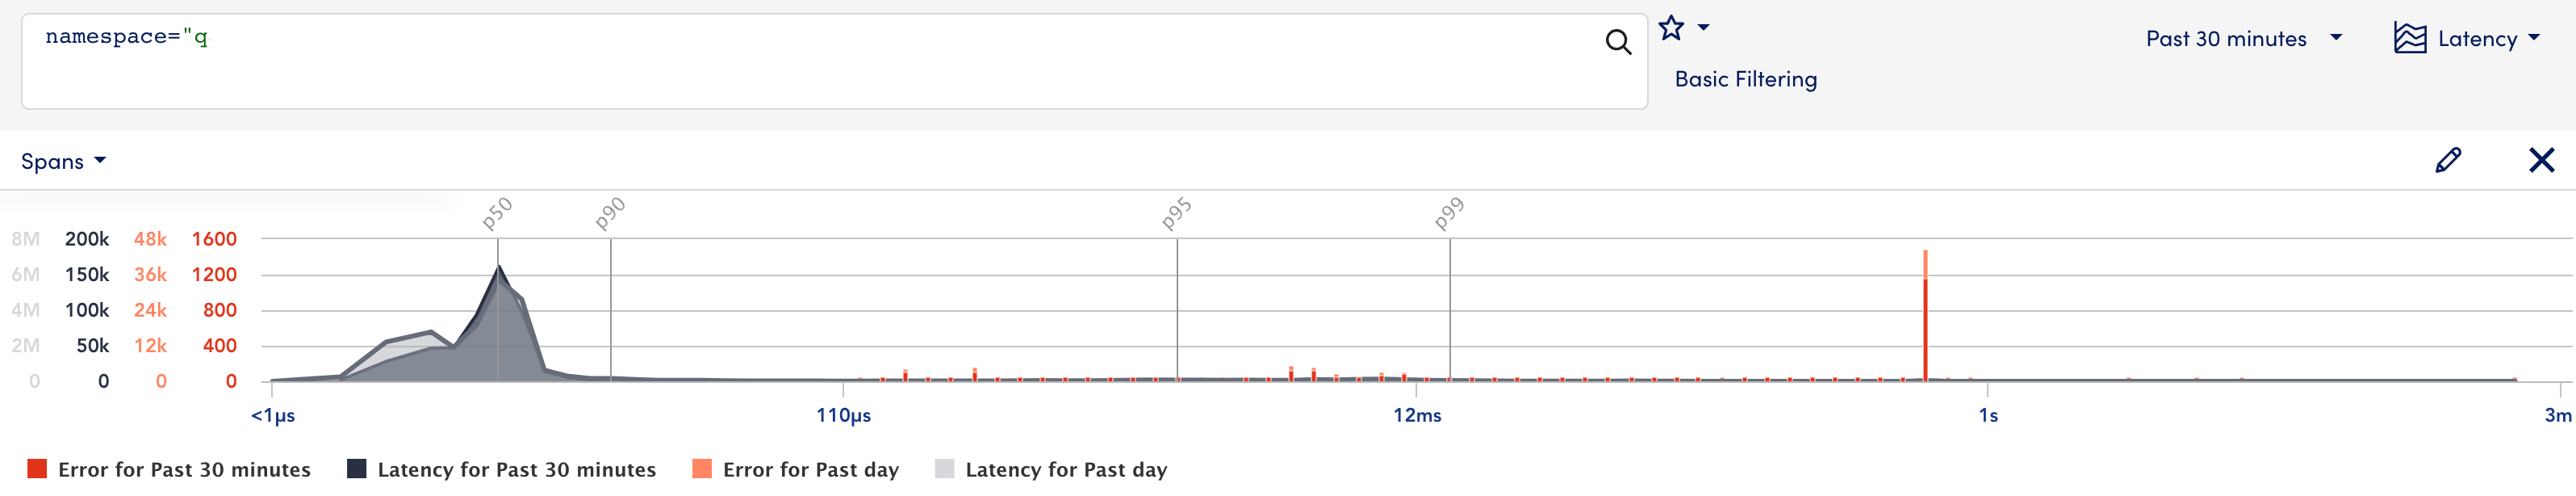
In addition, you can perform the following:
 —edits the compare spans details.
 —closes the overlay compare spans graph.
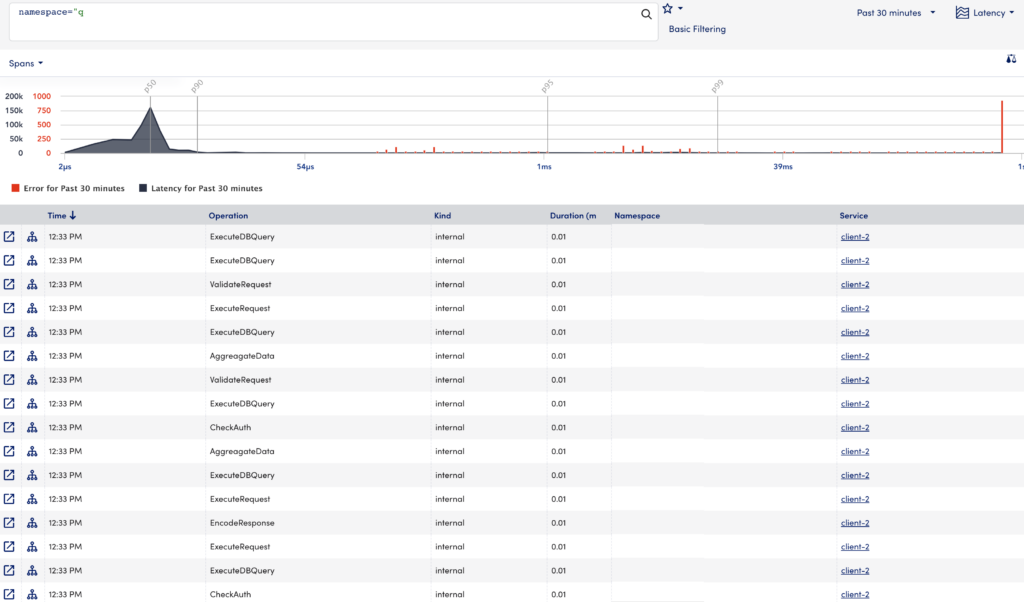
Traces Table
The Traces Table displays the specific operations within a trace using the following details:
| Field | Description |
| Time | The time that the operation occurred. You can sort the table in ascending or descending time order. |
| Operation | The name of the operation, which is set during instrumentation. |
| Kind | The kind or type of operation (internal, client, servers). |
| Duration (ms) | The duration of the operation in milliseconds. You can sort the table in ascending or descending time order. |
| Namespace | The namespace (application) to which the trace belongs. |
| Service | The service where the operation originated. If there are errors associated with the service, you will see an icon to indicate the severity. |
| Resource | The resource associated with the operation. If there are errors associated with the resource, you will see an icon to indicate the severity. |
In addition to the specific operations of a trace, the traces table also provides the following features:
 —opens the end-to-end trace view for the selected operation, along with other operations in the trace in a new tab.
 —opens a topology map that describes conceptual information about the application. For more information, see Application Topology Overview.
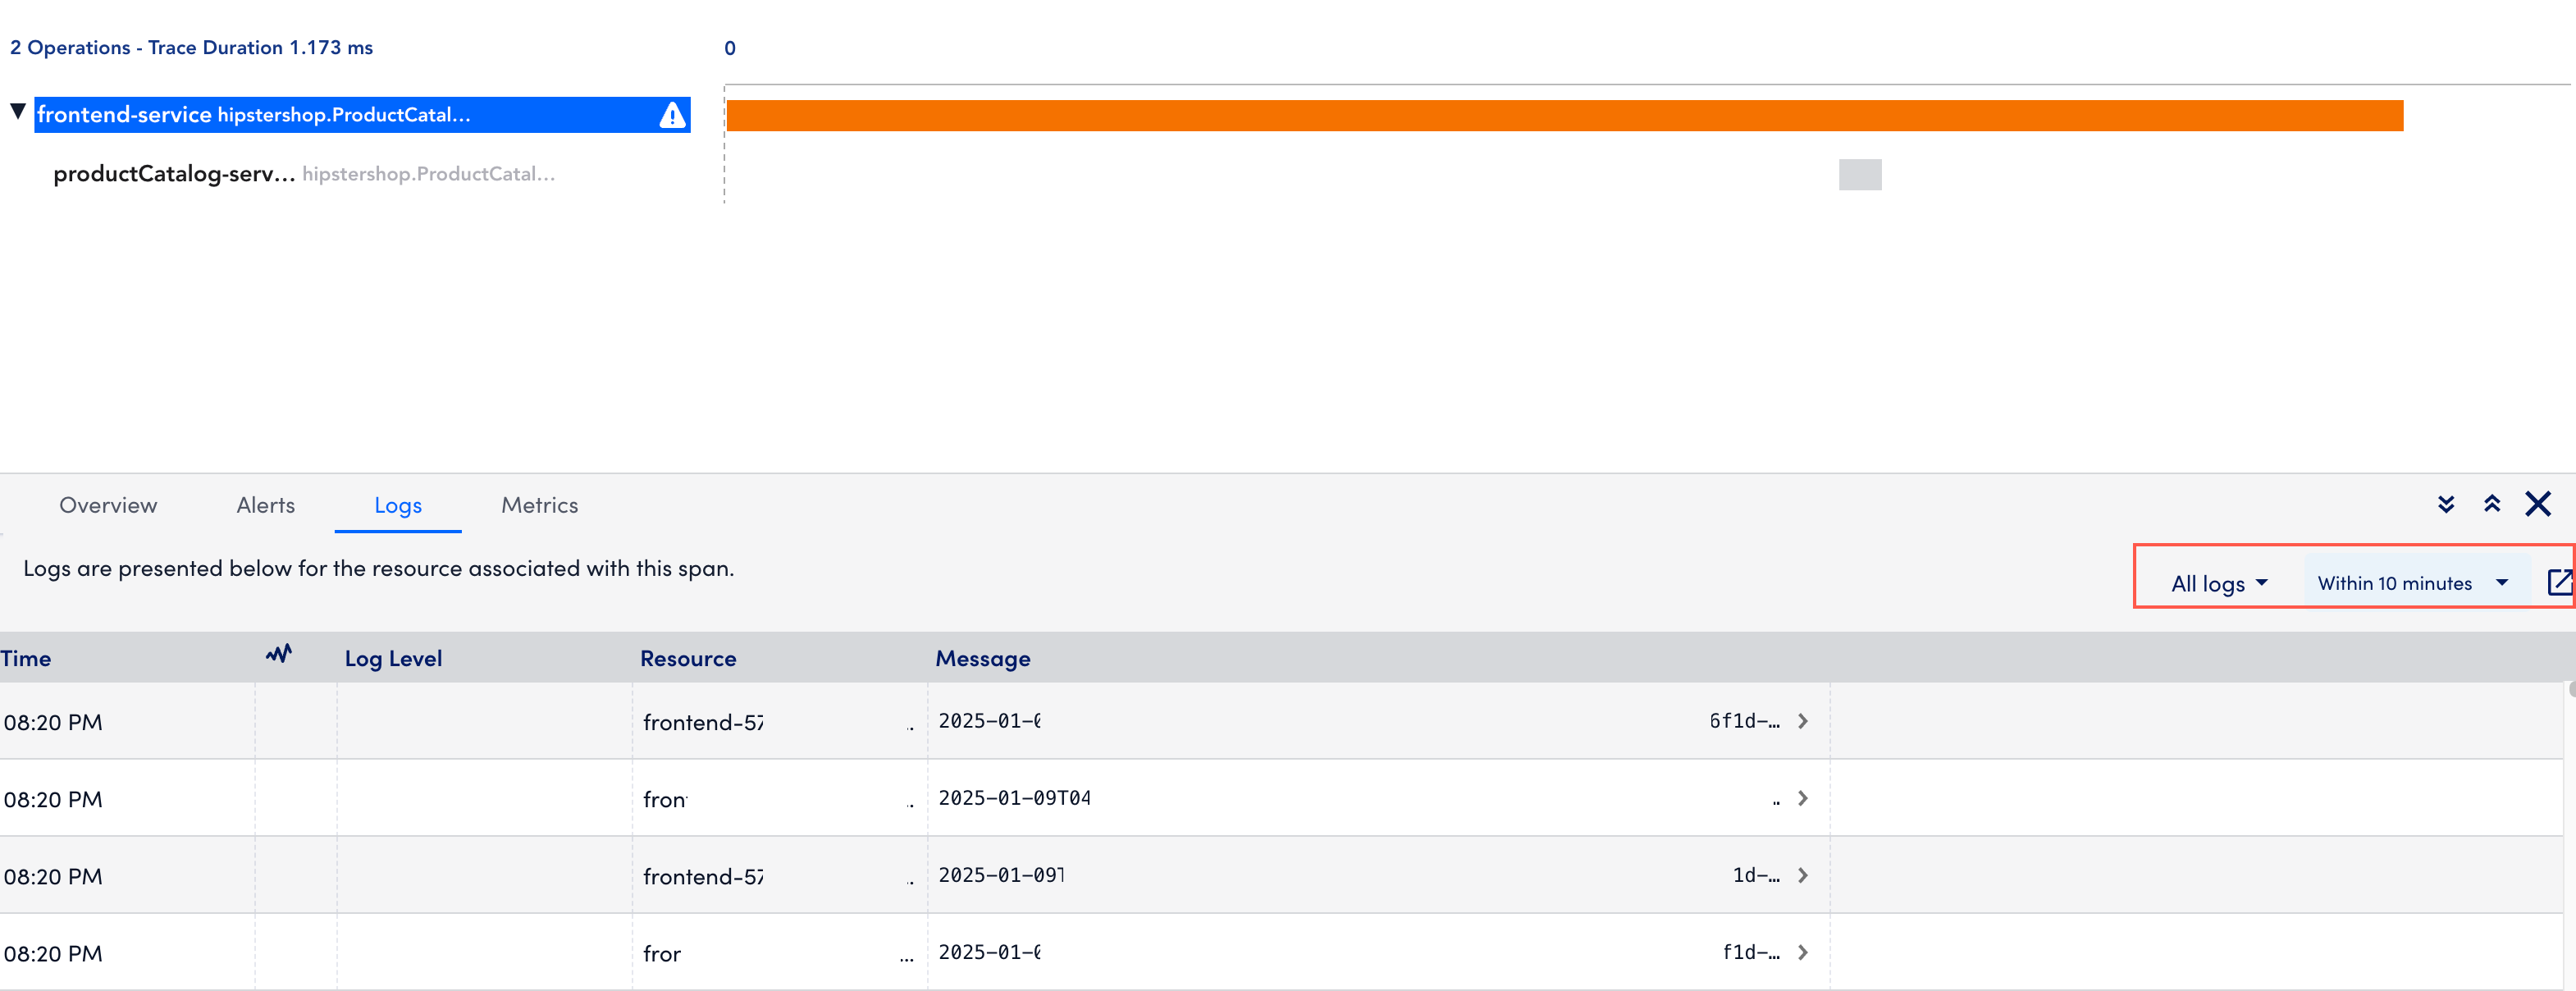
End-to-End Trace View
Selecting a specific operation displays the end-to-end trace that operation participates in along with other operations in the trace. The end-to-end view focuses on the operation you select, but you will also see the operations before and after it in the timeline.
For each operation, this view displays the Service name and Operation name followed by the duration and error status of the operation. The length of the bar indicates its duration, while the color of the bar indicates the error status of the operation.
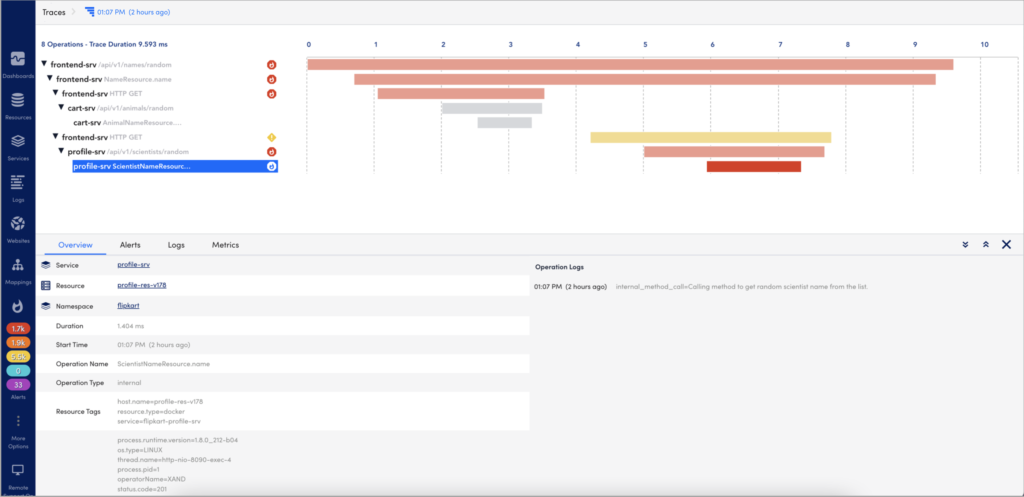
Selecting an operation opens the detail panel for that operation. This detail panel shows the following:
- Overview— Displays basic metadata for the operation (such as tags and logs), the resource the operation is associated with, and the service where the operation started.
- Alerts— Displays a list of any active alerts for the resource that the operation is associated with.
- Logs— Displays operation logs (such as application logs) sent via manual instrumentation, and resources logs (such as infrastructure and application logs) sent from LM Logs. For more information, see LM Logs for more information. In addition, you can filter logs based on the trace ID and also for a specific time range. You can also open the Logs page.
- Metrics— Displays the metrics (Duration, OperationCount, ErrorOperationCount) of the operations associated to the service namely in a graph. The metrics displays for a time range (+/- 15 minutes) of the ingested span. You can zoom in on each graph.
You can use this contextual information to troubleshoot issues identified by the traces (using duration or error status).
