
Using Ops Notes
Last updated – 17 March, 2026
Ops Notes allow you to add time stamped annotations to your graphs. You can correlate events (manual device changes, upgrades, or releases) with performance changes in your environment. This helps with troubleshooting and also provides a historical log of an event’s impact on your environment’s performance.
Note: To add Ops Notes you must be an administrator with rights to manage all devices.
Adding Ops Notes
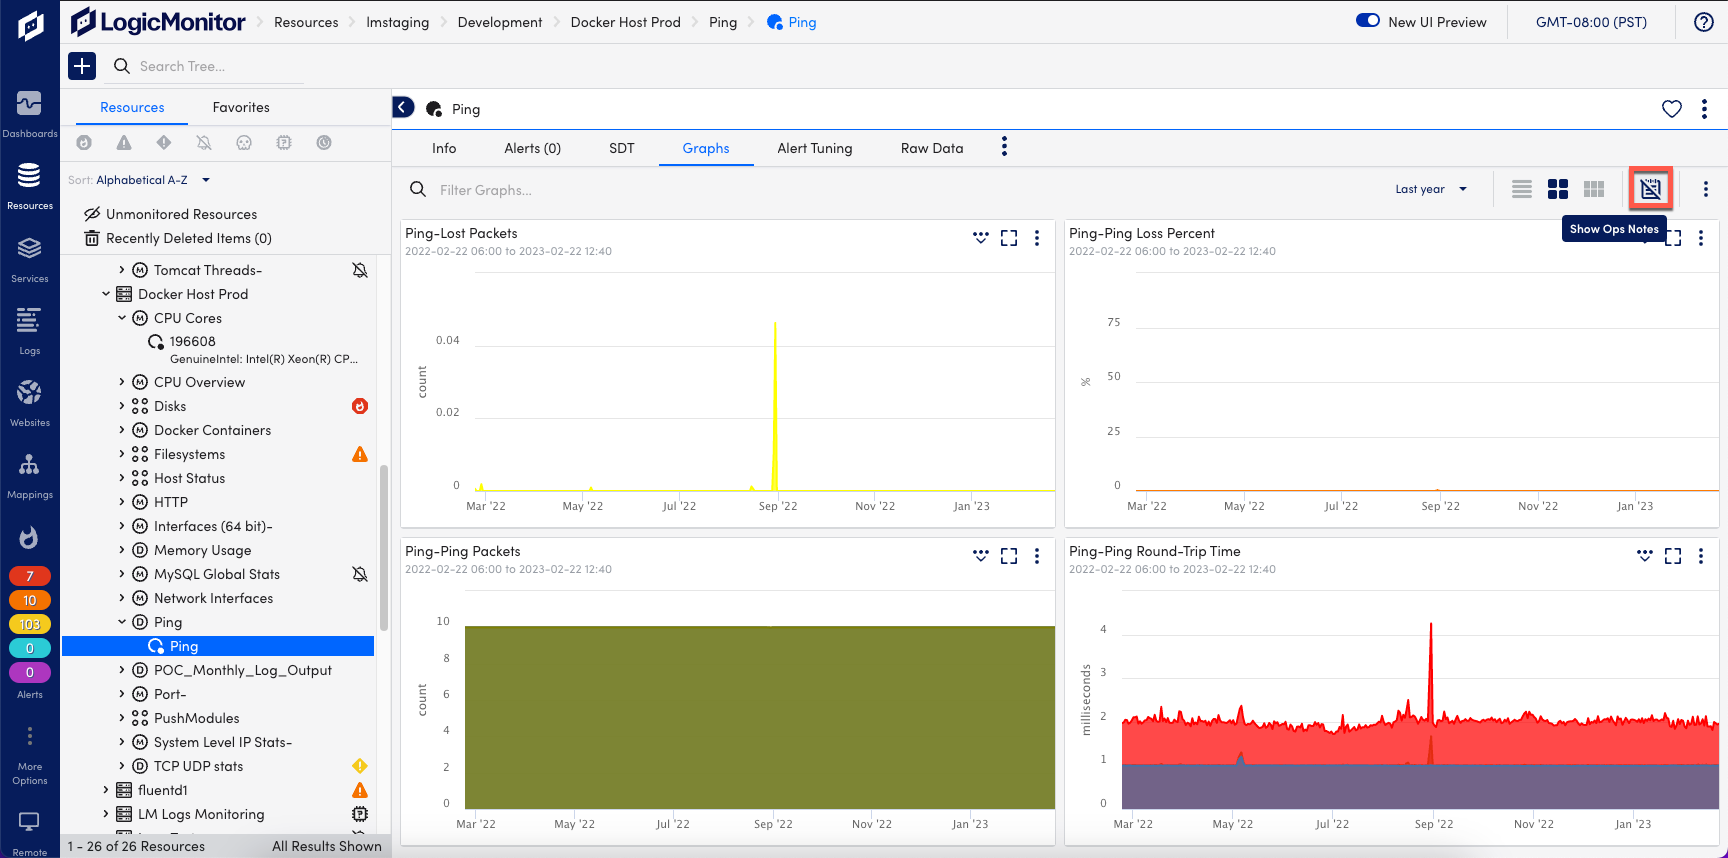
- From the Resources page, navigate to the Graphs tab for a DataSource or Instance.
- Select Show Ops Notes.
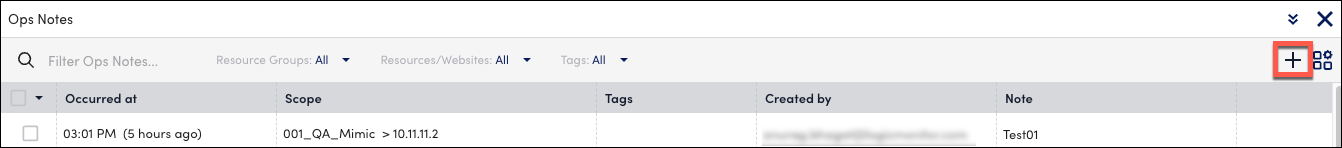
- From the Ops Notes panel, click Add New .
- On the Add Ops Note dialog, enter a Note in the text box provided. This is the content that will be displayed in your Ops Notes. Include all relevant information necessary to contextualize the event.
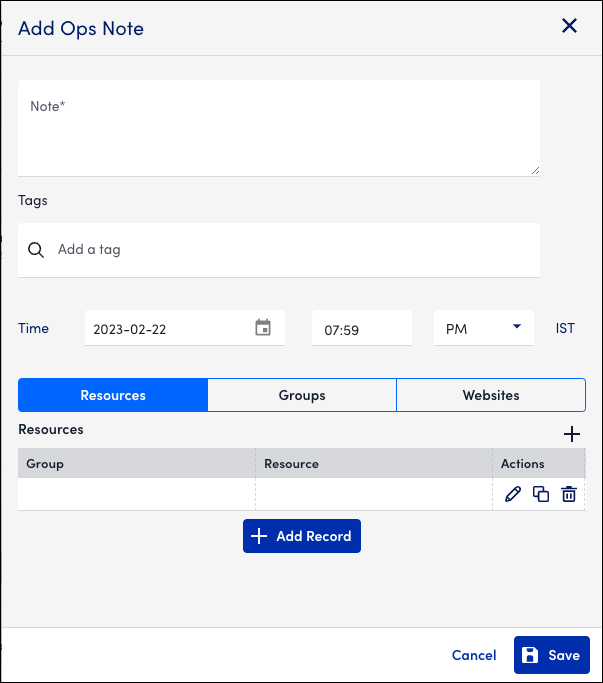
- You can provide additional information to the Ops Note:
- Add a tag. A tag can be the name of a device, group, dashboard, DataSource, instance, or any string. It is recommended to include tags based on event type (bug, deployment, upgrade, manual changes). Because tags are searchable, tagging Ops Notes based on event type provides a historical log that will contextualize how certain actions impact your environment.
- Time. The date and time associated with the Ops Note.
- Resources, Groups, Websites. Determines all the devices/device groups to which the Ops Note will be applied. If Groups is selected, the Ops Note will appear on all graphs of all devices within the specified group(s). If Resources or Websites is selected, then the Ops Note will only appear on graphs associated with the designated device or service. Limiting the scope of Ops Notes ensures that they only are associated with data that correlates to the event they represent.
- Actions. For Resources, you can edit, copy, or delete the Resource Name or Resource Group Name from the Ops Note.
- Add Record. Adds a new Resource, Group, or Website to the Ops Note.
- Click Save.
Viewing Ops Notes
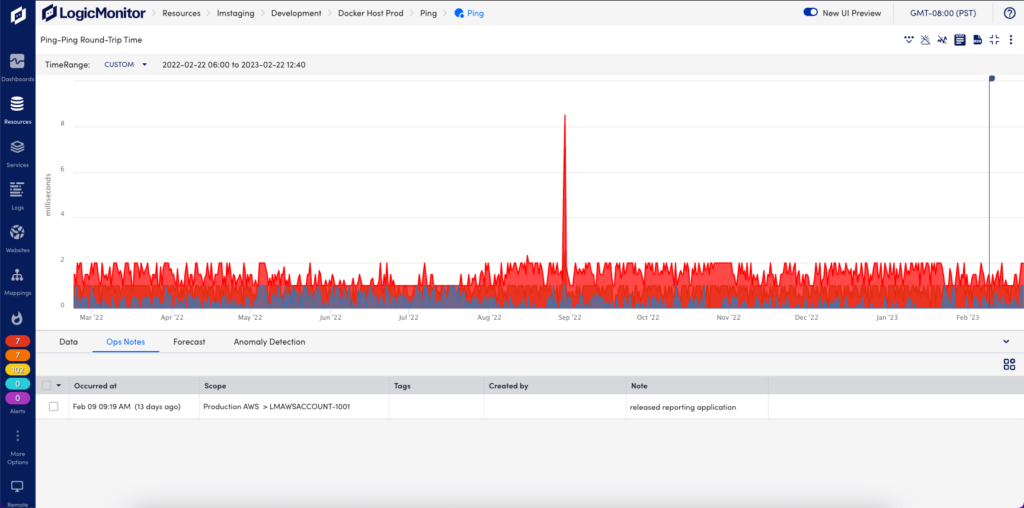
Ops Notes are displayed the Ops Notes panel on the Graphs tab when you click Show Ops Notes ![]() . Alternatively, you can go to Graphs > View Chart Fullscreen. This opens the graph in full screen mode, where you can select the Ops Notes tab to view. For more information, see Graphs Tab.
. Alternatively, you can go to Graphs > View Chart Fullscreen. This opens the graph in full screen mode, where you can select the Ops Notes tab to view. For more information, see Graphs Tab.
Note: From the Ops Notes panel, you can search created Ops Notes based on time range, device/service, group, tags, or note content. This allows you to filter through all your past Ops Notes to find data specific to an event or device. All Ops Notes can be viewed, however, a maximum number of 50 Ops Notes can be displayed at a given time in a graph. When viewing a graph with a long time range, older Ops Notes may be suppressed if more than 50 have been created within that time period.
