
Application Topology Overview
Last updated - 03 October, 2025
Application topology enables you to get a holistic insight into your application. You can visualize your complex application services and navigate based on topology relationships. In addition, troubleshoot alerts within your application on a topology map.
By default, the application topology page displays only a topology map of all your services within a given namespace (application) and how the services are linked to each other. If there are any alerts, they display on the service icons with the severity. In addition, you can individually click each service for more details.
Use Case for Application Topology
You can use application topology to investigate issues in an application that provides a checkout service. If you receive an abnormal error rate alert for the checkout operation in your application, you can use the topology map to investigate upstream services, such as cc-validation, and how the service impacts the downstream checkout service. You can locate the error within the operation that calls out to a third-party validation provider, allowing you to resolve the error.
Requirements for using Application Topology
To use application topology, you must have a LogicMonitor Enterprise license along with a LogicMonitor APM license. If you are using the LogicMonitor pre-configured OpenTelemetry Collector to send traces from your application into LogicMonitor, ensure the status of the collector is running. For more information, see to OpenTelemetry Collector for LogicMonitor Overview.
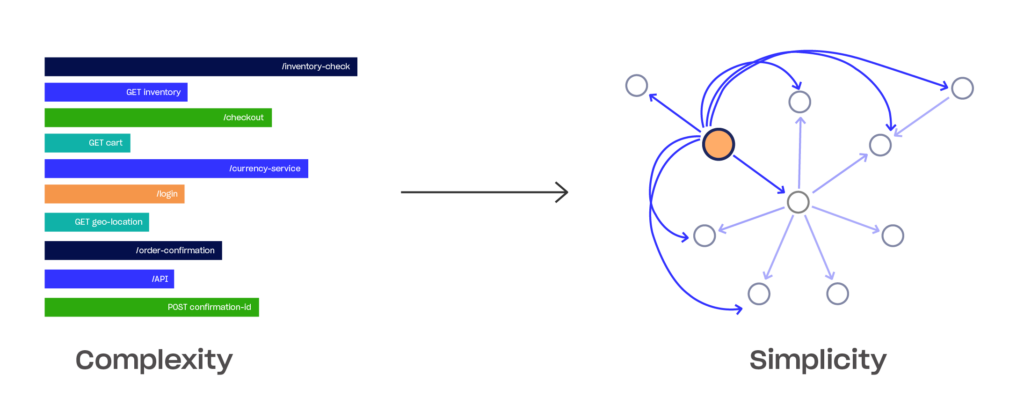
The following image illustrates how application topology simplifies your application’s complex operations:
Application Topology Page Components
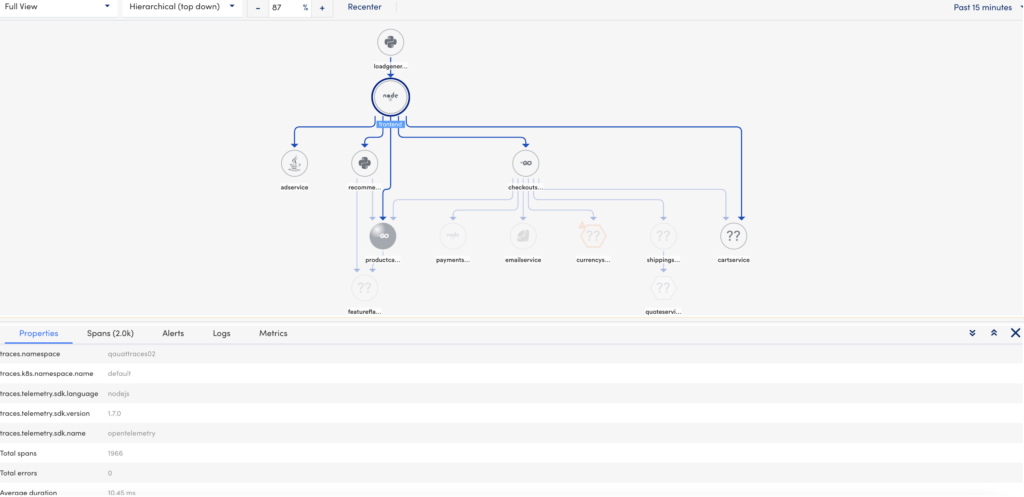
Application topology is divided into the following two visual components:
- Topology Map—A topology map of all the services and their relations to each for a specific operation. For more information, see Application Topology Map.
Note:
- The topology maps for each service are stored for fifteen days.
- The initial mapping for application topology takes approximately fifteen minutes to populate.
- Topology Table—A table consisting of all the details for each of your services (properties, spans, alerts, and logs). For more information, see Application Topology Table.
Accessing the Application Topology Page
You can access the application topology page from the traces page. In the traces table, select ![]() against the service for a span or trace, you require to check. The topology map for that given namespace (application) displays.
against the service for a span or trace, you require to check. The topology map for that given namespace (application) displays.
