
HostStatus DataSource
Last updated – 24 July, 2025
The HostStatus DataSource is a critical component for effectively monitoring your infrastructure. It associates with all devices added to your portal and is used to determine whether the device is responsive. Specifically, the idleInterval datapoint within the HostStatus DataSource measures the amount of time in seconds since the LogicMonitor Collector was able to collect data from your host via built-in collection methods (SNMP, Ping, WMI, and so on).
The absence of all data is important in order to formally declare a host as down. For example, data collection failures for individual protocols can result from credential errors such as an updated SNMP community string or a new WMI username/password. But the device may still be pingable, and thus not actually be down. Note that data collected by script DataSources does not affect the value of the idleInterval datapoint.
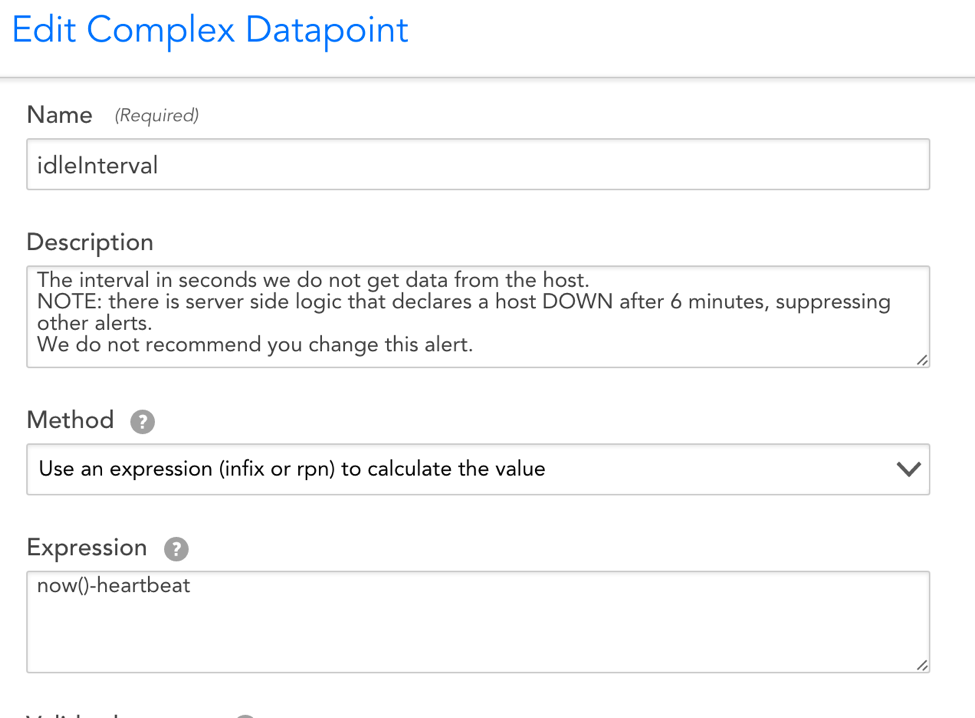
A sample configuration for the idleInterval datapoint can be seen in the following screenshot.
How the HostStatus DataSource Functions
When the associated Collector is unable to contact your host for a period of six minutes or more, all alert notifications emanating from that host will be suppressed (the six minute period of time is not configurable). This alert notification suppression will not auto-trigger an alert indicating that the host has been declared down. That is the job of the HostStatus DataSource. The HostStatus DataSource will trigger a critical alert declaring the host down following the period of time designated in the idleInterval datapoint’s alert threshold.
Note: If a newly-added device has resided in the portal for less than 30 minutes and fails host status checks, it will not be declared down after six minutes. Instead, it will require at least 30 minutes of inaccessibility before being declared down.
Note: Users should not customize the HostStatus DataSource. Changes such as increasing the idleInterval datapoint’s alert threshold or renaming the datasource can result in cascading alert suppression without notification.
Monitoring Impacts of a Host Down Alert
When a host goes down, no new alert will get generated (except HostStatus) and all other existing alert notifications emanating from the host will be suppressed. This means they will not trigger notifications to their respective escalation chains. This will reduce the noise caused by the cascading effects of your host being down.
Troubleshooting
If you receive a host down alert, but the host is not down, access the Collector Debug Facility and try one of the following primary courses of action:
- Check the network connectivity from the Collector to the host by running the
!pingcommand from the Collector debug interface. If the ping reports 0 packets returned, get the IP address of the Collector by running the!ipaddresscommand. If you can manually ping from the command line using the same IP address or domain names, then this indicates a bug. - Rare problems with the communication between the application and Collector can cause tasks not to schedule properly. If ping works, then it is possible that there is a problem with task scheduling or execution. To check task scheduling or execution, use the
!tlistand!tdetailcommands.!tlistreturns a list of all the Collector’s collection tasks and some status for each task!tdetailreturns a more detailed view of a single collection task
