
Setting up custom event integrations
Last updated - 24 July, 2025
LM Cloud offers custom event integrations that enable you to see AWS, GCP, and Azure-specific events in LogicMonitor and correlate events (such as EC2 instance state change notifications, CloudTrail logs, or Azure Activity logs) with performance data.
The setup and details of these integrations largely vary for GCP, and Azure, so refer to the following sections for additional information.
Visualizing Azure Activity Logs in LogicMonitor
You can use an Azure function to send Azure Activity Logs. You may find this useful for correlating monitoring trends and events that occurred in your Azure account.
Setup Instructions
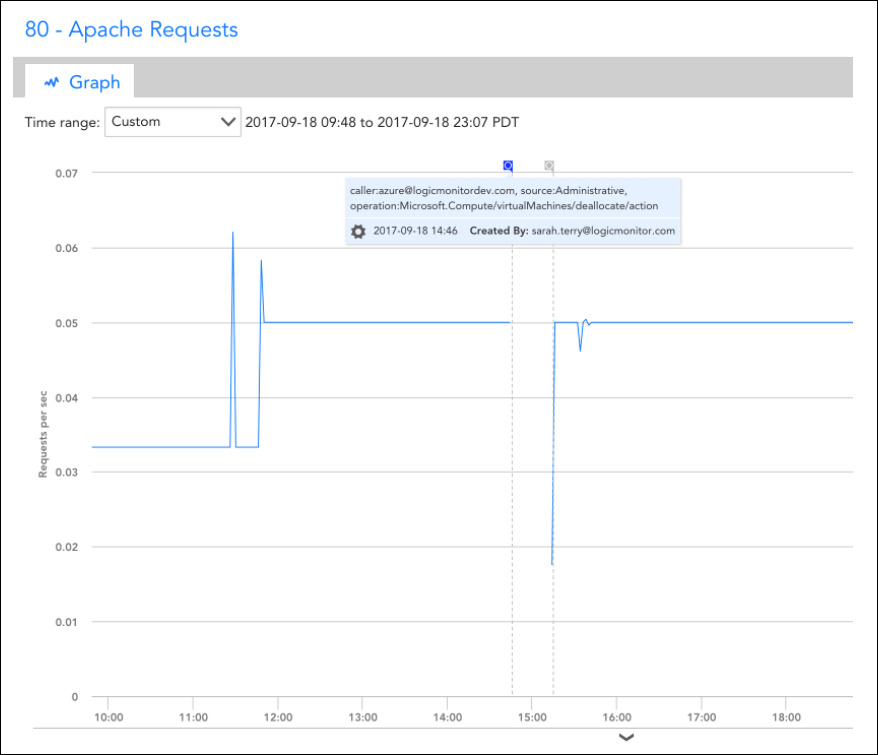
The event integration is based on an Azure Function. Specifically, you’ll need to add the Function and set up an Azure Activity Log alert rule that triggers the Function based on desired activity log events. The Function, when triggered, will use LogicMonitor’s REST API to add the events as Ops Notes for the specific devices to which they relate. Once the Ops Notes have been created for monitored resources that have associated events, you’ll see them on all device and dashboard graphs for those resources. You can further filter the events that show up using the Ops Notes panel.
Assuming you already have monitored Azure resources in LogicMonitor, you’ll need to perform the following steps to setup the integration:
1. Create a set of API tokens in your LogicMonitor account that the integration will use. For more information, see API Tokens.
Note: For using these API tokens, the user must have permission to manage all devices to create OpsNotes. We recommend creating a designated API user for the integration.
2. Add a new Azure Function App.
Note: Functions can be viewed or created from within the App Services section. Once created, you must add an HTTPTrigger Powershell Function within the App.
3. Add the following script to the HTTP Trigger PowerShell Functions:
# POST method: $req
$requestBody = Get-Content $req -Raw | ConvertFrom-Json

$caller = $requestBody.data.context.activityLog.caller
$source = $requestBody.data.context.activityLog.eventSource
$time = $requestBody.data.context.activityLog.eventTimestamp
$operation = $requestBody.data.context.activityLog.operationName
$resourceId = $requestBody.data.context.activityLog.resourceId
$resourceGroup = $requestBody.data.context.activityLog.resourceGroupName

Write-Output $resourceId | Out-String

<# account info #>
$accessId = 'API_ID'
$accessKey = 'API_KEY'
$company = 'LM_ACCOUNT'

$encoded = [uri]::EscapeDataString($resourceId)

<# Get Devices request details #>
$httpVerb = 'GET'
$resourcePath = '/device/devices'
$queryParams = '?filter=systemProperties.name:system.azure.resourceid,systemProperties.value:' + $encoded

Write-Output $queryParams | Out-String

<# Construct URL #>
$url = 'https://' + $company + '.logicmonitor.com/santaba/rest' + $resourcePath + $queryParams

<# Get current time in milliseconds #>
$epoch = [Math]::Round((New-TimeSpan -start (Get-Date -Date "1/1/1970") -end (Get-Date).ToUniversalTime()).TotalMilliseconds)

<# Concatenate Request Details #>
$requestVars = $httpVerb + $epoch + $resourcePath

<# Construct Signature #>
$hmac = New-Object System.Security.Cryptography.HMACSHA256
$hmac.Key = [Text.Encoding]::UTF8.GetBytes($accessKey)
$signatureBytes = $hmac.ComputeHash([Text.Encoding]::UTF8.GetBytes($requestVars))
$signatureHex = [System.BitConverter]::ToString($signatureBytes) -replace '-'
$signature = [System.Convert]::ToBase64String([System.Text.Encoding]::UTF8.GetBytes($signatureHex.ToLower()))

<# Construct Headers #>
$auth = 'LMv1 ' + $accessId + ':' + $signature + ':' + $epoch
$headers = New-Object "System.Collections.Generic.Dictionary[[String],[String]]"
$headers.Add("Authorization",$auth)
$headers.Add("Content-Type",'application/json')

<# Make Request #>
$response = Invoke-RestMethod -Uri $url -Method $httpVerb -Header $headers

<# Print status and body of response #>
$status = $response.status
$body = $response.data

Write-Output "Status:$status"

$deviceId = $body.items.id

Write-Output $deviceId | Out-String

If ($deviceId -ne $Null) {

#####################################

<# Add Ops Note request details #>
$httpVerb = 'POST'
$resourcePath = '/setting/opsnotes'
$data = '{"note":"caller:' + $caller + ', source:' + $source + ', operation:' + $operation + '","tags":[{"name":"Azure Activity Log"}],"scopes":[{"type":"device","deviceId":"' + $deviceId + '"}]}'

<# Construct URL #>
$url = 'https://' + $company + '.logicmonitor.com/santaba/rest' + $resourcePath

<# Get current time in milliseconds #>
$epoch = [Math]::Round((New-TimeSpan -start (Get-Date -Date "1/1/1970") -end (Get-Date).ToUniversalTime()).TotalMilliseconds)

<# Concatenate Request Details #>
$requestVars = $httpVerb + $epoch + $data + $resourcePath

<# Construct Signature #>
$hmac = New-Object System.Security.Cryptography.HMACSHA256
$hmac.Key = [Text.Encoding]::UTF8.GetBytes($accessKey)
$signatureBytes = $hmac.ComputeHash([Text.Encoding]::UTF8.GetBytes($requestVars))
$signatureHex = [System.BitConverter]::ToString($signatureBytes) -replace '-'
$signature = [System.Convert]::ToBase64String([System.Text.Encoding]::UTF8.GetBytes($signatureHex.ToLower()))

<# Construct Headers #>
$auth = 'LMv1 ' + $accessId + ':' + $signature + ':' + $epoch
$headers = New-Object "System.Collections.Generic.Dictionary[[String],[String]]"
$headers.Add("Authorization",$auth)
$headers.Add("Content-Type",'application/json')

<# Make Request #>
$response = Invoke-RestMethod -Uri $url -Method $httpVerb -Body $data -Header $headers

<# Print status and body of response #>
$status = $response.status
$body = $response.data | ConvertTo-Json -Depth 5

Write-Output "Status:$status"
Write-Output "Response:$body"
}4. Get the function URL (upper right of function text) – you’ll need to add this to your Azure Activity Log alert rule.
5. Within the Monitor service, select the Alerts section and configure an activity log alert that matches the events you want to see in LogicMonitor. You must add a new Action of type Webhook, and add the Function URL as the description.
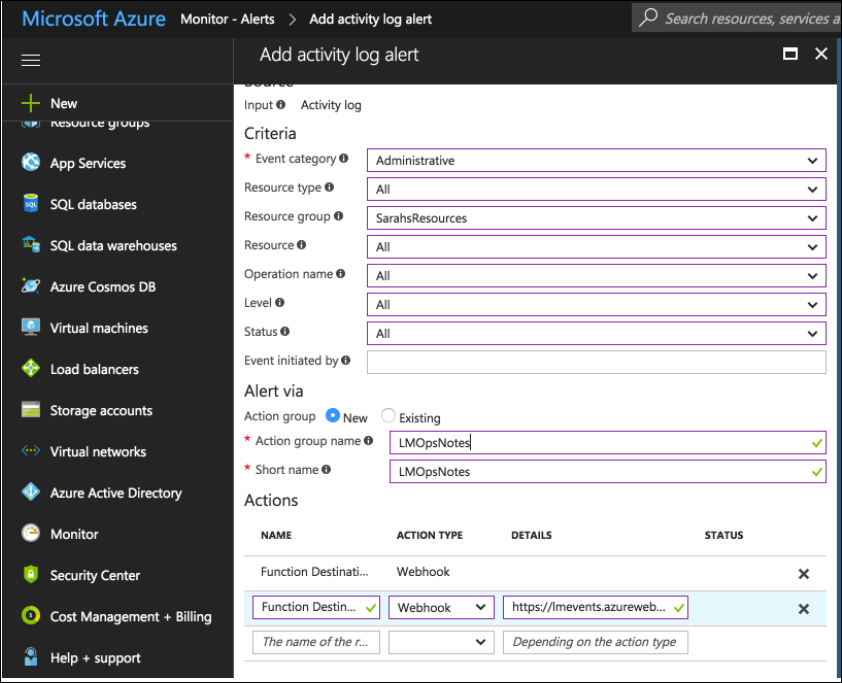
Once the steps are complete, all Azure Activity Logs that match your rule configured in step 5 should be added as LogicMonitor Ops Notes for the specific monitored resources to which they relate to which they relate.
