
Log Processing
Last updated - 30 December, 2025
Log events are received through the LogIngest API, before being mapped to resources in LogicMonitor and further processed and stored.
The high-level process includes the following:
- Collection—Locally using agents, or sent by the data source.
- Ingestion—Sending the collected data to an ingestion layer.
- Storage—Storing logs as long as they are needed for compliance.
- Analysis—Through search or a live analysis system, and alert creation.
The log processing is described in more detail in the following.
Log Processing Flow
The log processing flow is explained in more detail in the following.
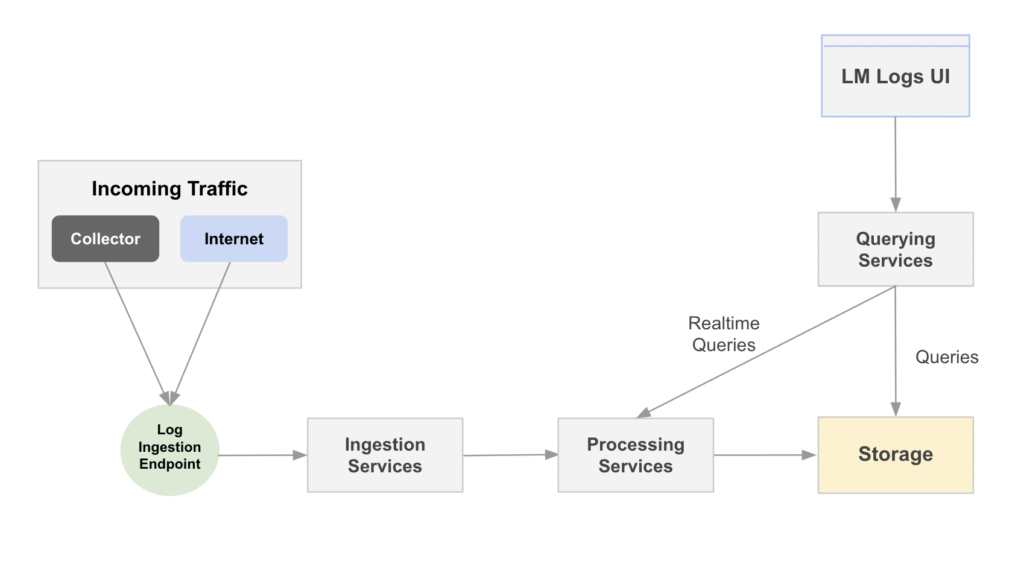
- Incoming Traffic—Log events are received from various resources. These can be a host machine, LM Log collectors or log servers, cloud services, or other applications and technologies. For more information, see LM Logs Overview.
- Log Ingestion Endpoint—Provides the API endpoint for sending events to LM Logs. Enriches logs with metadata, and forwards them to the log ingestion services for further processing.
- Ingestion Services—Receives log events as JSON payloads. Performs validation, authentication, authorization and resource mapping.
- Processing Services—Consumes ingested logs, applies anomaly detection algorithm, and prepares logs for storage. Triggers alerts based on pipeline and alert condition configurations.
- LM Logs UI—Receives user input such as log queries, added pipelines, and log usage.
- Querying Services—Processes queries received from the UI and sends saved queries for storage.
- Storage—Stores events and anomalies from log processing, and queries from querying services.
Log Processing Components
The following provides an overview of components involved in log ingestion and processing.
Logs Ingest Public API
The LogIngest API retrieves log events from different collection sources. You can also send logs directly to LM through the logs ingestion API. For more information, see Sending Logs to the LM Logs Ingestion API.
Log Ingestion
When setting up LM Logs, resources and services are configured to forward data to one of various log ingestion methods. For more information, see About Log Ingestion.
Log Anomaly Detection
Anomalies are changes in log data that fall outside of normal patterns. LM Logs detects anomalies based on parsed log event structures. For more information, see Log Anomaly Detection.
Log Processing Pipelines
Log events are channeled into pipelines analyzing structure patterns looking for anomalies. You can define filters and set alert conditions to track specific logs. For more information, see Log Processing Pipelines.
Log Alert Conditions
Log alerts are alert conditions based on log events and log processing pipelines. Alert conditions use regular expression patterns to match ingested logs and trigger LM alerts. For more information, see Log Alert Conditions.
Log Queries
The logs query language expands the standard search capabilities beyond keyword searches and filtering to narrow down information when troubleshooting. For more information, see Query Language Overview.
Log Retention
Log retention refers to the archiving of event logs, concerning the duration for which you store these log entries. For more information, see Data Retention.
Log Usage
Logs volume usage and ingestion quotas are collected and enriched by the log process, and retrieved from metadata for input to the logs usage reporting. For more information, see LM Logs Usage Monitoring.
Collectors
Collectors retrieves data from monitored resources and provide the data to the log ingestion. There several types of collectors for log ingestion. For more information, see About the LM Collector.
Alerts
Alerts are generated based on filters and conditions configured for resources. The overall Alerts page displays alerts across all monitored resources. For more information, see Types of Alerts in LogicMonitor.
