
Disclaimer: This content applies to the legacy UI and is no longer maintained. It will be removed at a future time. For up-to-date content, see Logs for LM Integrations. At the time of removal, you will automatically be redirected to the up-to-date content.
Integrations Logs Filtering and Sorting
Last updated - 25 July, 2025
The Logs tab in Integrations displays a summary of all integration calls LogicMonitor made to an integration. You can filter and sort the logs displayed to optimize relevancy and find the information you need.
Filtering and Sorting Integrations Logs
- Navigate to Settings > Integrations, and select the Logs tab.
- To filter results, do one or any combination of the following:
- To filter logs based on the integration instance, select the Integration filter, and then type a value into the text field.
LogicMonitor attempts to match integration names as you type.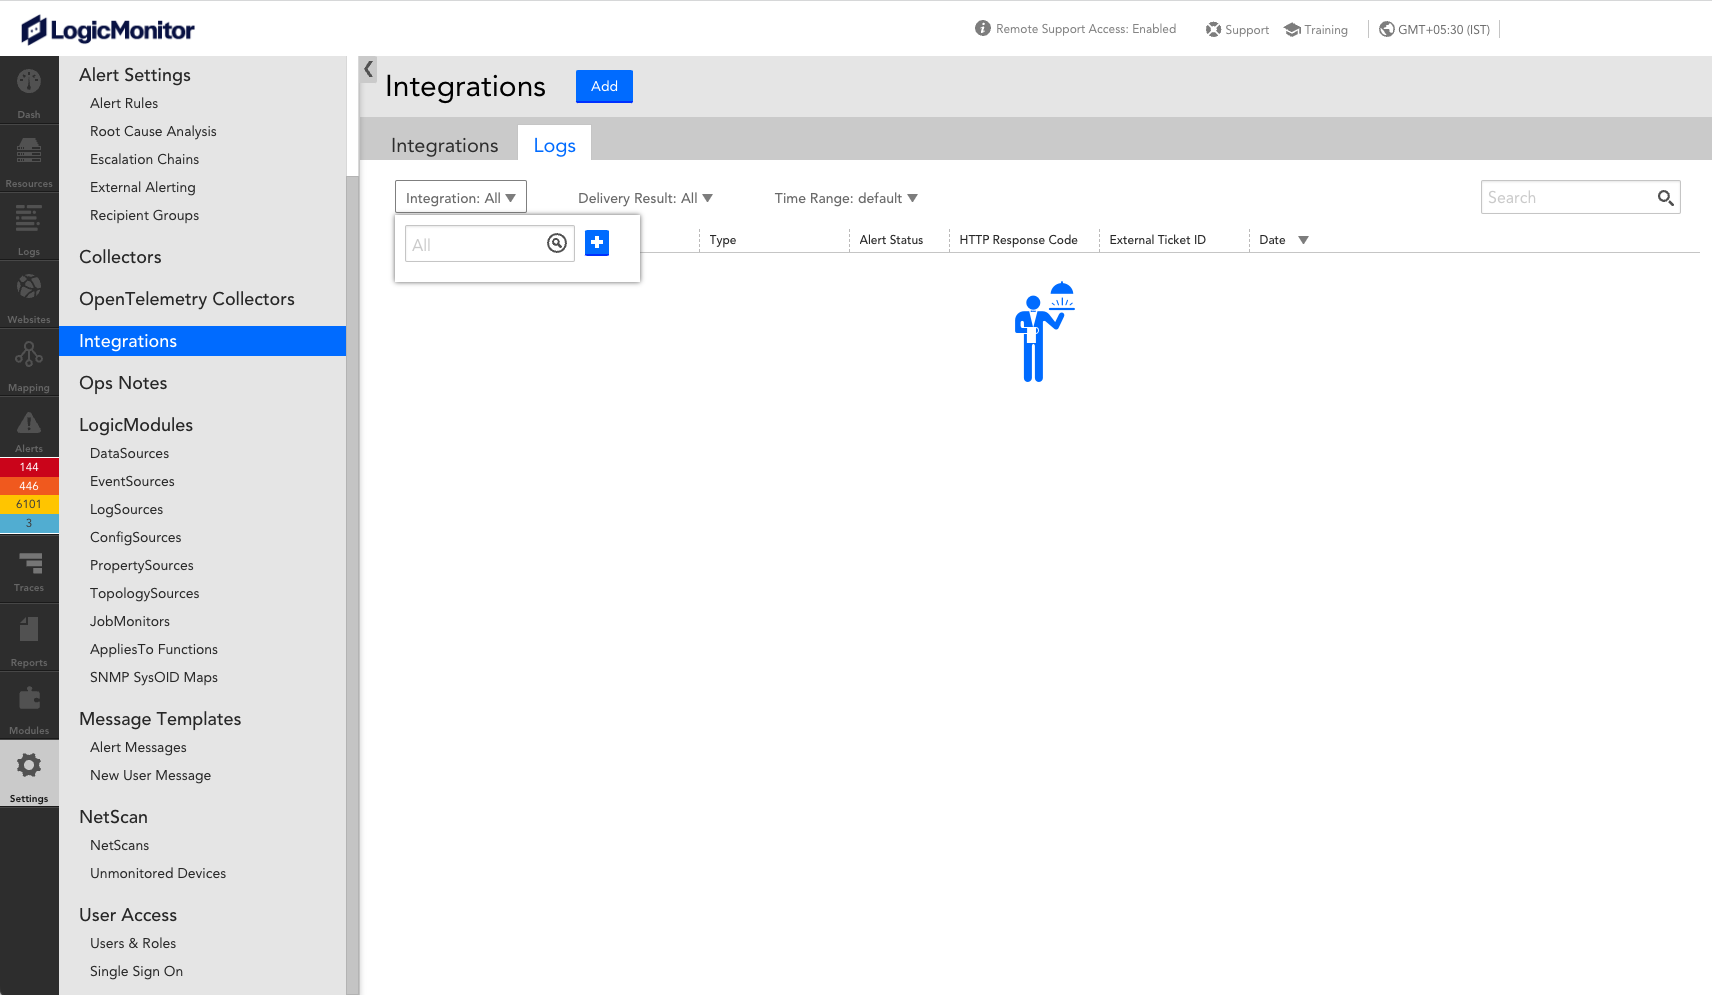
- To filter logs based on the delivery result, select the Delivery Result filter, and then select the status of the integration call.
The logs list updates based on the status you select.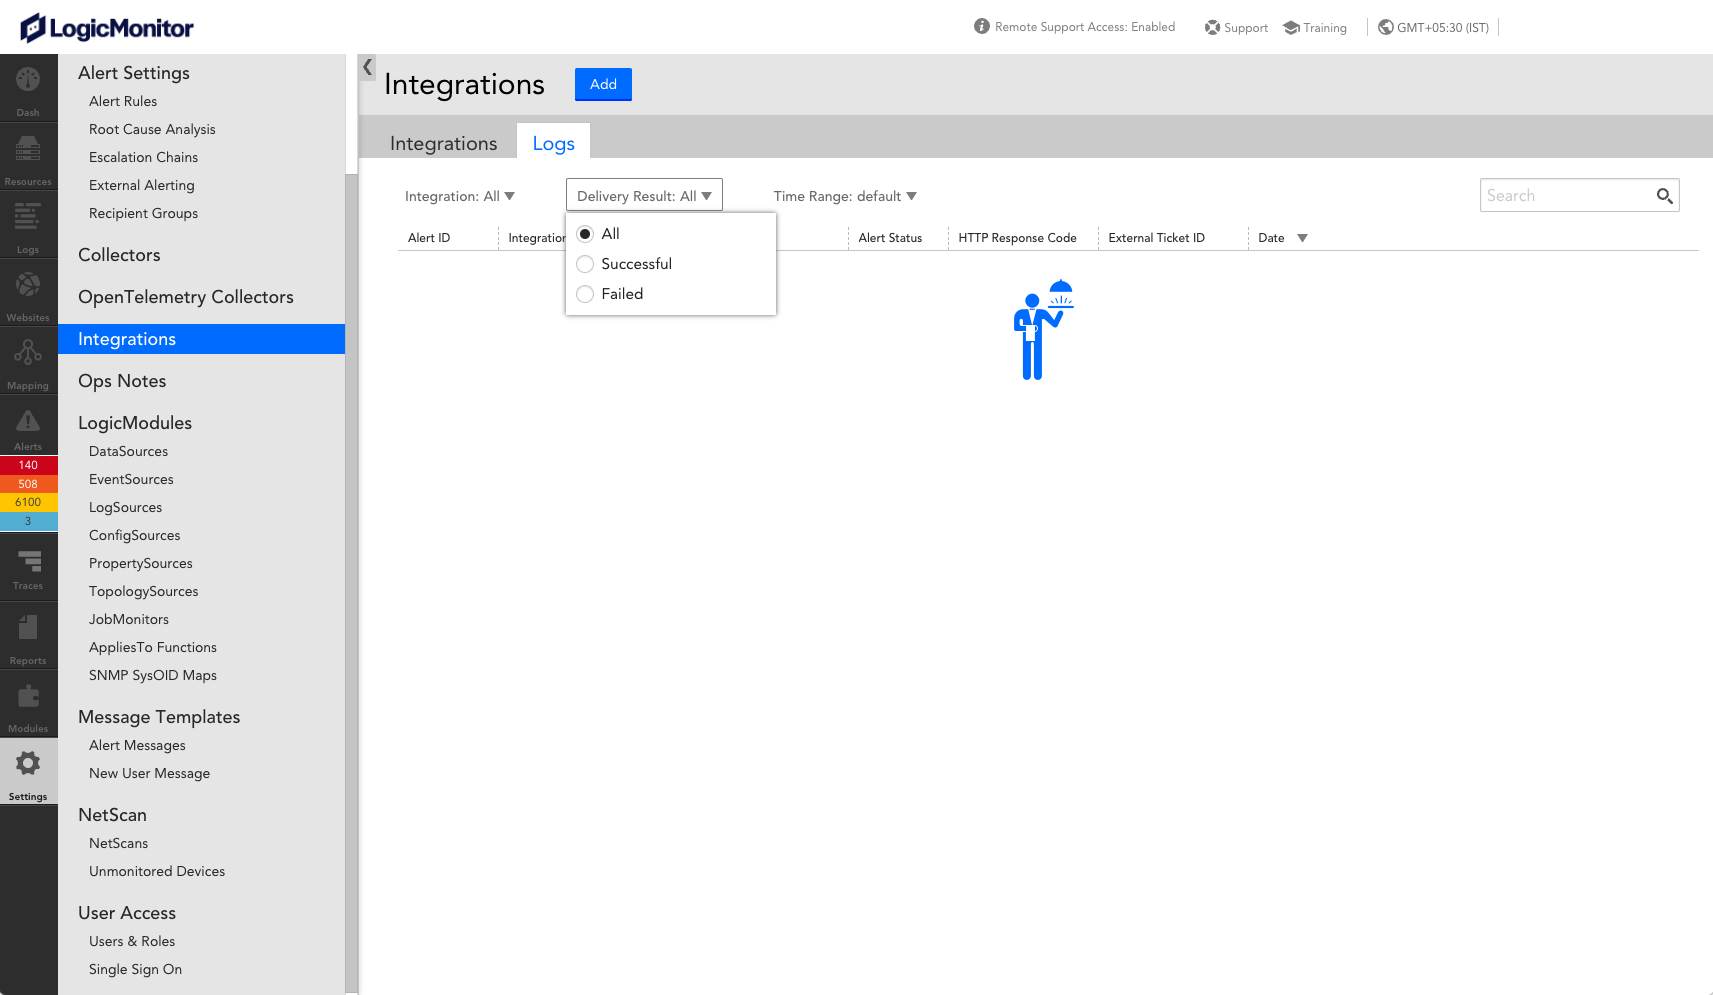
- To filter logs based on a time range, select the Time Range filter, and then select the desired type of time range.
Selecting an option other than the default time range allows you to select from a predefined list of time ranges or customize a specific time range down to the minute.
The default time range is the last 24 hours.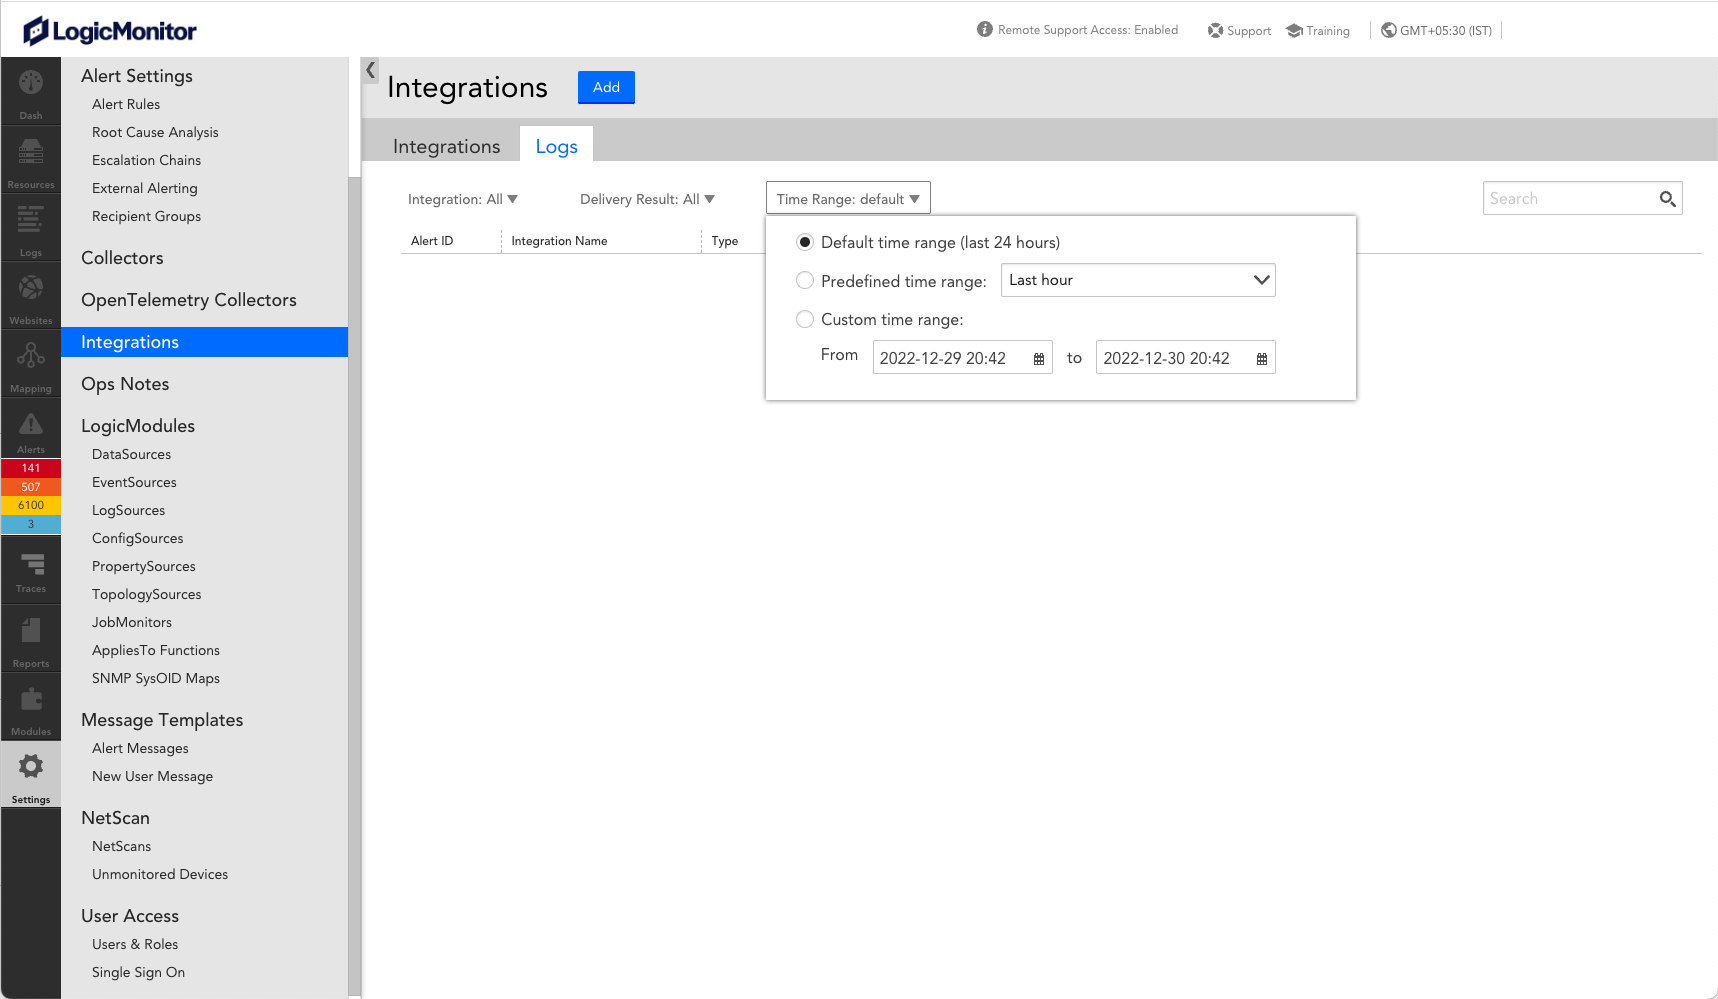
- To filter logs based on the integration instance, select the Integration filter, and then type a value into the text field.
- To sort the list of logs displayed, select the column header you want to sort by.
Sorting reorganizes the list of logs in ascending or descending order based on the column you select.
You can view the log information for the integration from the list that displays based on your filter and sorting. In addition to filtering and sorting the logs, you can use the search bar to find the logs you are looking for by entering a value into the Search field.
