
Usage Reporting for IaaS Monitoring
Last updated – 17 March, 2026
You can leverage Usage Reporting to view the usage metrics for IaaS monitoring directly in your LogicMonitor portal. IaaS monitoring is part of LogicMonitor’s cloud monitoring solution, and the usage metrics for IaaS monitoring contain all supported cloud VMs (AWS EC2, Azure VM, Azure ScaleSetVM, GCP Compute Engine instances), and any other cloud resources monitored using an LM local collector.
LogicMonitor divides the usage metrics for your IaaS and non-computer resources allowing you to view them separately. You can also view the combined metrics for moth IaaS and non-computer resources for a total of the resources that contribute to IaaS resource usage.
For a list of IaaS and non-compute resources, see Cloud Services and Resource Units.
Billing and Usage Calculation for Iaas Monitoring
LM Cloud IaaS enables monitoring of cloud compute resources using LogicMonitor’s discovery, metrics, and alerting capabilities. IaaS usage includes cloud VMs and other cloud resources monitored through an LM local collector. Each purchased IaaS unit also includes entitlement for 10 Cloud non-compute resources.
Usage for IaaS Monitoring is measured based on the monthly average number of monitored cloud resources, rather than peak or total counts.
The following table summarizes how LogicMonitor determines IaaS usage and billing:
| Category | Details |
| What Counts Toward IaaS Usage | All supported cloud VMs (AWS EC2, Azure VM, Azure VM Scale Set VM, GCP Compute Engine, OCI Compute) and any cloud resources monitored using an LM local collector. Note: Includes entitlement for 10 Cloud non-compute resources per IaaS unit. |
| Usage Calculation | Daily monitored resource counts are averaged across the selected month to determine total IaaS usage. |
| Billing Basis | Billing is based on the monthly average number of monitored IaaS resources. |
| Billing Considerations | Short-term spikes in monitored resources do not impact billing unless they increase the monthly average. Non-compute resources count toward usage only if they exceed the included entitlement. |
Requirements for Viewing Usage Reporting for IaaS Monitoring
To view usage data for IaaS Monitoring in Usage Reporting, you must subscribe to LM Cloud.
Viewing Usage Data for IaaS Monitoring
- Navigate to Settings > Usage.
- From the Products option, select “IaaS Monitoring”.
- From the Contributor type option, select the contributor you want to view usage for.
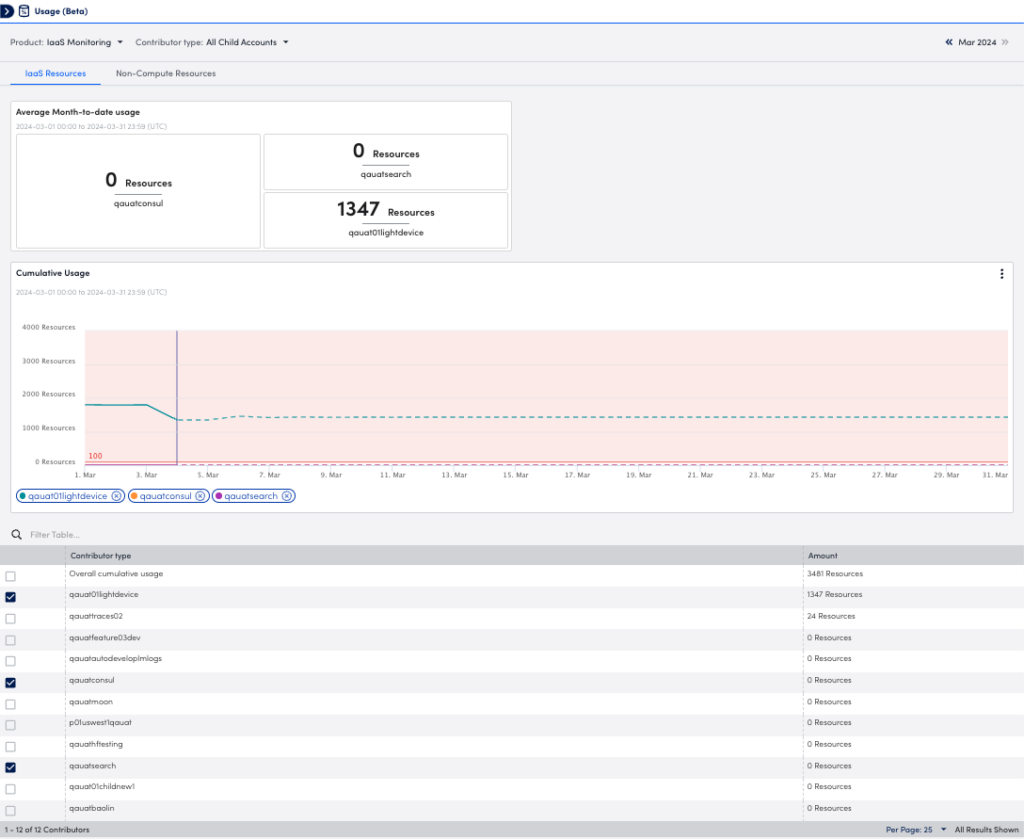
Note: This option is only available if your environment provides services to multiple portals.
- Select the month you want to view usage for.
- To view usage in a sparkline or bar graph format in the Cumulative Usage graph, select the type of graph from the Options menu of the Cumulative Usage graph.
Note: If a contributor is selected from Contributor type, you must select a contributor from the Usage Contributors table to display data in the Cumulative Usage graph.
