Customizing Azure Monitor DataSources
Last updated on 27 August, 2024LogicMonitor DataSources that use the ‘Azure Monitor’ collection method can be customized to collect additional metrics, different aggregation methods, or metrics with specific dimensions. The JSON path field in each datapoint controls which parameters get passed by LogicMonitor’s Cloud Collector into the Azure Monitor API request.
For more information about Azure Monitor, see Azure Monitor documentation from Microsoft.
Requirements
- Add your Microsoft Azure environment to LogicMonitor. For more information, see Adding your Azure Environment to LogicMonitor.
- Install the Azure CLI. For more information, see How to install the Azure CLI from Microsoft.
Customizing the LogicMonitor Datapoint Definition
- Navigate to Modules > My Module Toolbox.
- Search for and view Azure DataSources.
- Locate and select the Azure API Management DataSource.
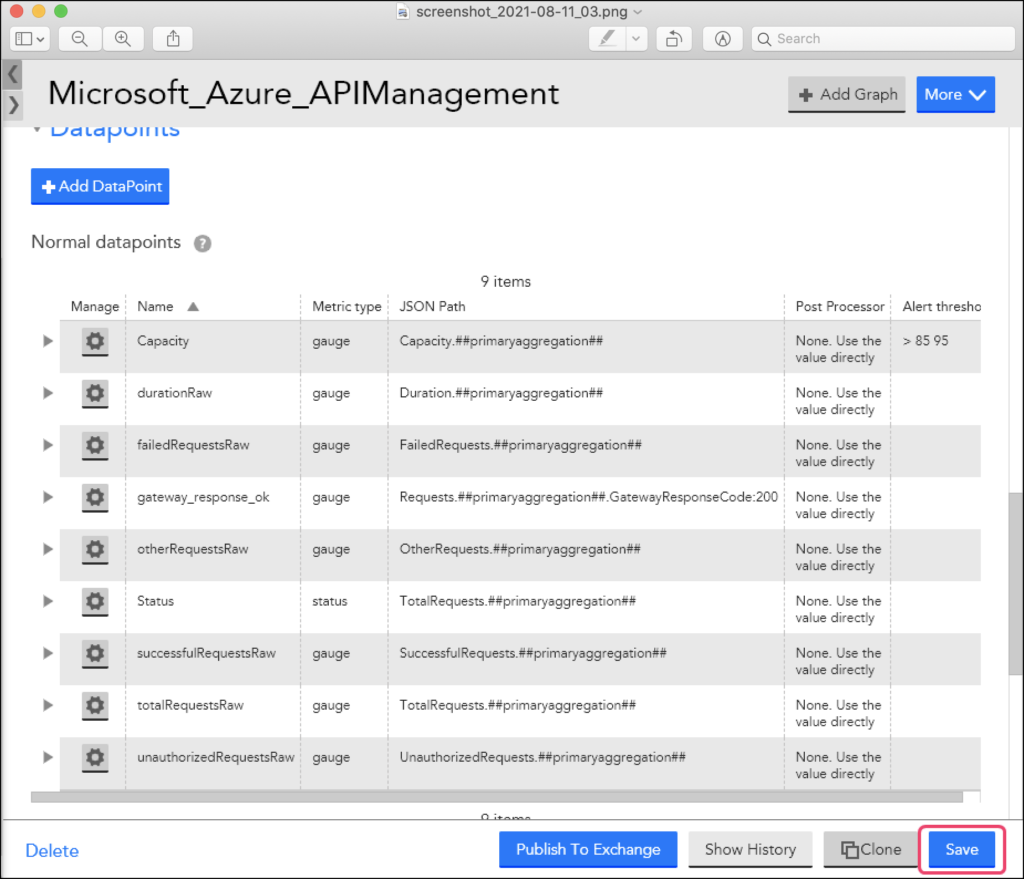
- Select the Datapoints tab.
- Select the Clone icon of an existing Normal Datapoint to create a new datapoint that you can edit and customize.
- On the Clone a Normal Datapoint pane, you can edit the Name, Description, and JSON Path.
Note: The JSON Path controls which parameters are passed by LogicMonitor’s Cloud Collector into the Azure Monitor API request. It uses the following format:metricName.aggregation.dimension - Select a Metric Type. The options are Gauge, Counter, or Derive. For more information, see Normal Datapoints. For a list of metrics that Azure Monitor supports, see for Supported metrics with Azure Monitor from Microsoft.
- (Optional) Add or edit static thresholds or dynamic thresholds.
- Save to save the new datapoint.
- To complete the update, save the LogicModule and provide an Update Reason.
JSON Path Values
The values in the JSON Path are as follows:
| Value | Required | Description | Example |
|---|---|---|---|
| metricName | Yes | Name of the Azure Monitor metric. For more information, see Supported metrics with Azure Monitor. | BytesReceived |
| aggregation | No | Aggregation method. | ##primaryAggregation##Note: ##primaryAggregation## can be used to dynamically pass in the Azure supported aggregation, as not all aggregations are supported for all metrics at all times. For a complete list of supported tokens, see Tokens Available for Data Collection. |
| dimension | No | Dimensions are name-value pairs that carry supplementary data, and may be configured when simple metric data is not sufficient. For more information, see Multi-dimensional metrics.Use the format: dimensionName:dimensionValue | GatewayResponseCode:200 |
Example
In the following example, the aggregation type available for the Requests metric is Total. So, the aggregation type Total will replace the token ##primaryaggregation## in the expression and give you the count of successful responses from the gateway.
Requests.##primaryaggregation##.GatewayResponseCode:200Dimensions in Metrics
Simple metric data such as request count does not provide sufficient context for the collected values. Dimensions are name-value pairs that carry supplementary data to describe the metric value.
For example, an Azure API Management service metric – FailedRequests supports the dimension Location. So with the Location dimension, you can view the failed requests across all the locations or for an individual location.
The Azure API Management (APIM) service is a hybrid,multi-cloud management platform for APIs across all environments. Azure Monitor provides several useful multi-dimensional metrics for the Azure API Management service.
Azure Multi-Dimensional DataSources
You can customize the Azure DataSources if you cannot find the desired metrics via LogicMonitor’s Azure Monitor coverage and LogicMonitor’s Collector. Some of the ways you can customize Azure Monitor DataSources include:
- Adding or modifying dimensions for the metrics collected: You can easily add the dimensions to the metric paths for existing DataSource definitions. In some cases, where dimension values are dynamic and not static, an Active Discovery method is the most efficient way to “discover” the dimension values as instances and monitor the associated metrics. For more information, see What is Active Discovery?
Adding Azure Multi-Dimensional Datasources
To add dimensions to the Azure DataSources, complete the following:
1. Navigate to Settings > DataSources > Add > DataSource. For more information, see Creating a DataSource.
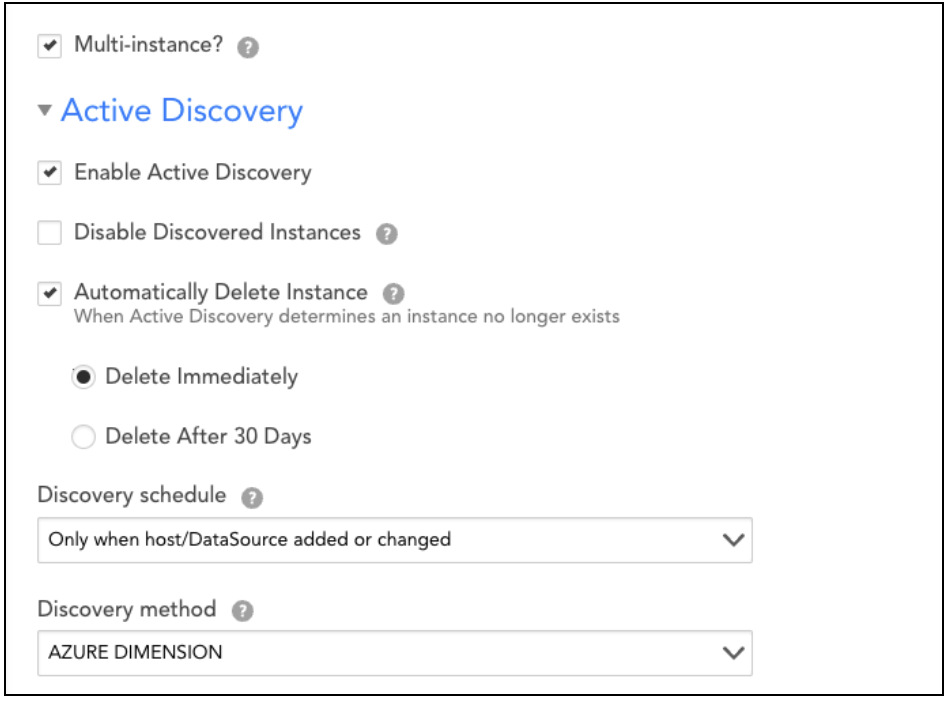
2. Enable the Multi-instance checkbox.
3. Enable the Active Discovery checkbox.
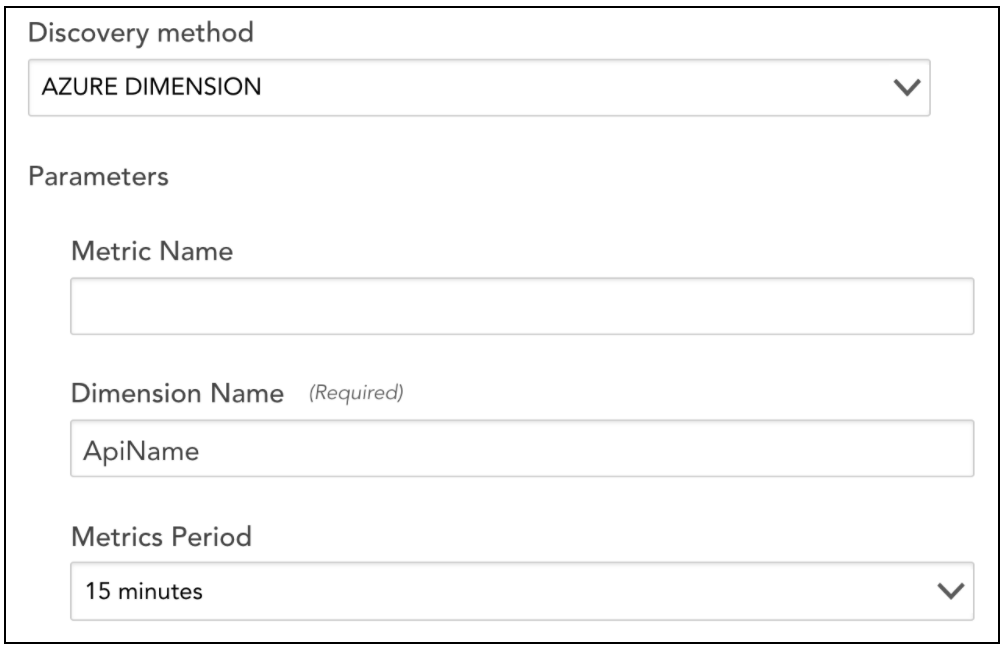
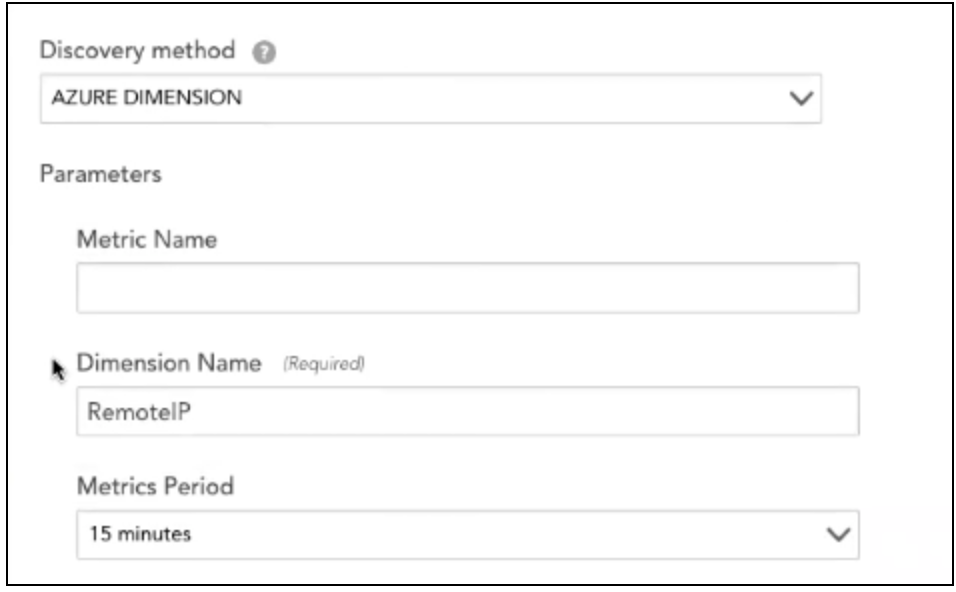
4. In the Discovery method field, select AZURE DIMENSIONS from the drop-down list.
5. Enter the required Dimension Name.
6. Select Add DataPoint.
7. On the Add Datapoint page, select Normal Datapoint.
8. Enter the details in the Name and JSON path fields.
The syntax for the JSON path is:
metricName.aggregation.dimensionName:##WILDVALUE##
Where
metricNameis the name of the Azure Monitor metricaggregationis the (optional) desired aggregation
Example
The following example illustrates how to create a multi-dimensional DataSource using the Active Discovery method.
For example: If you are creating a multi-dimensional Microsoft_Azure_VirtualNetwork DataSource, you must select Azure Dimensions in the Discovery Method field and add the required dimension name in the Dimension Name field.
So, for the Microsoft_Azure_VirtualNetwork DataSource example, you will enter RemoteIP in the Dimension Name field.
You can add all the required Datapoints related to the RemoteIP dimension. So with Azure Dimension, you can collect information for all the metrics grouped under a single dimension.
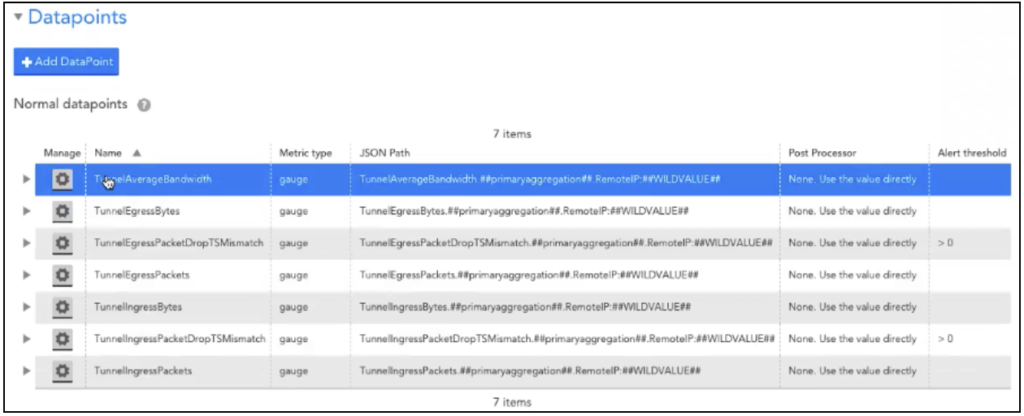
Note: For editing the JSON paths for datapoints that are using the Active Discovery method, a standard JSON path is followed for Azure Dimensions in LogicMonitor:
BgpPeerStatus.##primaryaggregation##.BgpPeerAddress:##WILDVALUE##
Note: You can also collect information for a single metric, add the <metric name> in the Metric Name field to collect information for the required metric.
Creating an Azure API Management Instance
To create an instance, complete the following steps:
- To create an Azure API Management instance, run the following Azure CLI commands:
  az group create --name apim-rg --location centralus

  az apim create --name lm-apim --resource-group apim-rg \
     --publisher-name LM --publisher-email [email protected] \
     --no-wait
Note: The Azure quickstart guide describes several other alternatives for creating an APIM instance such as the management portal, PowerShell, and ARM template.
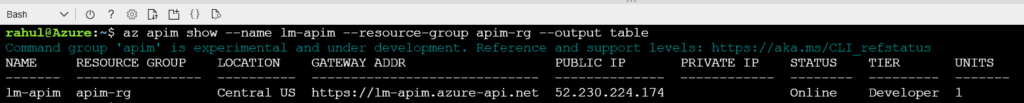
- Wait for 30 to 40 minutes to allow the Azure API Management service to be created and activated. Use the following command to record the current status of the API:
az apim show --name lm-apim --resource-group apim-rg --output table
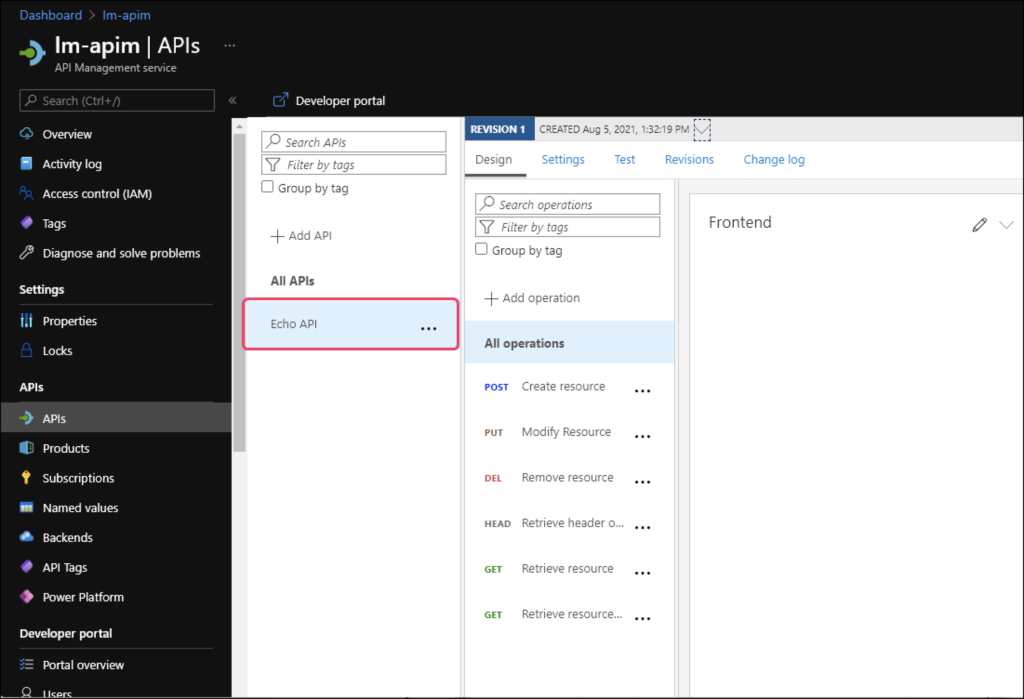
- On the Azure management portal, select the API Management service that you just created. You will find the Echo API, which is created by default when you create a new Azure API Management instance.
Note: You can use the Echo API to test the metrics.
Once you have created an instance, you can configure the APIM DataSource in LogicMonitor to ingest a multi-dimensional metric.
Inspecting the Metric
Now that you have an API Management instance and LogicMonitor recording the metrics, let’s generate some metrics from the API Management service.
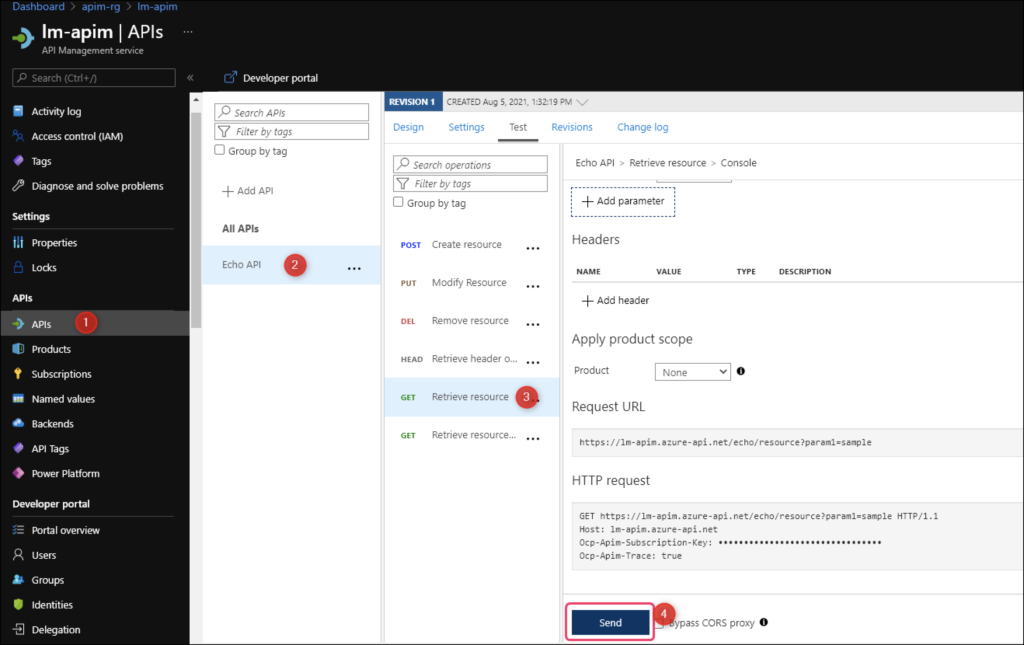
1. On the API Management service, navigate to APIs > Echo API. Select Retrieve resource GET endpoint and select on the Test tab.
2. Use the integrated test console to send a few HTTP requests to the service.
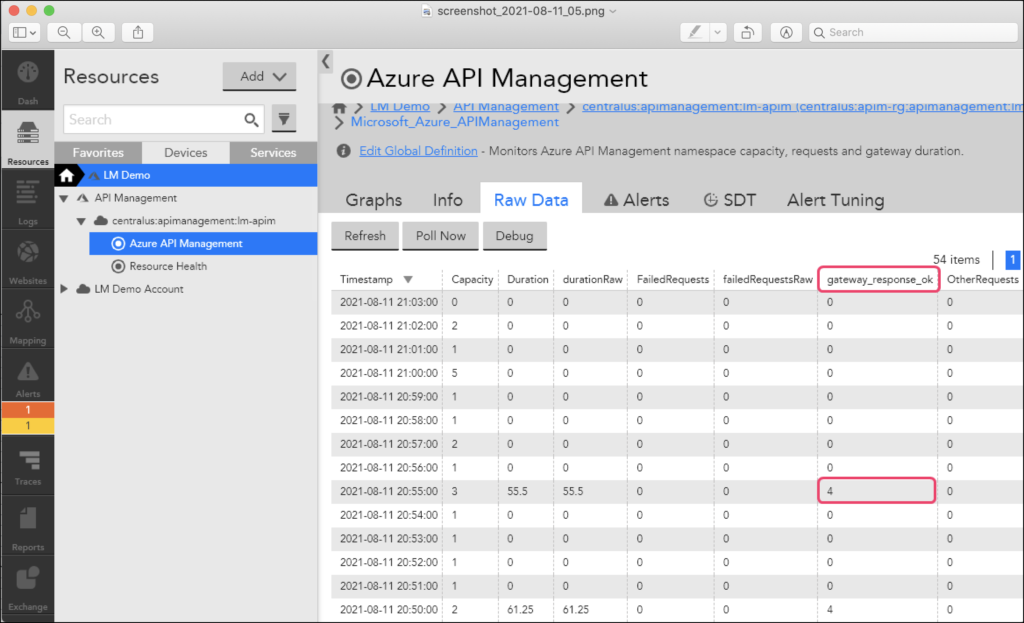
3. In LogicMonitor, navigate to the Resources page, and select your API Management resource.
4. Select the Raw Data tab to find the new metric and the aggregated values.
Note: It may take several minutes for data from Azure Insights to become available. Timestamps from Azure metrics reflect the time at which metrics were available, and not necessarily when they are queried by LogicMonitor.
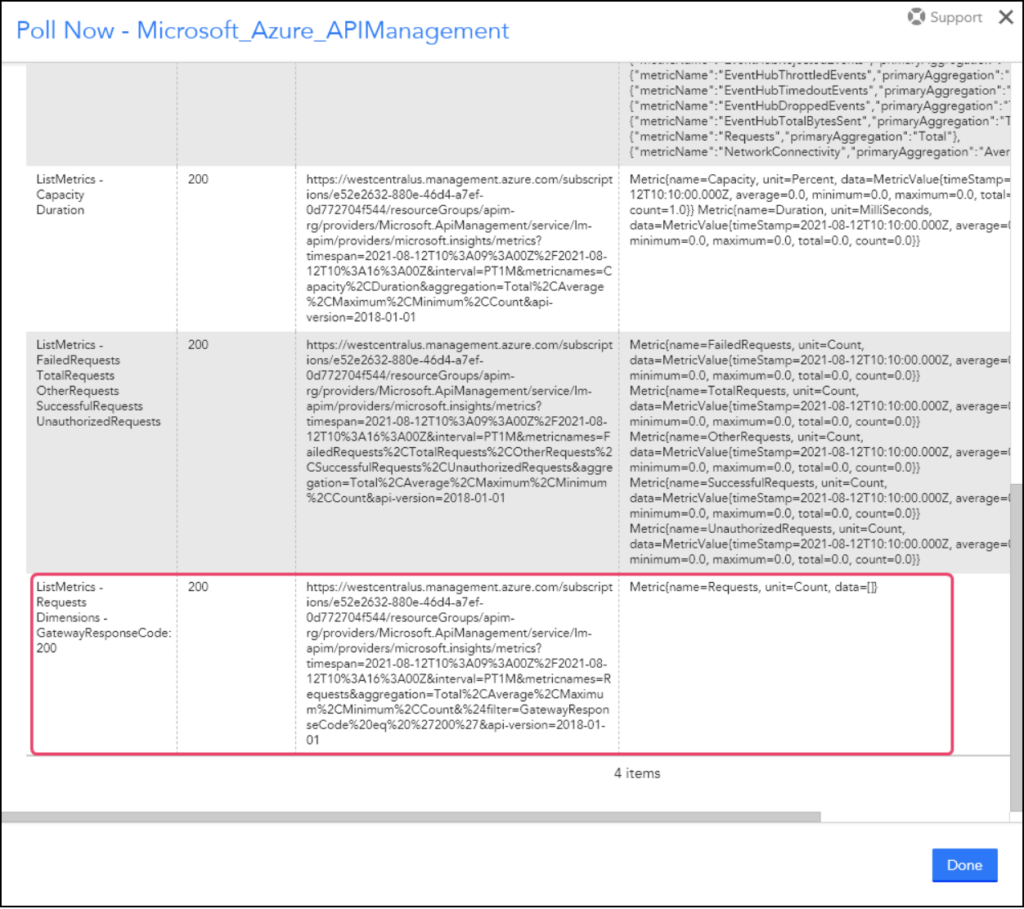
5. To view the request that LogicMonitor made to fetch the value of the new metric, select Poll Now and scroll to the Raw Request/Response section.
You will find the API request from LogicMonitor and the response from Azure Monitor as displayed in the following image: