
Disclaimer: This content applies to the legacy UI and is no longer maintained. It will be removed at a future time. For up-to-date content, see DataSources Configuration. At the time of removal, you will automatically be redirected to the up-to-date content.
Using the DataSources Page
Last updated - 25 July, 2025
From Settings | LogicModules | DataSources you can view, search for, add and edit DataSources. Each DataSource has a definition that tells your collector what information to collect, how to collect it, what device(s) to collect it from and what metrics to display in graphs.
View & Search
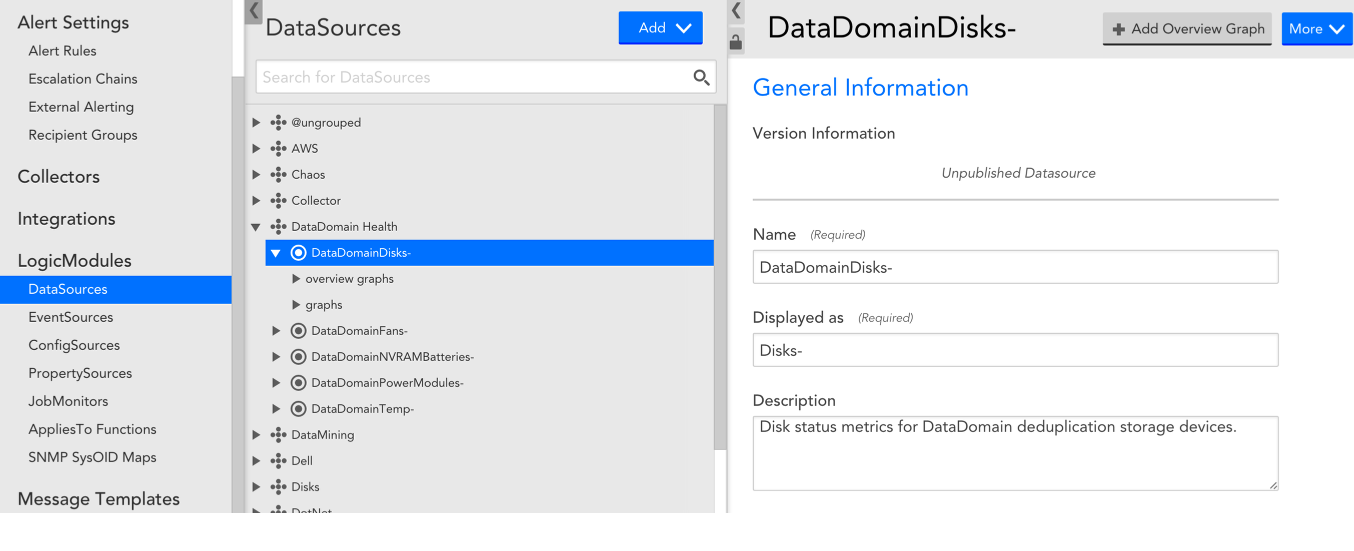
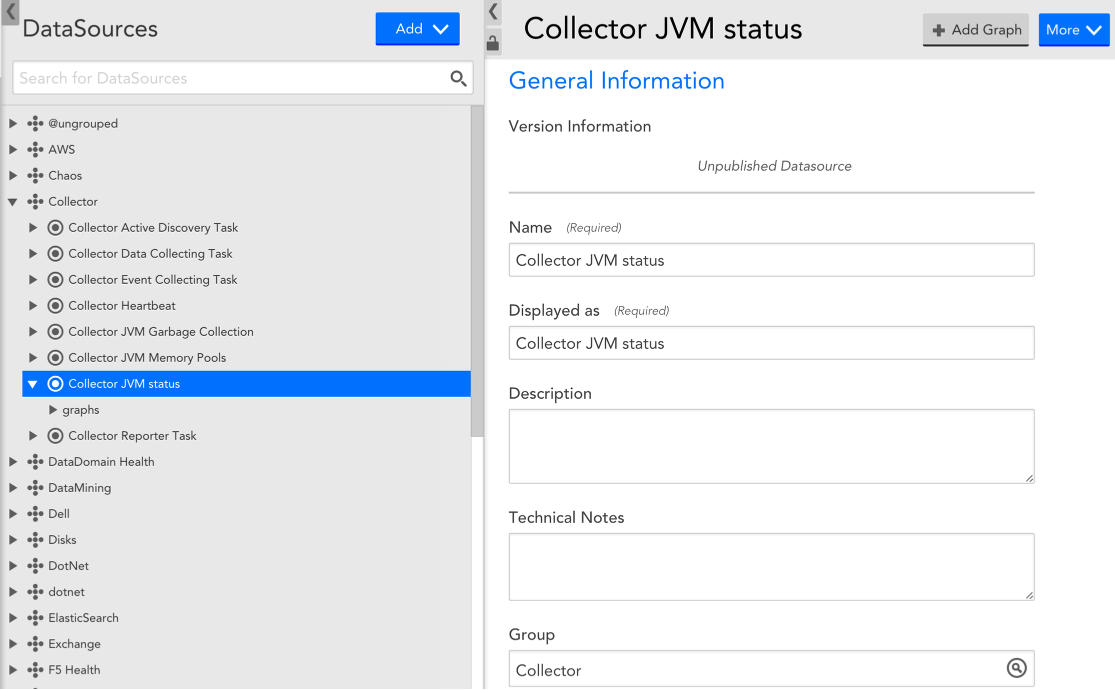
The DataSource navigation pane in Settings | LogicModules | DataSources displays all DataSource groups and DataSources. To view the definition for a particular DataSource you can either manually find it or you can use the search bar. Once you select the DataSource from the navigation pane, its definition will be displayed in the right hand side detail pane:
Focusing the DataSource search
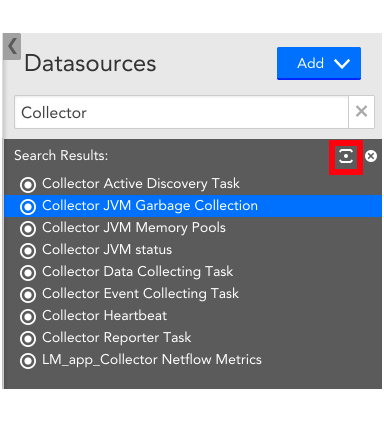
When using the search bar to find a DataSource, you can use the “Focus” icon to isolate a single DataSource and display its full configuration details. This is particularly useful if your search displays a lot of results and you would like a less crowded view.
Add
Your LogicMonitor account comes pre-configured with a library of DataSources. You can add to this library by:
- creating custom DataSources,
- Importing custom XML file format DataSources or
- importing DataSources from LogicMonitor’s repository.
Edit
You can edit DataSource definitions as desired, however, note that:
- you cannot change the collection method (Collector field) for a DataSource once it has been created
- as a best practice, we recommend that you clone a DataSource first before making major changes
For more detail on the specific fields included in a DataSource definition, see this section.
