NGINX Ingress Controller Monitoring
Last updated - 09 August, 2023
The Ingress is a Kubernetes resource that exposes HTTP and HTTPS routes from outside the cluster to services within the cluster. The cluster must have an ingress controller running for the Ingress resource to work. For more information, see Ingress and Ingress Controllers from Kubernetes documentation.
NGINX Ingress Controller is a type of ingress controller that runs in a cluster and configures an HTTP load balancer according to traffic routing rules. For more information, see How NGINX Ingress Controller Works from NGINX documentation.
Important: NGINX Ingress Controller Monitoring is available with LM Container Helm Charts version 4.2.0 or later.
Requirements for Monitoring NGINX Ingress Controller
- Ensure to enable Prometheus metrics in NGINX Ingress Controller. For more information on exposing Prometheus, see Prometheus from NGINX documentation.
- Ensure to have the Kubernetes_Nginx_IngressController datasource and addCategory_NginxIngressController propertysource enabled.
Note: This is a multi-instance datasource, with each instance indicating a replica (Pod) of the NGINX Ingress Controller. This datasource is available for download from LM Exchange.
Setting up NGINX Ingress Controller Monitoring
Installation
You do not need any separate installation on your cluster to use the NGINX Ingress Controller.
Depending on your preference, you can install LM Containers with the following two options:
- Installing through the user interface. For more information, see Installing the LM Container Helm Chart.
- Installing through the command line interface. For more information, see Installing LM Container Chart using CLI.
Configuration
The NGINX Ingress Controller is pre-configured for monitoring. No additional configurations are required.
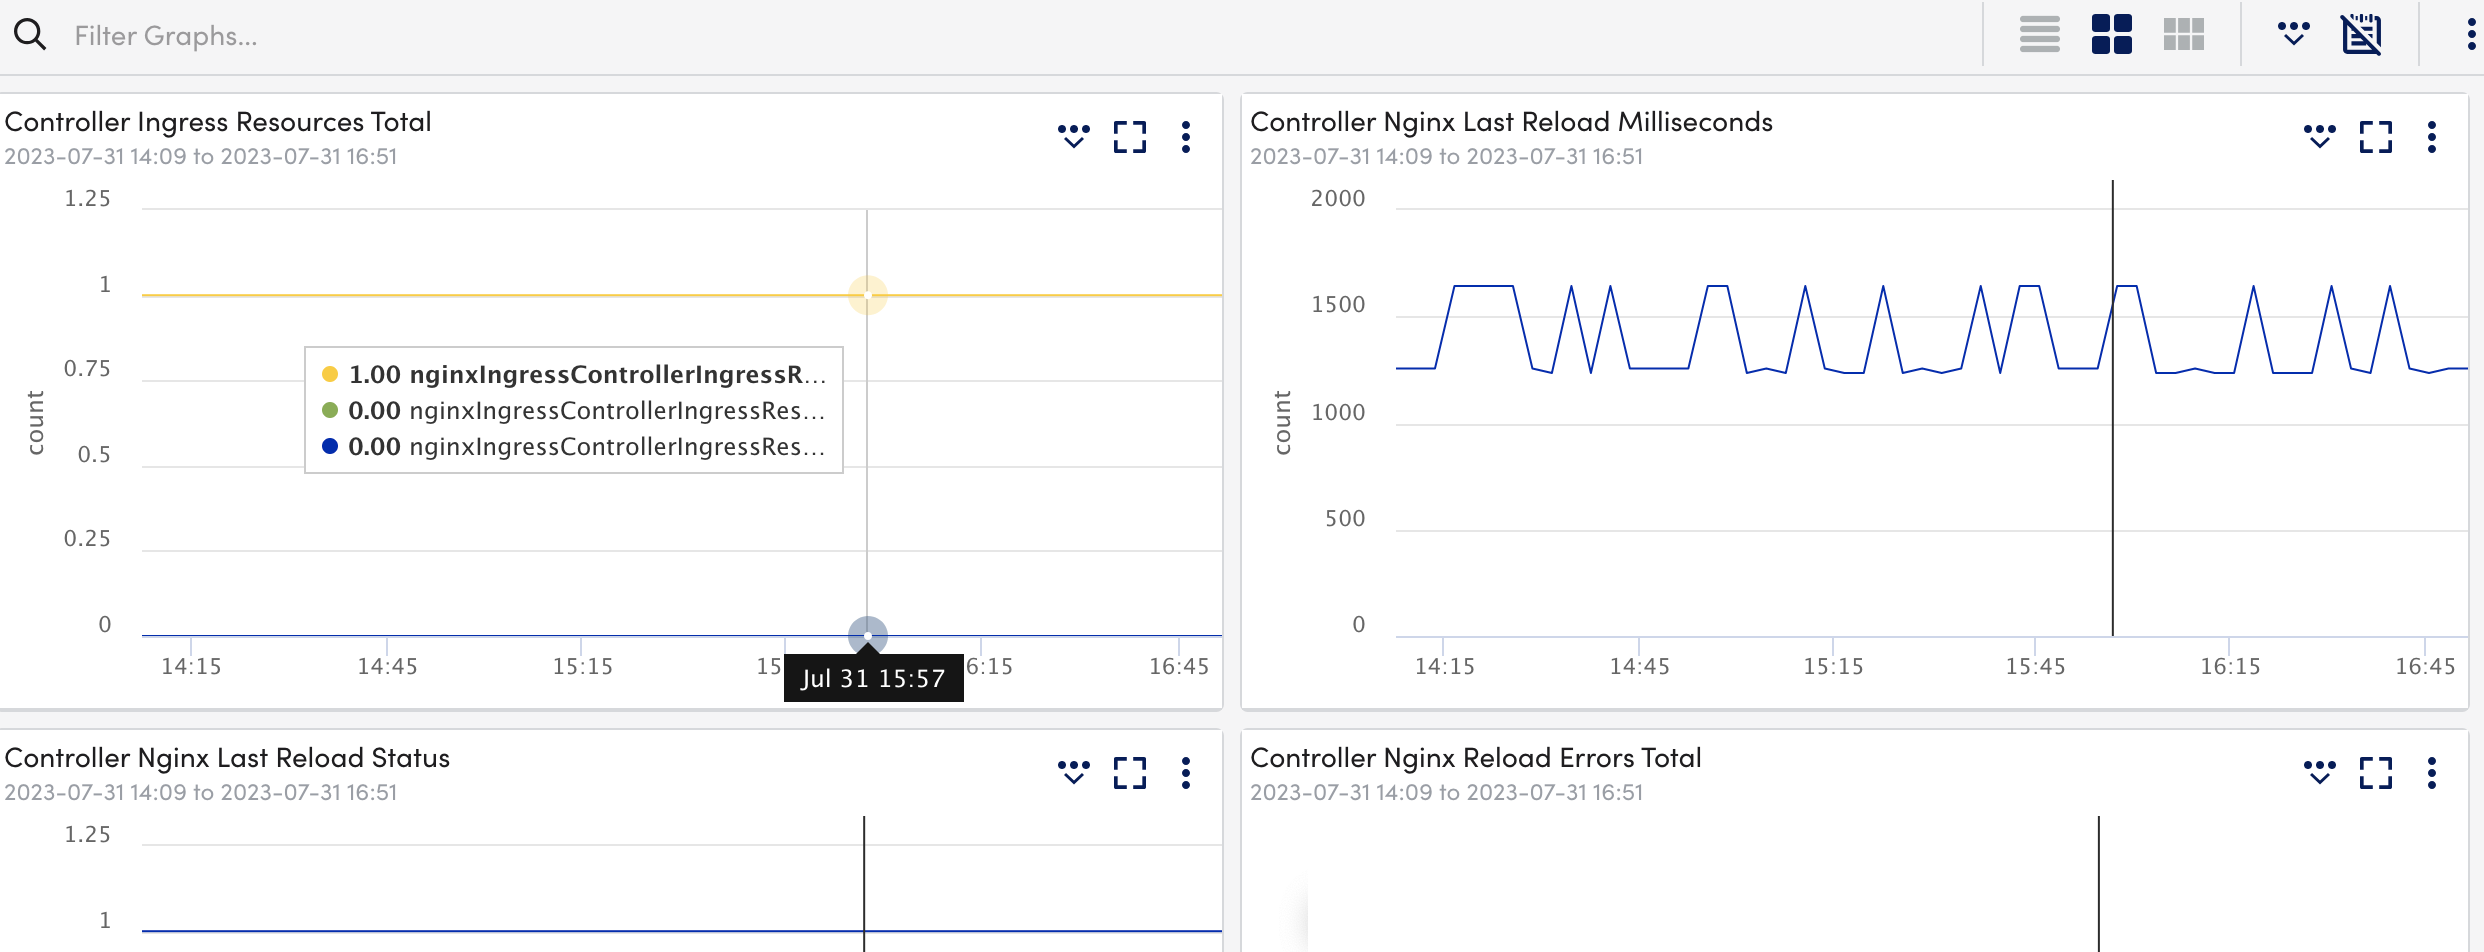
Viewing NGINX Ingress Controller Details
Once you have installed and configured the NGINX Ingress Controller on your server, you can view all the relevant data on the Resources page.
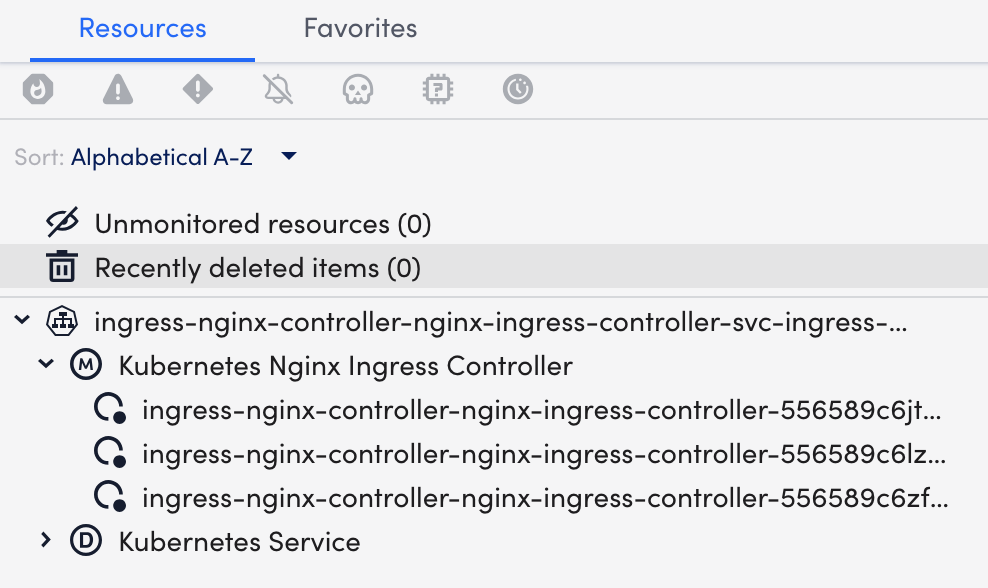
- In LogicMonitor, navigate to Resources > select the required NGINX Ingress Controller service.
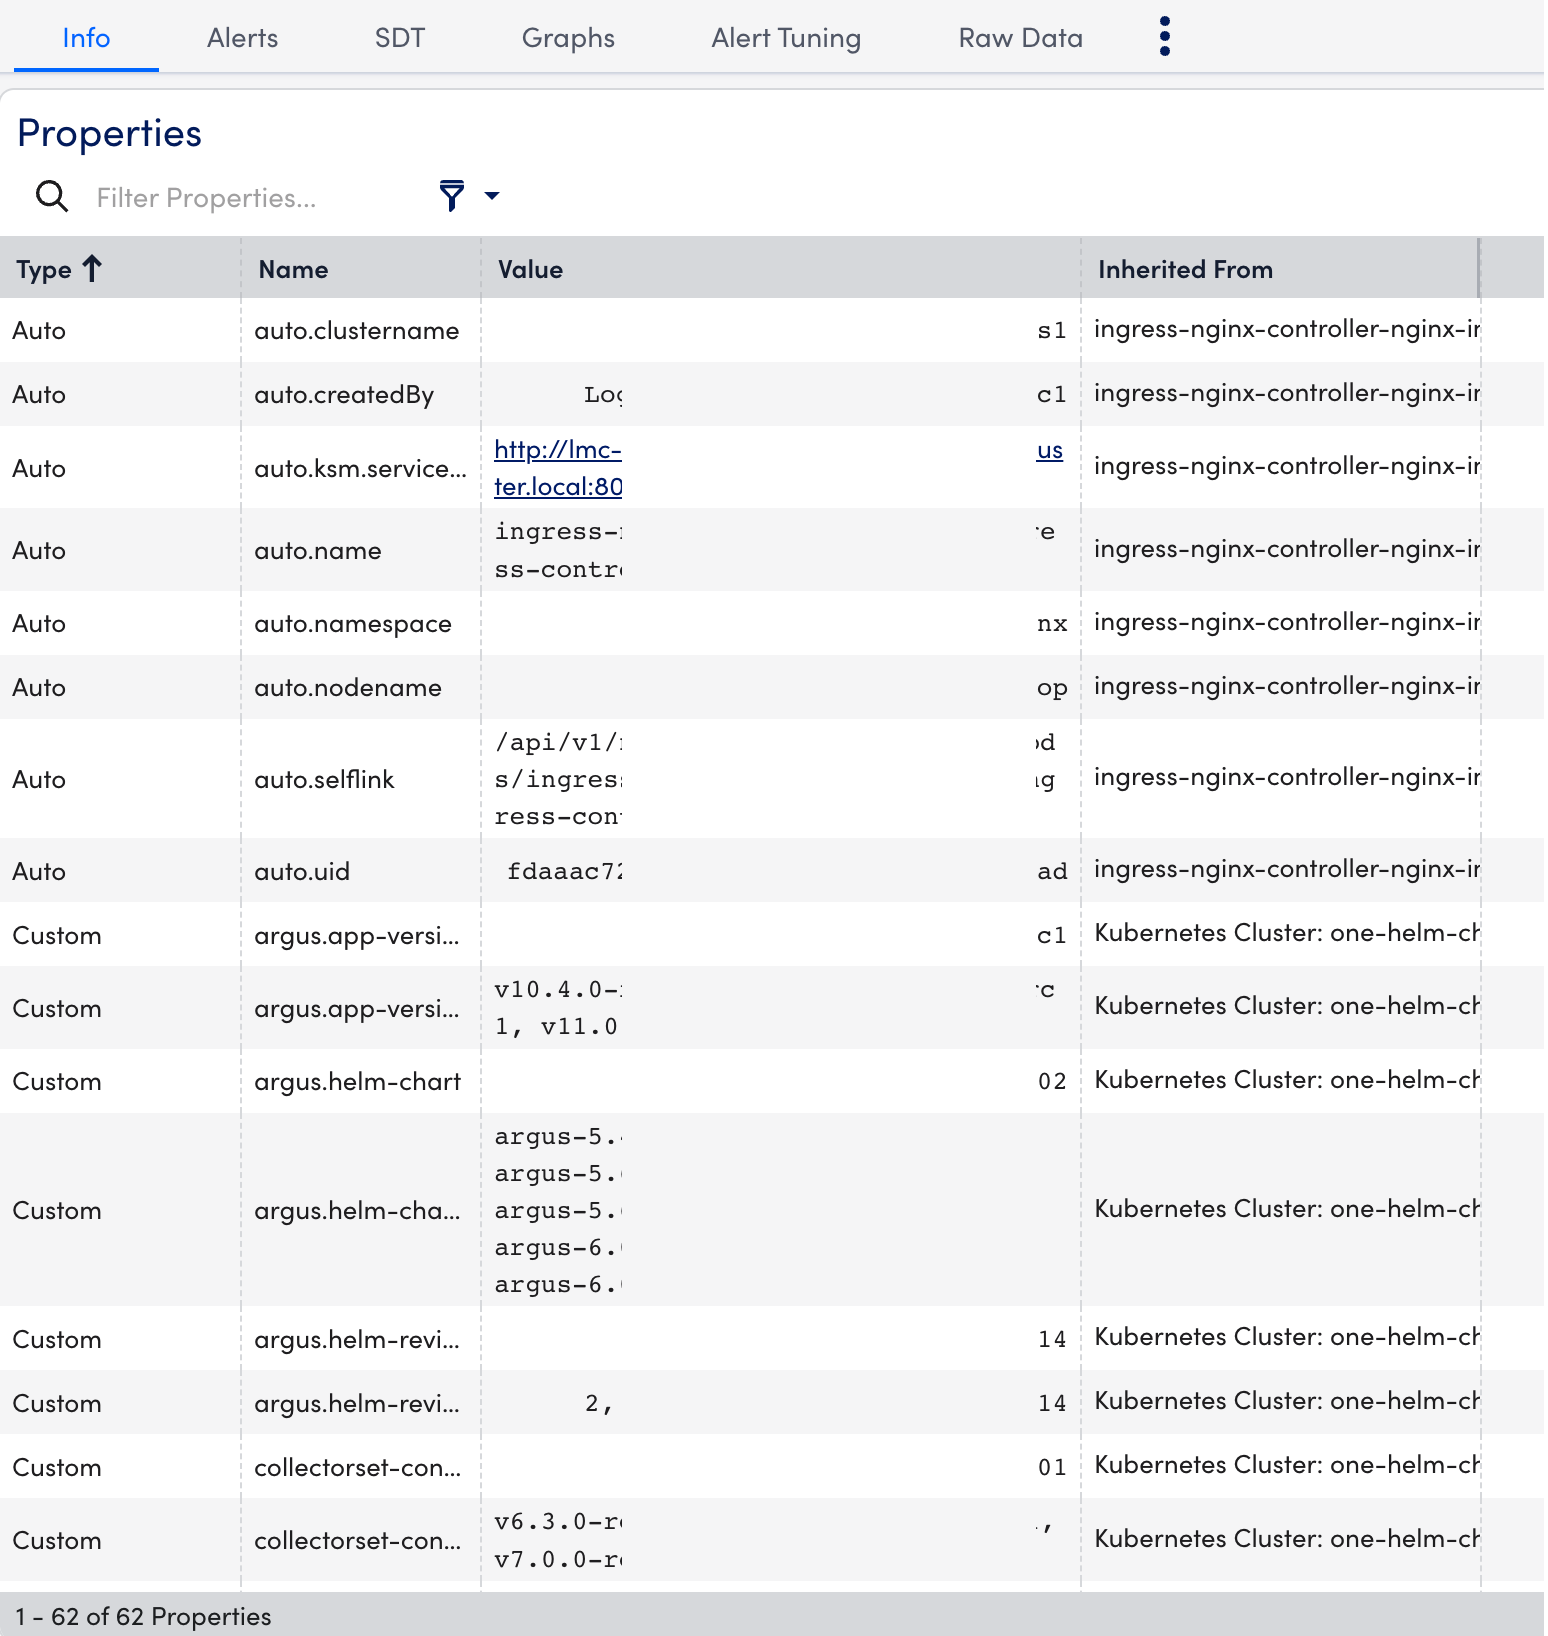
- Select the Info tab to view the different properties of the NGINX Ingress Controller.
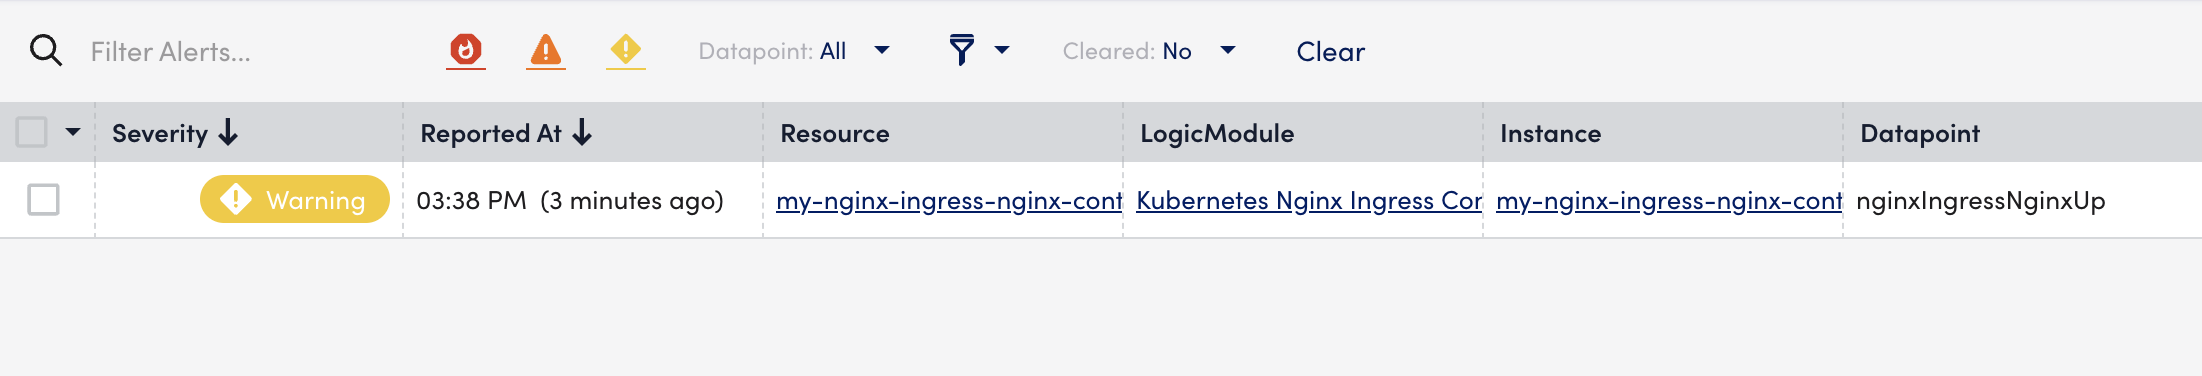
- Select the Alerts tab to view the alerts generated while checking the status of the NGINX Ingress Controller resource.
- Select the Graphs tab to view the status or the details of the NGINX Ingress Controller in the graphical format.
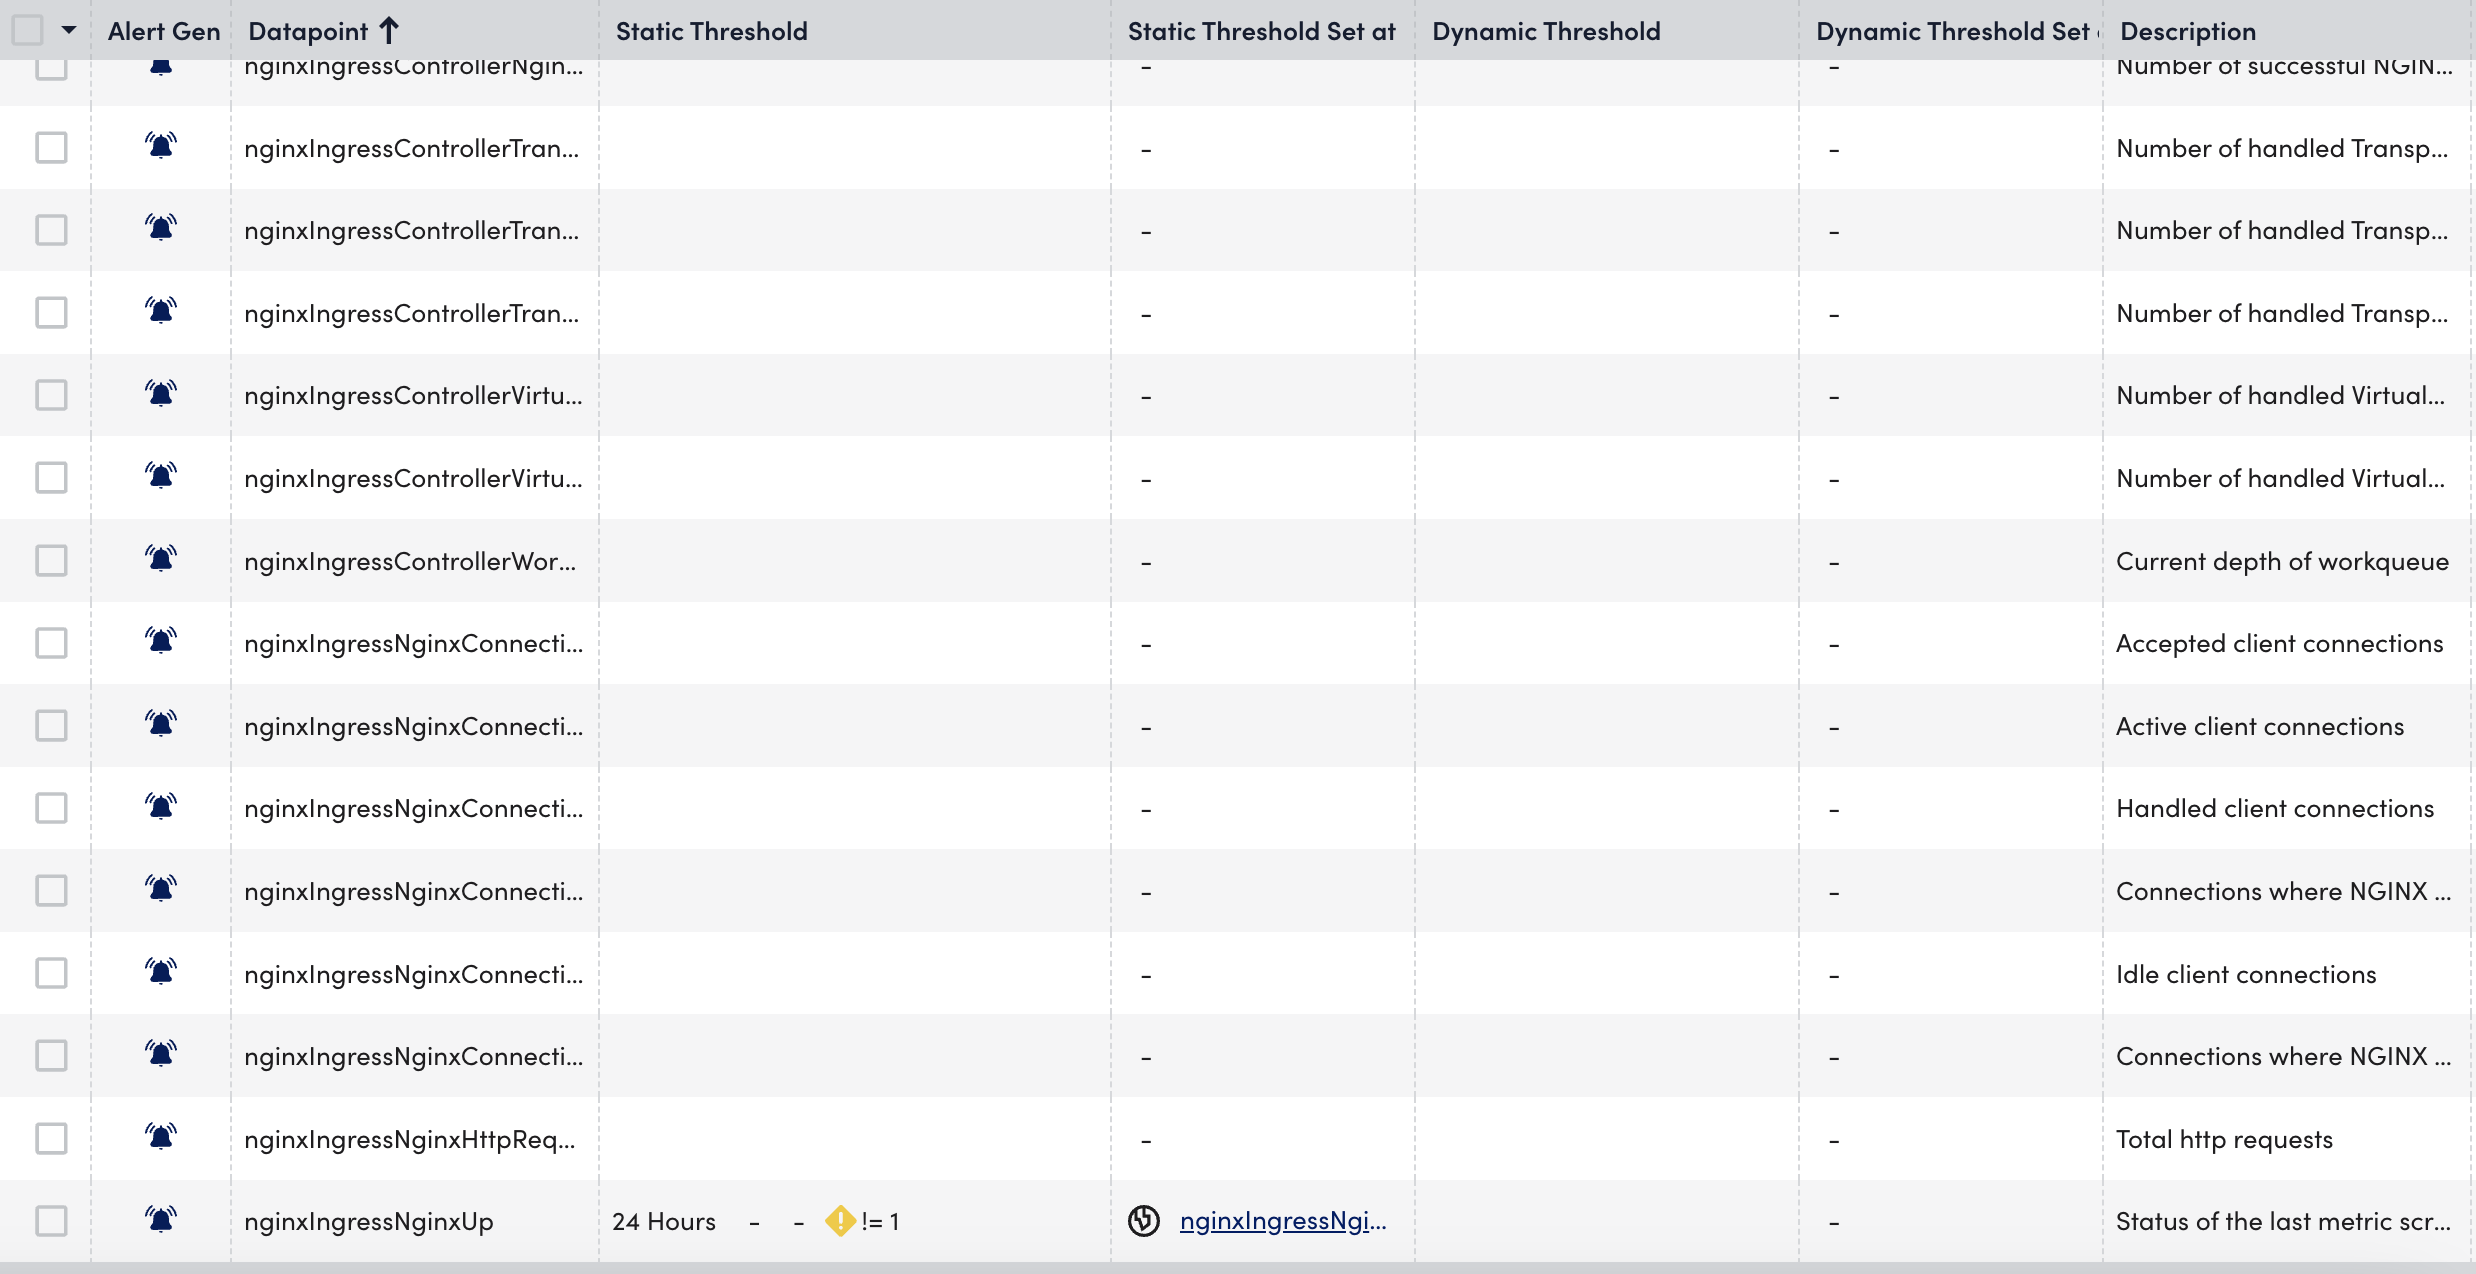
- Select the Alert Tuning tab to view the datapoints on which the alerts are generated.
- Select the Raw Data tab to view all the data returned for the defined instances.