
Alert List Widget
Last updated - 17 March, 2026
The Alert List Widget is a status widget that enables you to pre-filter your alert table for display on a dashboard. The Alert List widget allows you to filter, sort, and arrange alert information for display on your dashboard, similar to the functionality of the Alerts page. Filters and sort orders are preserved allowing you to display the most important information on your dashboard.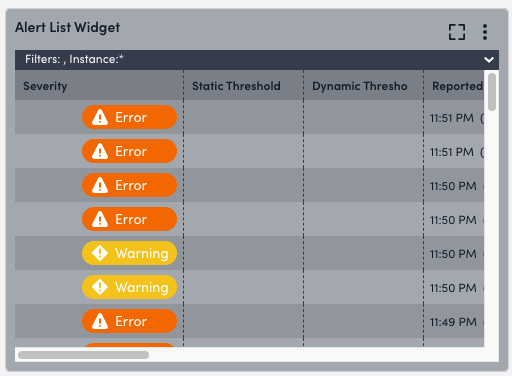
Configuring an Alert List Widget involves configuring display settings that control what information is displayed in the widget and for how long, and building the table that is displayed in the widget. You can add as many Alert List widgets to your dashboard as needed.
Configuring an Alert List Widget
- Create an Alert List widget. For more information, see Widget Creation.
- Configure Basic Information fields. For more information, see Configuring Standard Widget Settings.
- (Optional) Toggle on the following Alert Settings options:
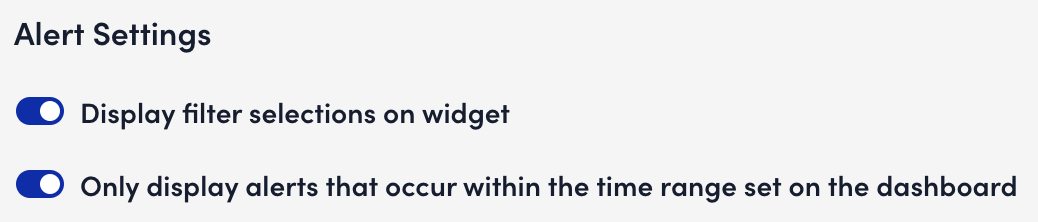
- Display filter selections on widget: View the applied filters at the top of the table in the widget.
Only alerts that match the applied filters will display in the widget. For more information on these filters, which function the same here as they do on the Alerts page, see Managing Alerts from the Alerts Page. - Only Display alerts that occur within the time range set on the dashboard: To hone in on alerts occurring within a specific timeframe. If this setting is not enabled, the time range defaults to the global default time range specified in your user preferences.
- Display filter selections on widget: View the applied filters at the top of the table in the widget.
- In the Filter Alerts section, you can add the following filters:
- Critical Alerts
- Error Alerts
- Warning Alerts
- Add Filters
- Groups
- Resources
- LogicModules
- InstancesNote: The exact match filter like (HTTP-|HTTPS-|Port-|Ping) is not supported for refining the query. You can either manually select the options from the drop-down list or use a glob expression ((172*|192*))*. For more information, Using Glob Expressions Throughout the LogicMonitor Portal.
- In addition, if you have saved a filter query using an exact match filter in the legacy UI, no results will be displayed in the new UI.
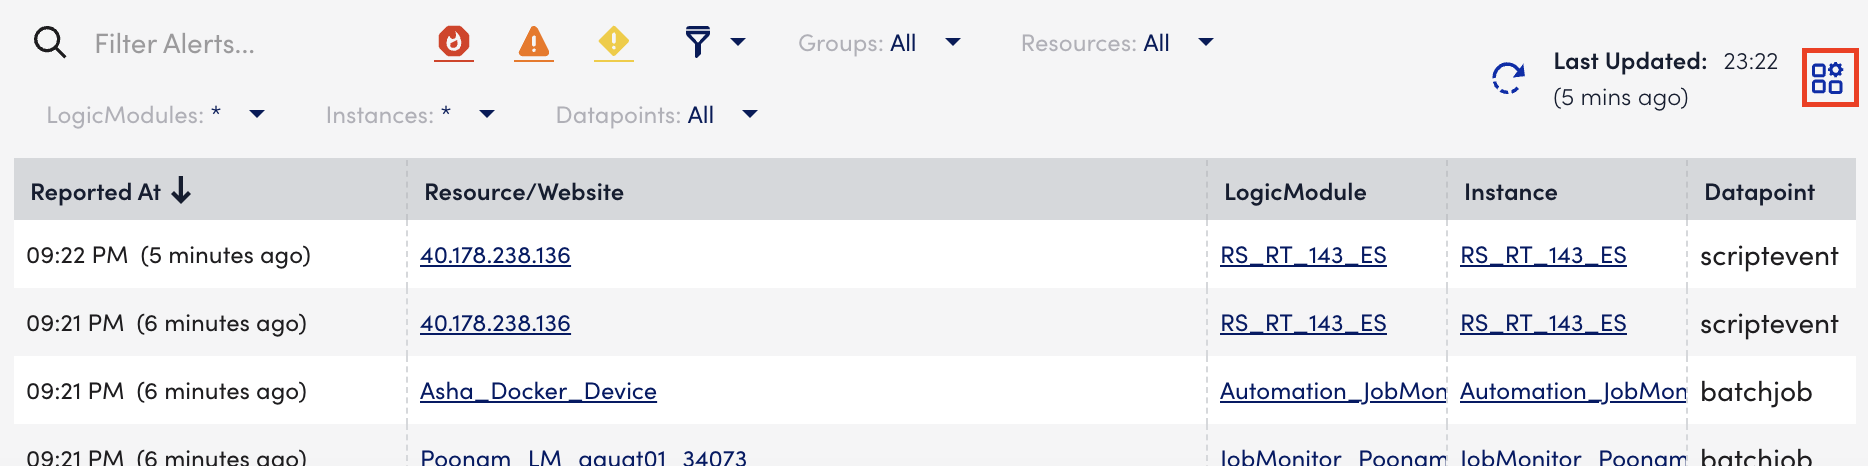
- In the top left corner of the table, select the Tables Settings icon to begin configuring table settings:
- In the Font Size dropdown, select a font size for the table text.
- (Optional) Toggle on Play sound for new alerts, and then select the type of sound to play for each alert level (Critical, Error, Warning).
The sound plays from the Alert List widget when you have the dashboard open.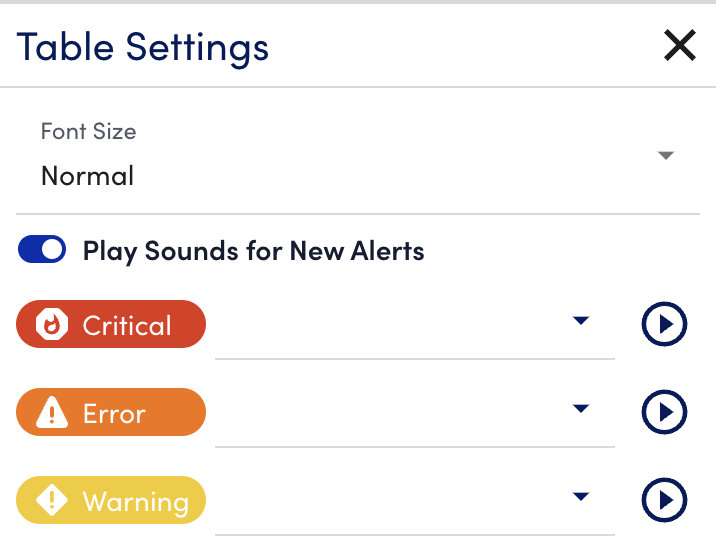
- (Optional) Decide whether to keep just the default columns or to add custom columns to your table. For more information, see Table Settings.
- (Optional) Drag and drop columns in the list to rearrange them.
- (Optional) Select the deactivate (eye) icon next to a column to temporarily deactivate the column.
The column is deactivated but remains available in its current position in the Table Settings list. Reactivate the column at any time.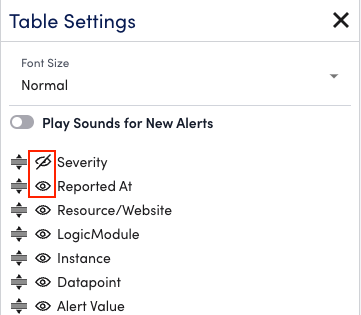
- In the Font Size dropdown, select a font size for the table text.
- (Optional) Toggle on Play sound for new alerts, and then select the type of sound to play for each alert level (Critical, Error, Warning).
The sound plays from the Alert List widget when you have the dashboard open. - (Optional) Decide whether to keep just the default columns or to add custom columns to your table. For more information, see Table Settings.
- (Optional) Drag and drop columns in the list to rearrange them.
- (Optional) Select the deactivate (eye) icon next to a column to temporarily deactivate the column.
The column is deactivated but remains available in its current position in the Table Settings list. Reactivate the column at any time.
- Complete the standard widget configurations, and then Save the widget. For more information, see Configuring Standard Widget Settings.
Table Settings
You can use the Table Settings to choose a font size for the text in the widget and choose from a list of sounds to play for newly triggered alerts. The Table Settings allow you to build the table for your alerts by choosing which columns to display in the widget.
The following are the types of columns displayed in Table Settings:
- LogicMonitor Default Columns: These columns are provided by LogicMonitor and are automatically available to you in the Table Settings column list. Default columns can be deactivated so they are no longer visible in the table widget, but they cannot be removed. You can reactivate the column from the Table Settings at any time.
- Custom Columns: You can add custom columns to the Alerts Table that display the following:
- Properties: Start typing the name of the property whose values you’d like to see for each alert into the Add Custom Column field and matching search results will autogenerate as you type. For more information, see Resource and Instance Properties.
- Tokens: Prepend and append the token name with “##” (for example ##ALERTID##). Token names are not case sensitive (##AlertID## also works). Search results are not autogenerated when typing token names into the Add Custom Column. For more information, see Tokens Available in LogicModule Alert Messages.
Note: Values assigned to the properties listed below will be blurred out in the Alert List table for security reasons:
– Properties with names ending in .pass, .auth, .key, or password
– The snmp.cmmunity, snmp.privtoken, and snmp.authtoken properties
– The aws.accesskey property
Acknowledging Alerts
After you’re finished with creation and configuration, you can acknowledge alerts from the Alert List widget. To acknowledge alerts: Select the row of alert(s) you want to acknowledge, and then select Actions > Add ACK.
For more information on acknowledging alerts, see Acknowledge Alerts.
