
Disclaimer: This content applies to the legacy UI and is no longer maintained. It will be removed at a future time. For up-to-date content, see Datapoint Overview. At the time of removal, you will automatically be redirected to the up-to-date content.
Datapoint Overview
Last updated – 20 February, 2026
Introduction
A datapoint is a piece of data that is collected during monitoring. Every DataSource definition must have at least one configured datapoint that defines what information is to be collected and stored, as well as how to collect, process, and potentially alert on that data.
Normal Datapoints vs. Complex Datapoints
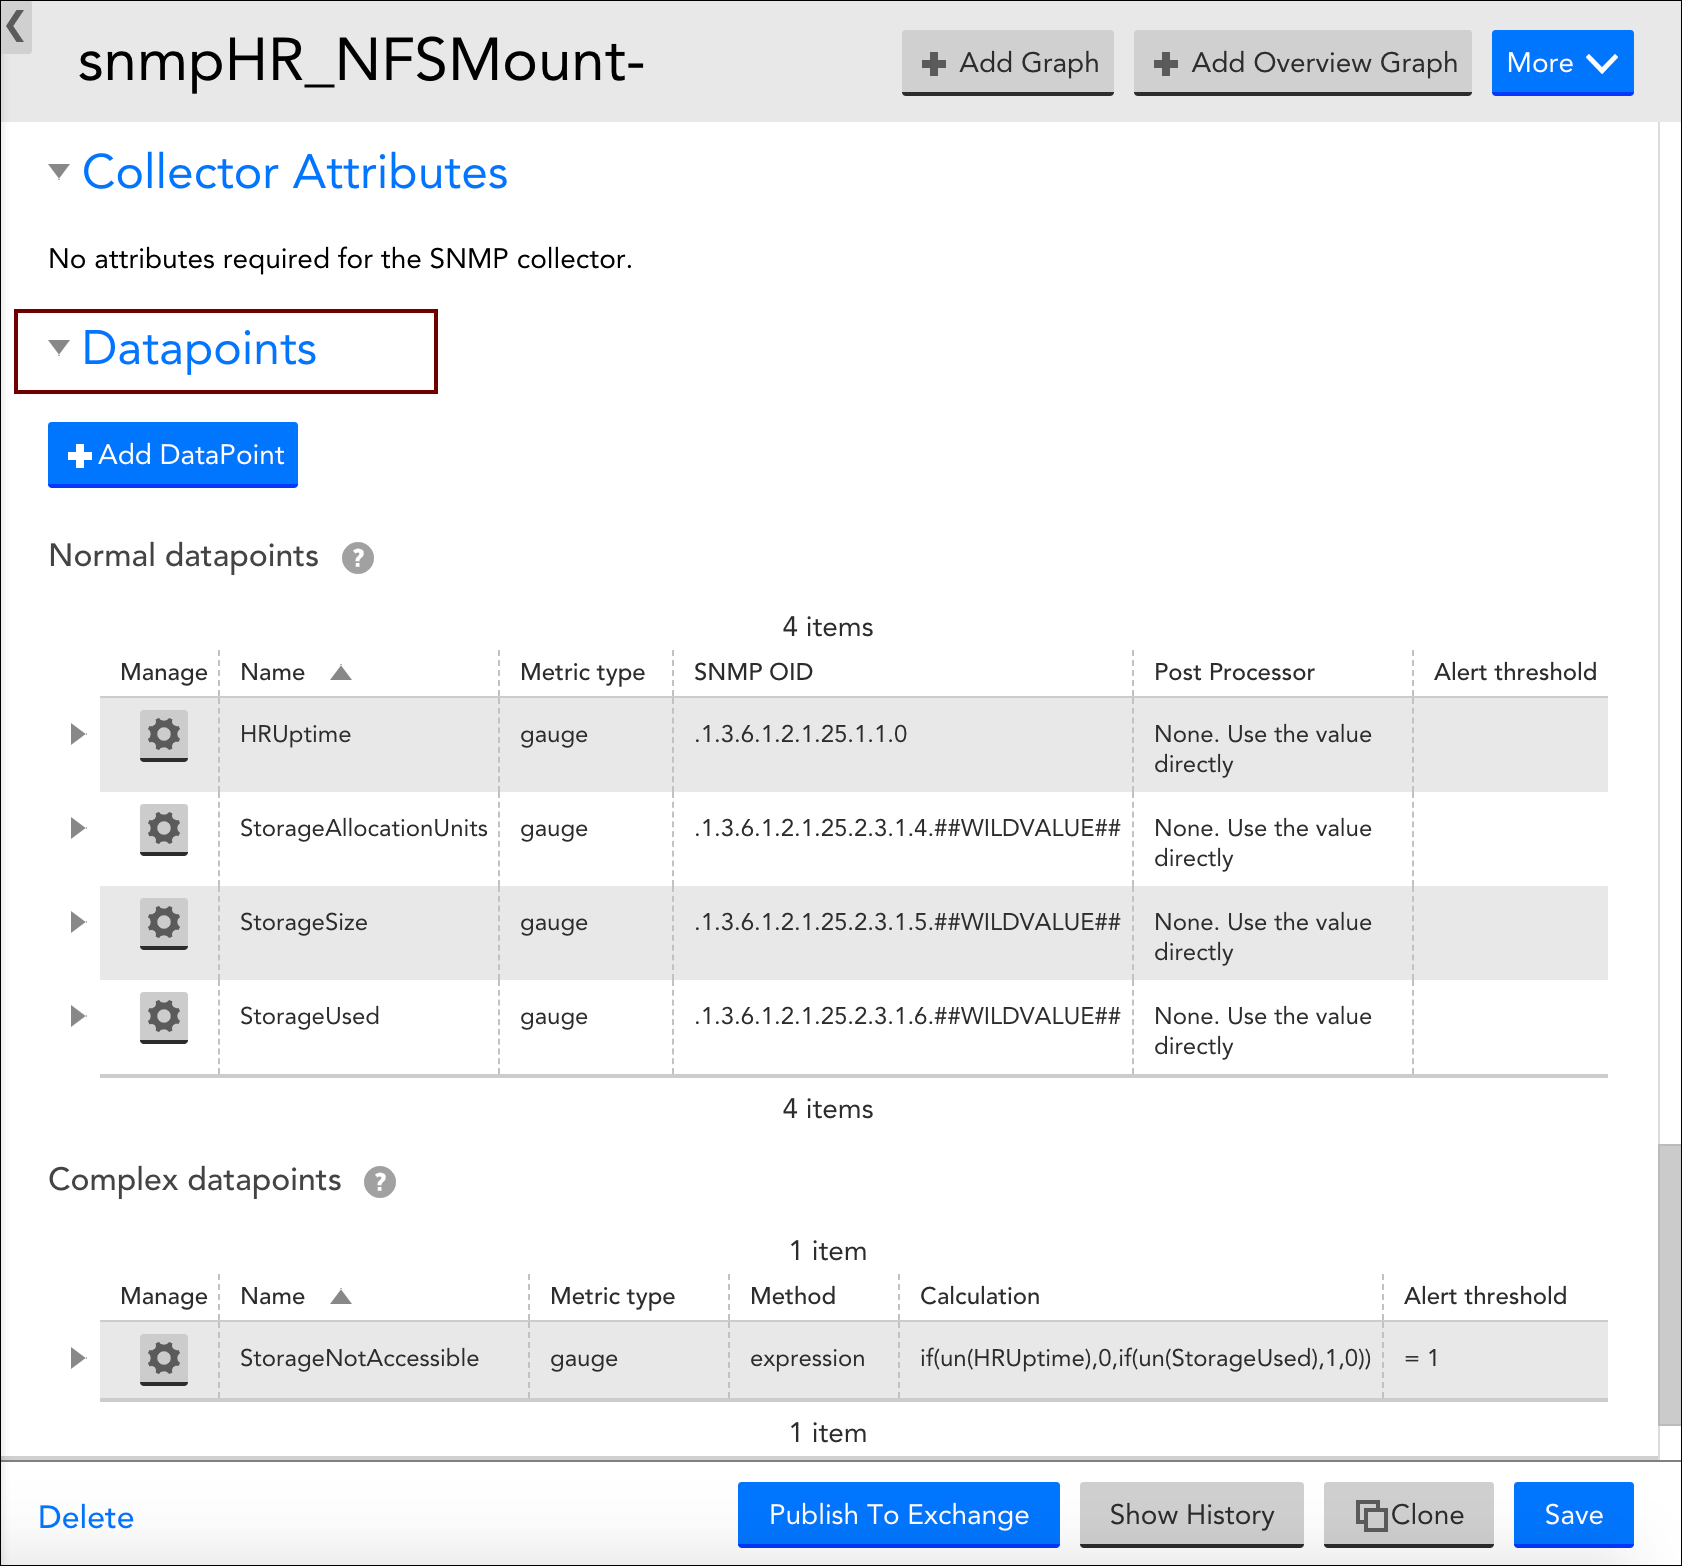
LogicMonitor defines two types of datapoints: normal datapoints and complex datapoints. Normal datapoints represent data you’d like to monitor that can be extracted directly from the raw output collected.
Complex datapoints, on the other hand, represent data that needs to be processed in some way using data not available in the raw output (e.g. using scripts or expressions) before being stored.
For more information on these two types of datapoints, see Normal Datapoints and Complex Datapoints respectively.
Configuring Datapoints
Datapoints are configured as part of the DataSource definition. LogicMonitor does much of the work for you by creating meaningful datapoints for all of its out-of-the-box DataSources. This means that, for the majority of resources you monitor via LogicMonitor, you’ll never need to configure datapoints.
However, there may be occasions where you want to customize an existing DataSource with new or edited datapoints (or are creating a custom DataSource). For these occasions, LogicMonitor does support the creation/editing of datapoints. This is done from the Datapoints area of a DataSource definition (navigate to Settings|DataSources|[DataSource Name]).
When adding a new datapoint or editing an existing datapoint, there are several settings that must be configured. The following three sections categorize these settings according to the type of datapoint being created.
Configurations Common to Normal and Complex Datapoints
Datapoint Type
If you are creating a brand new datapoint, choose whether it is a Normal datapoint or Complex datapoint. These options are only available when creating a new datapoint; existing datapoints cannot have their basic type changed. For more information on the differences between normal and complex datapoints, see the Normal Datapoints vs. Complex Datapoints section of this support article.
Name and Description
Enter the name and description of the datapoint in the Name and Description fields respectively. The name entered here will be displayed in the text of any alert notifications delivered for this datapoint so it is best practice to make the name meaningful (e.g. aborted_clients is meaningful whereas datapoint1 is not as it would not be helpful to receive an alert stating “datapoint1 is over 10 per second”.
Note: To ensure successful DataSource creation and updates for aggregate tracked queries, do not use reserved keywords as metric names.
A metric name (referred to as a datapoint name) is the identifier for a metric extracted from your log query, such as “events”, “anomalies”, or “avg_latency_ms”. Each metric from your logs becomes a datapoint within the created DataSource.
The following reserved keywords must not be used as datapoint names:
SIN, COS, LOG, EXP, FLOOR, CEIL, ROUND, POW, ABS, SQRT, RANDOM
LT, LE, GT, GE, EQ, NE, IF, MIN, MAX, LIMIT, DUP, EXC, POP
UN, UNKN, NOW, TIME, PI, E, AND, OR, XOR, INF, NEGINF, STEP
YEAR, MONTH, DATE, HOUR, MINUTE, SECOND, WEEK, SIGN, RND, SUM2
AVG2, PERCENT, RAWPERCENTILE, IN, NANTOZERO, MIN2, MAX2
Also, Tracked query names should follow the same guidelines as datasource display names. For more information, see Datasource Style Guidelines.
Note: Datapoint names cannot include any of the operators or comparison functions used in datapoint expressions, as listed in Complex Datapoints.
Valid Value Range
If defined, any data reported for this datapoint must fall within the minimum and maximum values entered for the Valid value range field. If data does not fall within the valid value range, it is rejected and “No Data” will be stored in place of the data. As discussed in the Alerting on Datapoints section of this support article, you can set alerts for this No Data condition.
The valid value range functions as a data normalization field to filter outliers and incorrect datapoint calculations. As discussed in Normal Datapoints, it is especially helpful when dealing with datapoints that have been assigned a metric type of counter.
Alert Settings
Once datapoints are identified, they can be used to trigger alerts. These alert settings are common across all types of datapoints and are discussed in detail in the Alerting on Datapoints section of this support article.
Configurations Exclusive to Normal Datapoints
The configurations you need to complete for normal datapoints are highly dependent on the type of collection method being used by the DataSource (as determined by the Collector field, see Creating a DataSource).
For example, the Metric Type and Interpret output with fields are available when using the SNMP and WMI data collection methods, but not when evaluating returned status codes using the script or webpage method. For more information on these fields, see Normal Datapoints.
In addition, there is a field (or set of options) that specify what raw output should be collected, but the wording for these fields/options dynamically changes, also dependent upon the collection method being used. For example, this field is titled WMI CLASS attribute when defining datapoints collected via WMI and OID when defining datapoints collected via SNMP. Similarly, if defining datapoints collected via JMX, the fields MBean object and MBean attribute display. And to provide one more example, if defining datapoints collected via script or batchscript, a listing of script source data options displays. For more information on configuring this dynamic raw output field, see the individual support articles available in our Data Collection Methods topic.
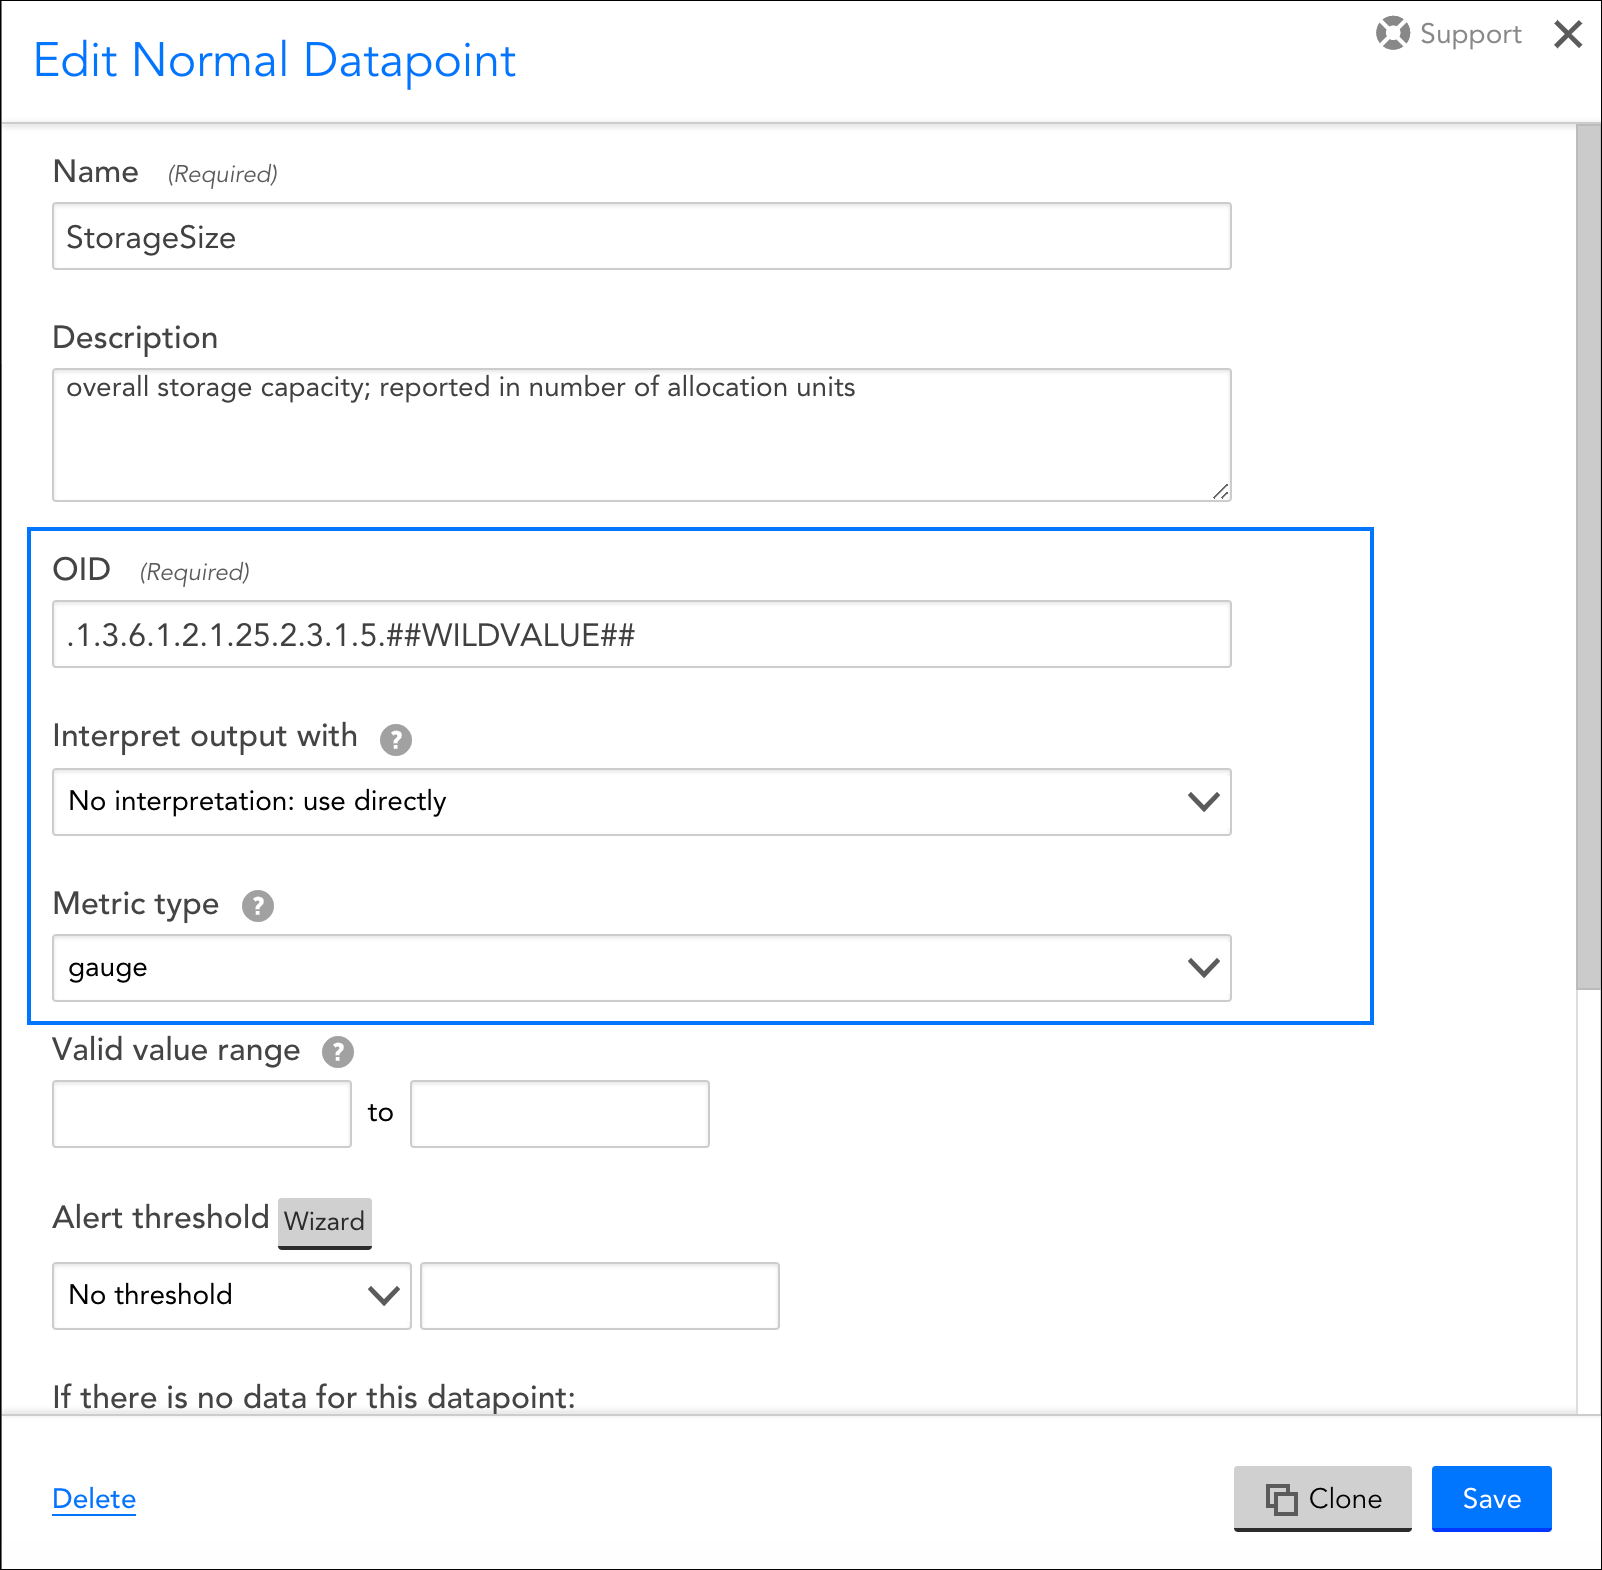
These datapoint configurations display for DataSources that use an SNMP collection method, but for other types of collection methods (e.g. WMI, script, JMX, etc.), a different set of configurations displays.
Configurations Exclusive to Complex Datapoints
Method
If you are constructing your complex datapoint as an expression that is based on existing normal datapoints or resource properties (called a standard complex datapoint), select “Use an expression (infix or rpn) to calculate the value” from the Method field’s dropdown menu.
If you need to process the raw collected data in a more sophisticated way that cannot be achieved by manipulating the normal datapoints or assigned resource properties, select “Use groovy script to calculate the value” from the Method field’s dropdown menu. This is called a Groovy complex datapoint.
For more information on these two methods for building complex datapoints, along with sample expressions and Groovy scripts, see Complex Datapoints.
Expression/Groovy Source Code
If the “Use an expression (infix or rpn) to calculate the value” option was chosen from the Method field’s dropdown menu, enter the expression for your standard complex datapoint in the Expression field.
If the “Use groovy script to calculate the value” option was chosen, enter the Groovy script that will be used to process the datapoint in the Groovy Source Code field.
For more information on building complex datapoints using expressions and Groovy scripts, see Complex Datapoints.
Alerting on Datapoints
Once datapoints are configured, they can be used to trigger alerts when data collected exceeds the threshold(s) you’ve specified, or when there is an absence of expected data. When creating or editing a datapoint from the Add/Edit Datapoint dialog, which is available for display from the Datapoints area of the DataSource definition, you can configure several alert settings per datapoint, including the value(s) that signify alert conditions, alert trigger and clear intervals, and the message text that should be used when alert notifications are routed for the datapoint.
Thresholds
Datapoint alerts are based on thresholds. When the value returned by a datapoint exceeds a configured threshold, an alert is triggered. There are two types of thresholds that can be set for datapoints: static thresholds and dynamic thresholds. These two types of thresholds can be used independently of one another or in conjunction with one another.
Static Thresholds
A static threshold is a manually assigned expression or value that, when exceeded in some way, triggers an alert. To configure one or more static thresholds for a datapoint, click the Wizard button located to the right of the Alert Threshold field. For detailed information on this wizard and the configurations it supports, see Tuning Static Thresholds for Datapoints.
Note: When setting static thresholds from the DataSource definition, you are setting them globally for all resources in your network infrastructure (i.e. every single instance to which the DataSource could possibly be applied). As discussed in Tuning Static Thresholds for Datapoints, it is possible to override these global thresholds on a per-resource or -instance level.
Dynamic Thresholds
Dynamic thresholds represent the bounds of an expected data range for a particular datapoint. Unlike static datapoint thresholds which are assigned manually, dynamic thresholds are calculated by anomaly detection algorithms and continuously trained by a datapoint’s recent historical values.
When dynamic thresholds are enabled for a datapoint, alerts are dynamically generated when these thresholds are exceeded. In other words, alerts are generated when anomalous values are detected.
To configure one or more dynamic thresholds for a datapoint, toggle the Dynamic Thresholds slider to the right. For detailed information on configuring dynamic threshold settings, see Enabling Dynamic Thresholds for Datapoints.
Note: When setting dynamic thresholds from the DataSource definition, you are setting them globally for all resources in your network infrastructure (i.e. every single instance to which the DataSource could possibly be applied). As discussed in Enabling Dynamic Thresholds for Datapoints, it is possible to override these global thresholds on a per-resource or -instance level.
No Data Alerting
By default, alerts will not be triggered if no data can be collected for a datapoint (or if a datapoint value falls outside of the range set in the Value Valid Range field). However, if you would like to receive alerts when no data is collected, called No Data alerts, you can override this default. To do so, select the severity of alert that should be triggered from the If there is no data for this datapoint field’s drop-down menu.
While it’s possible to configure No Data alerts for datapoints that have thresholds assigned (static or dynamic), it is not necessarily best practice. For example, it’s likely you will want different alert messages for these scenarios, as well as different trigger and clear intervals. For these reasons, consider setting the No Data alert on a datapoint that has no thresholds in place so that you can customize the alert’s message, as well as its trigger and clear intervals as appropriate for a no data condition.
In most cases, you can choose to set a No Data alert on any datapoint on the DataSource as it is usually not just one specific datapoint that will reflect a no data condition. Rather, all datapoints will reflect this condition as it is typically the result of the entire protocol (e.g. WMI, SNMP, JDBC, etc.) not responding.
Alert Trigger Interval
The Alert trigger interval (consecutive polls) field defines the number of consecutive collection intervals for which an alert condition must exist before an alert is triggered. The length of one collection interval is determined by the DataSource’s Collect every field, as discussed in Creating a DataSource.
The field’s default value of “Trigger alert immediately” will trigger an alert as soon as the datapoint value (or lack of value if No Data alerting is enabled) satisfies an alert condition.
Setting the alert trigger interval to a higher value helps ensure that a datapoint’s alert condition is persistent for at least two data polls before an alert is triggered. The options available from the Alert trigger interval (consecutive polls) field’s dropdown are based on 0 as a starting point, with “Trigger alert immediately” essentially representing “0”. A value of “1” then, for example, would trigger an alert upon the first consecutive poll (or second poll) that returns a valid value outside of the thresholds. By using the schedule that defines how frequently the DataSource collects data in combination with the alert trigger interval, you can balance alerting on a per-datapoint basis between immediate notification of a critical alert state or quieting of alerting on known transitory conditions.
Each time a datapoint value doesn’t exceed the threshold, the consecutive polling count is reset. But it’s important to note that the consecutive polling count is also reset if the returned value transitions into the territory of a higher severity level threshold. For example, consider a datapoint with thresholds set for warning and critical conditions with an alert trigger interval of three consecutive polls. If the datapoint returns values above the warning threshold for two consecutive polls, but the third poll returns a value above the critical threshold, the count is reset. If the critical condition is sustained for the next two polls (for a total of three polls) a critical alert is what is ultimately generated.
Note: If “No Data” is returned, the alert trigger interval count is reset.
Note: The alert trigger interval set in the Alert trigger interval (consecutive polls) field only applies to alerts triggered by static thresholds. Alerts triggered by dynamic thresholds use a dedicated interval that is set as part of the dynamic threshold’s advanced configurations. See Enabling Dynamic Thresholds for Datapoints for more information.
Alert Clear Interval
The Alert clear interval (consecutive polls) field defines the number of consecutive collection intervals for which an alert condition must not be present before the alert is automatically cleared. The length of one collection interval is determined by the DataSource’s Collect every field, as discussed in Creating a DataSource.
The field’s default value of “Clear alert immediately” will automatically clear as soon as the datapoint value no longer satisfies the alert criteria.
As with the alert trigger interval, the options available from the Alert clear interval (consecutive polls) field’s dropdown are based on 0 as a starting point, with “Clear alert immediately” essentially representing “0”. Setting the alert clear interval to a higher value helps ensure that a datapoint’s value is persistent (i.e. has stabilized) before an alert is automatically cleared. This can prevent the triggering of new alerts for the same condition.
Note: If “No Data” is returned, the alert clear interval count is reset.
Note: The alert clear interval established here is used to clear alerts triggered by both static and dynamic thresholds.
Alert Message
If the “Use default templates” option is selected from the Alert message field’s dropdown menu, alert notifications for the datapoint will use the global DataSource alert message template that is defined in your settings. For more information on global alert message templates, see Alert Messages.
However, as best practice, it is recommended that any datapoint with thresholds defined have a custom alert message that formats the relevant information in the alert, and provides context and recommended actions. LogicMonitor’s out-of-the-box DataSources will typically already feature custom alert messages for datapoints with thresholds defined.
To add a custom alert message, select “Customized” from the Alert message field’s dropdown and enter notification text for the Subject and Description fields that dynamically appear. As discussed in Tokens Available in LogicModule Alert Messages, you can use any available DataSource tokens in your alert message.
