
Dynamic Thresholds for Datapoints
Last updated - 03 November, 2025
Dynamic thresholds represent the bounds of an expected data range for a particular datapoint. Unlike static datapoint threshold which are assigned manually, dynamic thresholds are calculated by anomaly detection algorithms and continuously trained by a datapoint’s recent historical values. For more information, see Static Datapoint Thresholds.
When dynamic thresholds are enabled for a datapoint, alerts are dynamically generated when these thresholds are exceeded. In other words, alerts are generated when anomalous values are detected.
Dynamic thresholds detect the following types of data patterns:
- Anomalies
- Rates of change
- Seasonality (daily/weekly) trends
Dynamic thresholds (and their resulting alerts) are automatically and algorithmically determined based on the history of a datapoint, they are well suited for datapoints where static thresholds are hard to identify (such as when monitoring number of connections, latency, and so on) or where acceptable datapoint values aren’t necessarily uniform across an environment.
For example, consider an organization that has optimized its infrastructure so that some of its servers are intentionally highly utilized at 90% CPU. This utilization rate runs afoul of LogicMonitor’s default static CPU thresholds which typically consider ~80% CPU (or greater) to be an alert condition. The organization could take the time to customize the static thresholds in place for its highly-utilized servers to avoid unwanted alert noise or, alternately, it could globally enable dynamic thresholds for the CPU metric. With dynamic thresholds enabled, alerting occurs only when anomalous values are detected, allowing differing consumption patterns to coexist across servers.
For situations like this one, in which it is more meaningful to determine if a returned metric is anomalous, dynamic thresholds have tremendous value. Not only will they trigger more accurate alerts, but in many cases issues are caught sooner. In addition, administrative effort is reduced considerably because dynamic thresholds require neither manual upfront configuration nor ongoing tuning.
Training Dynamic Thresholds
Dynamic thresholds require a minimum of 5 hours of training data for DataSources with polling intervals of 15 minutes or less. As more data is collected, the algorithm is continuously refined, using up to 15 days of recent historical data to inform its expected data range calculations.
Daily and weekly trends also factor into dynamic threshold calculations. For example, a load balancer with high traffic volumes Monday through Friday, but significantly decreased volumes on Saturdays and Sundays, will have expected data ranges that adjust accordingly between the workweek and weekends. Similarly, dynamic thresholds would also take into account high volumes of traffic in the morning as compared to the evening. A minimum of 2.5 days of training data is required to detect daily trends and a minimum of 9 days of data is required to detect weekly trends
Requirements for Adding Dynamic Thresholds
To add threshold values, you need the following:
- A user with the “Threshold” and “Manage” permissions set at the Resource group level.
- If your environment leverages Access Groups for modules, the user must have the “Resources: Group Threshold” permission set.
Adding Dynamic Thresholds at Global DataSource Definition Level
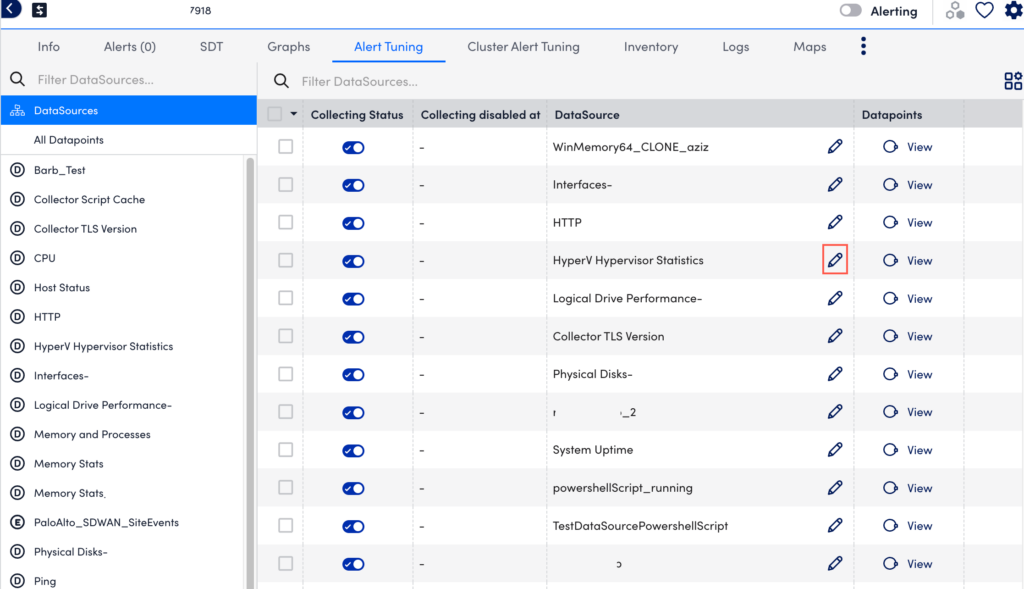
- In LogicMonitor, navigate to Resources Tree > Resources.
- Select the Alert Tuning tab, and then select a specific datapoint from the dataSource table to edit that dataSource definition in a new tab.
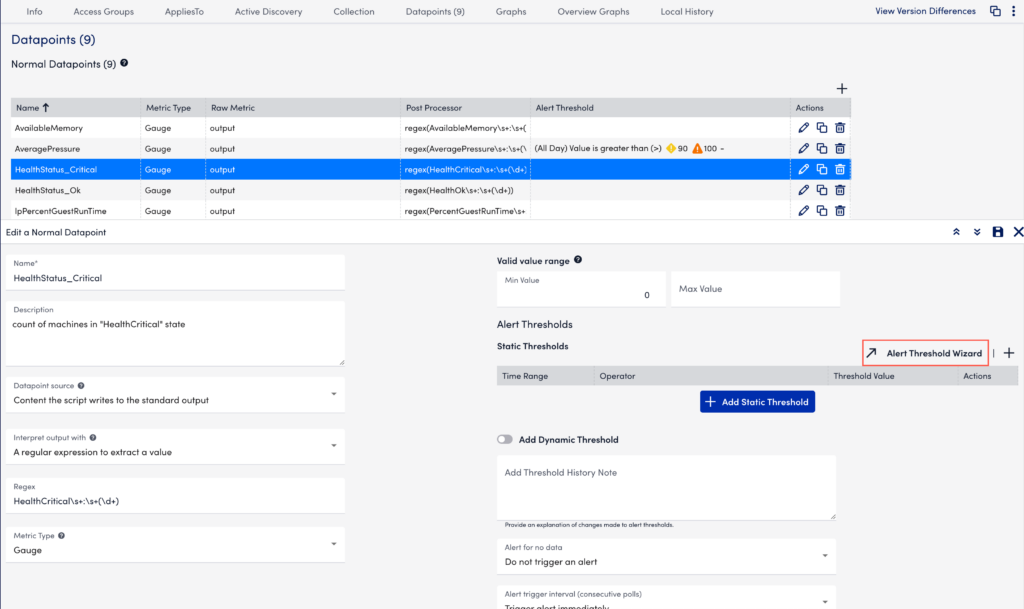
- In the DataSource definition page, select the Datapoints tab.
- In the Datapoints section, under the Action column of your required Normal or Complex Datapoint table, select
 .
. - In the details panel, under the Dynamic Thresholds section, select Alert Threshold Wizard. You can alternately toggle enable Add Dynamic Threshold to add your dynamic threshold.
- In the Global Datapoint Threshold modal, select the time range from the From and To dropdown menus.
Multiple sets of thresholds can only exist at the same level if they specify different time frames.enab - In the When field, select a comparison method as follows:
- Value—Compares the datapoint value against a threshold
- Delta—Compares the delta between the current and previous datapoint value against a threshold
- NaNDelta—Operates the same as delta, but treats NaN values as 0
- Absolute value—Compares the absolute value of the datapoint against a threshold
- Absolute delta—Compares the absolute value of the delta between the current and previous datapoint values against a threshold
- Absolute NaNDelta—Operates the same as absolute delta, but treats NaN values as 0
- Absolute delta%—Compares the absolute value of the percent change between the current and previous datapoint values against a threshold
- Select a comparison operation (For example, >(Greater Than), =(Eqaul To), and so on).
- Enter one or multiple severity levels with your required values to trigger that alert severity. If you add the same threshold value to more than one severity level, the higher severity level takes precedence.
For example, if you set both the warning and error severity level thresholds at 100, then a datapoint value of 100 will trigger an error alert. If the datapoint value jumps from a lower severity level to a higher severity level, the alert trigger interval count (the number of consecutive collection intervals for which an alert condition must exist before an alert is triggered) is reset. For more information, see Datapoint Overview. - Select Save to close the Global Datapoint Threshold modal.
- In the Add Threshold History Note input field, enter the required update.
- From the Alert for no data dropdown menu, select your required alert severity option.
- From the Alert trigger interval (consecutive polls) dropdown menu, select your required alert trigger interval value.
- From the Alert clear interval (consecutive polls) dropdown menu, select your required alert clearing interval value.
- From the Alert Message dropdown menu, select the required alert template.
- Select Save to apply the settings.
Adding Dynamic Thresholds at Instance, Instance Group, Resource Group, and Resource DataSource Level
- In LogicMonitor, navigate to Resources Tree > Resources.
- Select the level where you want to add the static threshold.
For more information, see Different Levels for Enabling Alert Thresholds. - Select the Alert Tuning tab, and then select the required row from the datapoint table.
- In the details panel, select the Threshold tab.
Select Add a Threshold and select Dynamic Threshold.
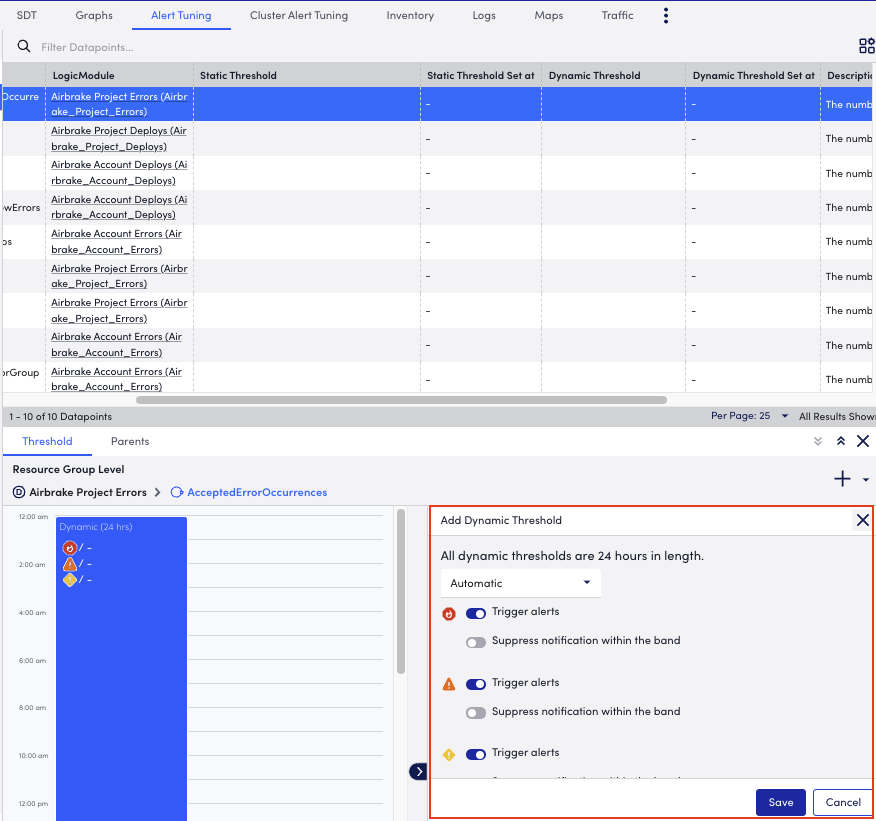
- In the Add Dynamic Threshold section of the details panel, select the alerts that must be triggered or suppressed.
Threshold priority is represented from right to left in the modal or from left to right in the composite string. - (Optional) Select Manual from the dropdown menu to set specify the criteria when you want to trigger an alert and add the number of consecutive intervals after which a warning, error, or critical alert must be sent.
- Select Save to apply the settings.
