
Advanced Metrics Widget
Last updated – 28 April, 2026
You can use the Advanced Metrics widget to display an aggregation of metrics across multiple DataSources and visually represent the data similar to a Custom Graph widget, Big Number widget, Pie Chart widget, or a Gauge widget. The enhanced flexibility provided by the Advanced Metrics widget’s visualization options enables you to more effectively highlight the data most relevant to identifying root causes, prioritizing alerts, and reducing time to resolution.

The Advanced Metrics widget leverages LogicMonitor Query Language (LMQL) to query for the data you want to visually represent in the widget. You can use LMQL to build structured queries that combine multiple datapoints in a single query, and then filter data using any property. LMQL also supports the advanced aggregation of data directly in your queries.
When you configure an Advanced Metrics widget, you build the query you want to use and then choose the visualization option you want the returned query displayed in. LogicMonitor includes a Query Builder that provides you with a structured method for building your query. The Query Builder provides the base properties (for example, a resource or an instance) and the applicable values that you can choose to include in the query. You can also add additional property filters and values, and the query functions to perform the operations on your data.
Note: Only resource properties are supported in the additional filters.
Alternatively, you can create your query as a raw query directly in the widget configuration settings. This method enables you to leverage dashboard-level or parent dashboard group level tokens in your raw query string.
Note: The Query Builder does not contain all the functionality that creating a raw query offers. For a full reference on LMQL, including all functionality available when creating a raw query, see LogicMonitor Query Language (LMQL) Reference for Advanced Metrics Widget.
Requirements for Configuring an Advanced Metrics Widget
To leverage dashboard-level or parent dashboard group level tokens in the raw query string, you must have available tokens. For more information, see Dashboard Tokens and Dashboard Creation.
Configuring an Advanced Metrics Widget
- In LogicMonitor, navigate to Dashboards, select a current Dashboard or create new, and then add an Advanced Metrics widget.
For more information, see Dashboard Creation.
For more information, see Widget Creation.
- Configure the Basic Information settings.
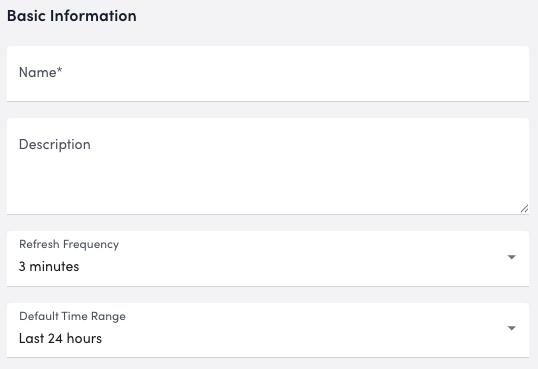
For more information, see Configuring Standard Widget Settings. - Create the query for the data you want to represent in the widget by doing one of the following:
- To create the query using the built-in query builder, select Query Builder and do the following:
- In the Filter by field, use the base properties available to build your query.
LogicMonitor provides Resource, DataSource, Instance, and Datapoint as base properties to build your query.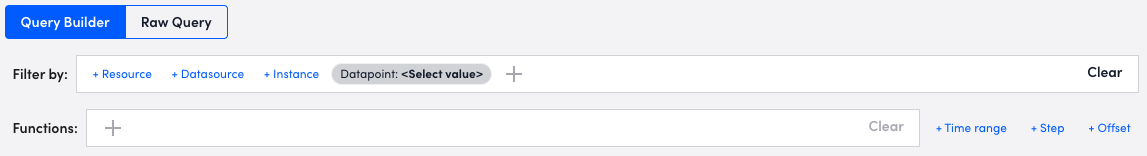
- In the Filter by field, use the base properties available to build your query.
- To create the query using the built-in query builder, select Query Builder and do the following:
Note: You cannot use properties that contain special characters, such as “device-02~!@#$%^&()_+{}|:\”>-=[]”.
Note: You must have at least one datapoint for your base properties to build your query.
- Enter additional properties for the query by selecting
 to add a property filter.
A list of properties is displayed. - Type a property in the Search records field, or select a property from the list of properties displayed.
LogicMonitor displays applicable properties as you type.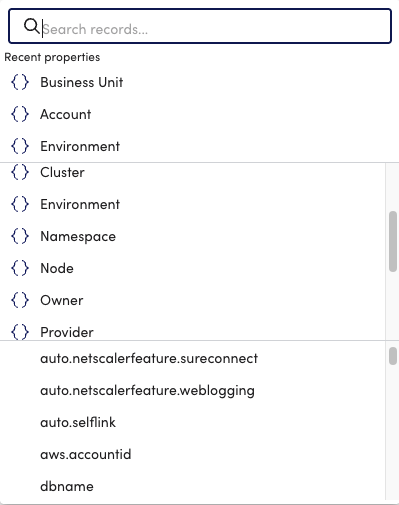
- Type a value for the property in the Search records field, or select a value for the property from the list of values displayed for the property.
LogicMonitor displays applicable values as you type.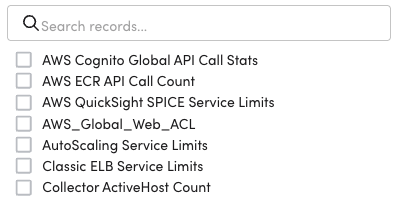
- In the Functions field, select the functions you want to use to perform specific operations or calculations on data.
For example, selecting “Average” from Aggregate returns the average value of all the matching resources for the selected datapoint.
Note: For more information about the various functions you can leverage, see LogicMonitor Query Language (LMQL) Reference for Advanced Metrics Widget.
- To return multiple data samples over a period of time for each matching metric, do any of the following:
- To define how far back in time to query for data, add a time for Time range.
Note: This option is independent of the time range set at the Dashboard level. For more information about the types of queries that support time ranges, see LogicMonitor Query Language (LMQL) Reference for Advanced Metrics Widget.
- To define how frequently datapoints are sampled in that range, add a time for Step.
Note: This option is independent of the time range set at the Dashboard level. For more information about the types of queries that support time ranges, see LogicMonitor Query Language (LMQL) Reference for Advanced Metrics Widget.
- To shift the evaluation time backwards by a specified duration, add a time for Offset.
- To create the query manually, select Raw Query and enter the string of queries you want to use in the Advanced Metrics Query field.
You can leverage dashboard-level tokens in your raw query by selecting Insert Token and selecting the token you want to use in your query.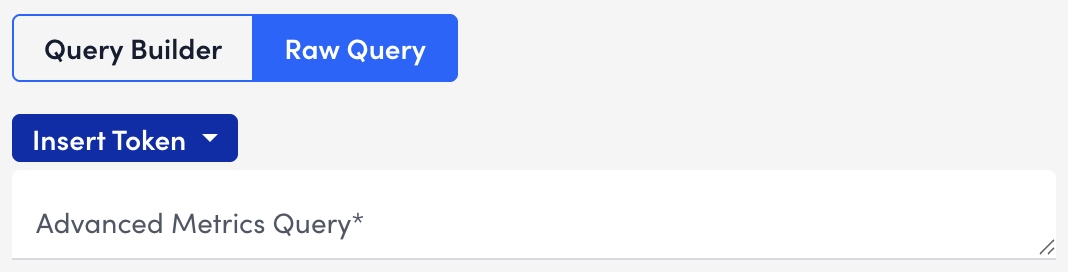
Note: You must have at least one datapoint to build your query.
For more information, see LogicMonitor Query Language (LMQL) Reference for Advanced Metric Widget.
- In the Display Settings, do the following to configure the type of visualization you want to use to represent the data for your query:
- To display your data as a Line Graph, Area Graph, or Stack Graph, select “Line Graph,” “Area Graph,” or “Stack Graph” from the Visualization Type dropdown menu, and then configure the settings for how you want the data to display. For more information on configuring the specific settings for each type of graph, see Custom Graph Widget Creation.
- To display your data as a Big Number widget, select “Big Number” from the Visualization Type dropdown menu, and then configure the settings for how you want the data to display. For more information on configuring the specific settings for each type of graph, see Big Number Widget.
Note: If leveraging a range vector query, this widget displays the last values of matching instances.
- To display your data as a Pie Chart or a Donut Chart, select “Pie Chart” or “Donut Chart” from the Visualization Type dropdown menu, and then configure the settings for how you want the data to display. For more information on configuring the specific settings for each type of graph, see Pie Chart Widget.
Note: If leveraging a range vector query, this widget displays the last values of matching instances.
- To display your data as a Gauge widget, select “Gauge” from the Visualization Type dropdown menu, and then configure the settings for how you want the data to display. For more information on configuring the specific settings for each type of graph, see Gauge Widget.
Note: If leveraging a range vector query, this widget displays the last values of matching instances.
- To display your data as a Table widget, select “Table” from the Visualization Type dropdown menu, and then configure the settings for how you want the data to display. For more information on configuring the specific settings for a Table widget, see Table Widget .
Note: If leveraging a range vector query, this widget displays the last values of matching instances.
- Configure the Widget Color Schema settings.
For more information, see Configuring Standard Widget Settings. - Select Save.
Your data displays on your dashboard as the widget you configured.
Advanced Metrics Widget Interaction
There are various actions you can perform on an Advanced Metrics widget that is added to a Dashboard. This provides you with more flexible actions when interacting with widgets, enabling you to engage in active troubleshooting more efficiently. For example, for data displayed as a Pie Chart, you can select a specific slice of the pie chart and navigate directly to the corresponding Resources in the Resource Tree to view the data for that instance.
For data displayed as a Pie Chart or Donut Chart, you can perform the following actions:
- Hide slice—Hide the selected slice from the chart.
- Go to Resources—Navigate directly to Resources to view the data for the specific datapoint in the Resource Tree.
- Apply to filters—Apply a Dashboard-level filter to all applicable widgets.
- Go to Logs—Navigate directly to Logs to view the data for the specific resource in the Logs page.
To access these actions, select a slice on the graph. The interaction options display for that slice.
For data displayed as any type of graph visual, you can perform the following actions:
- Highlight line—Hide all lines except for the one you select.
- Hide line—Hide the selected line from the graph.
- Go to Resources—Navigate directly to Resources to view the data for the specific datapoint in the Resource Tree.
- Apply to filters—Apply a Dashboard-level filter to all applicable widgets.
- Go to Logs—Navigate directly Logs to view the data for the specific resource in the Logs page.
To access these actions, select a line on the graph. The interaction options display for that line.
Note: Widget actions are not available for virtual datapoints or aggregate lines.
