
Metrics Explorer Report
Last updated - 19 January, 2026
You can use the Metrics Explorer report to gather and report on an aggregation of metrics across multiple DataSources. The enhanced flexibility enables you to more effectively report on the data most relevant to identifying root causes, prioritizing alerts, and reducing time to resolution.
The Metrics Explorer report leverages LogicMonitor Query Language (LMQL) to query for the data you want in the report. You can use LMQL to build structured queries that combine multiple datapoints in a single query, and then filter data using any property. LMQL also supports the advanced aggregation of data directly in your queries.
When you configure a Metrics Explorer report, you build the query you want to use. LogicMonitor includes a Query Builder that provides you with a structured method for building your query. The Query Builder provides the base properties (for example, a resource or an instance) and the applicable values that you can choose to include in the query. You can also add additional property filters and values, and the query functions to perform the operations on your data.
Note: Only resource properties are supported in the additional filters.
Alternatively, you can create your query as a raw query directly in the report configuration settings.
Note: The Query Builder does not contain all the functionality that creating a raw query offers. For a full reference on LMQL, including all functionality available when creating a raw query, see LogicMonitor Query Language (LMQL) Reference.
Configuring a Metrics Explorer Report
- In LogicMonitor, navigate to Reports.
- Select
 > Add Report > select Add for Metrics Explorer report.
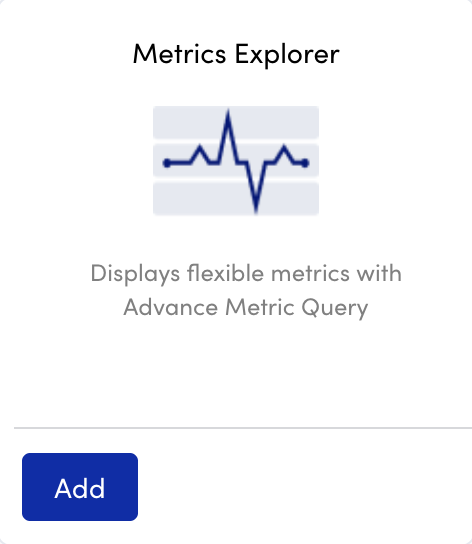
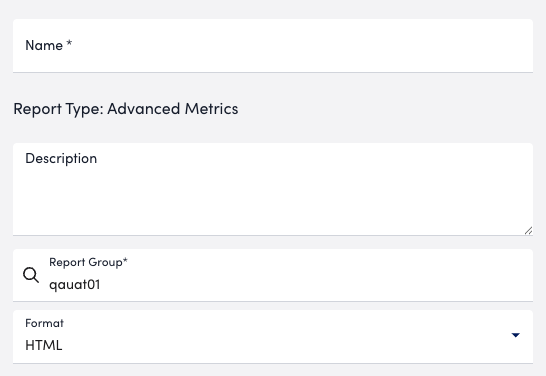
- In the Name field, enter a name for the report.
Report names cannot include the operators and comparison functions used in LogicMonitor’s datapoint expression syntax. - (Optional) In the Description field, enter a description for the report.
For example, you can enter a description of the specific purpose of the report. - From Report Group, select the report group where your report is stored.
Matching groups display as you type, and you can select the group from the list. - From Format, select the type of format (for example, HTML, PDF, or CSV) for the output of the report.
- Create the query for the data you want to display in the report by doing one of the following:
- To create the query using the built-in query builder, select Query Builder and do the following:
- In the Filter by field, use the base properties available to build your query.
LogicMonitor provides Resource, DataSource, Instance, and Datapoint as base properties to build your query.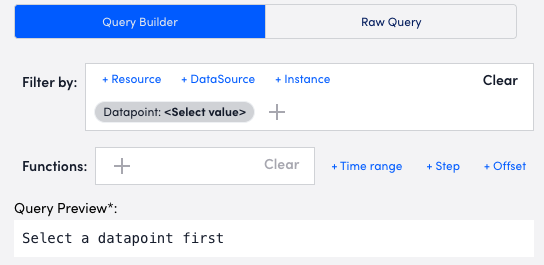
- Enter additional properties for the query by selecting
 to add a property filter.
A list of properties is displayed. - Type a property in the Search records field, or select a property from the list of properties displayed.
LogicMonitor displays applicable properties as you type.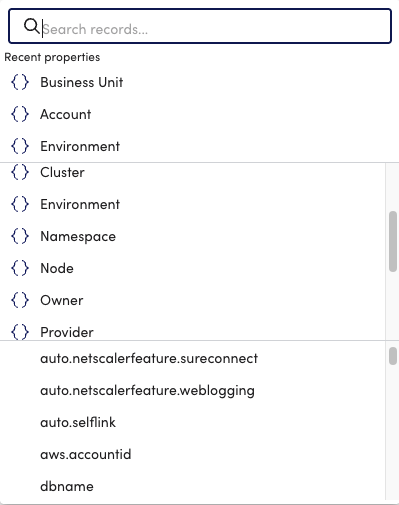
- Type a value for the property in the Search records field, or select a value for the property from the list of values displayed for the property.
LogicMonitor displays applicable values as you type.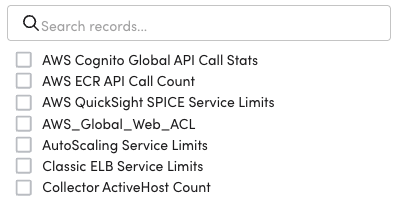
- In the Functions field, select the functions you want to use to perform specific operations or calculations on data.
For example, selecting “Average” from Aggregate returns the average value of all the matching resources for the selected datapoint. - To return multiple data samples over a period of time for each matching metric, do any of the following:
- To define how far back in time to query for data, add a time for Time range.
- In the Filter by field, use the base properties available to build your query.
- To create the query using the built-in query builder, select Query Builder and do the following:
Note: This option is independent of the time range set at the Dashboard level. For more information about the types of queries that support time ranges, see LogicMonitor Query Language (LMQL) Reference.
- To define how frequently datapoints are samples in that range, add a time for Step.
Note: This option is independent of the time range set at the Dashboard level. For more information about the types of queries that support time ranges, see LogicMonitor Query Language (LMQL) Reference.
- To shift the evaluation time backwards by a specified duration, add a time for Offset.
- To create the query manually, select Raw Query and enter the string of queries you want to use in the Metrics Explorer Query field.
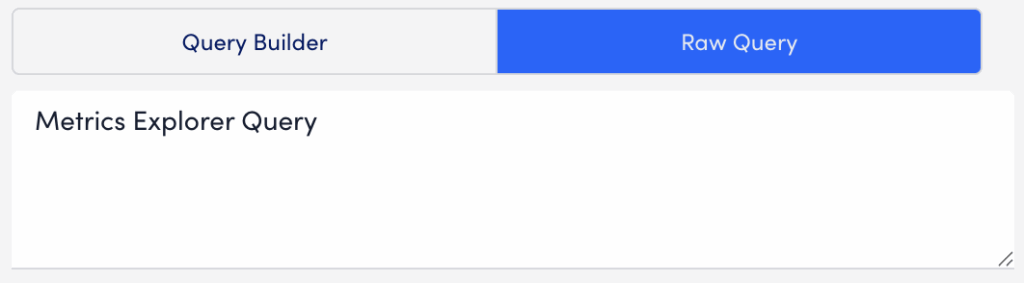
Note: You must have at least one datapoint to build your query.
Note: When leveraging a range vector query, the report output includes only the most recent sample for each metric. For more information, see LogicMonitor Query Language (LMQL) Reference.
- In Report Schedule settings, do the following to configure the report to generate on a schedule:
- Toggle Generate this report on a schedule.
- From Frequency, select how frequent you want the report to generate, and then configure when you want the report to generate.
For example, if you configure the report to generate daily, you can choose the time to generate the report each day. If you configure the report to generate weekly, you can choose the day of the week and time to generate the report for the selected date. If you configure the report to generate monthly, you can configure the day of the month and time to generate the report.
Each frequency option provides you a setting for selecting the time zone. - In Recipients Email, enter the name of the user you want to receive the generated report. You can also add recipient groups.
You can enter as many users as needed.
LogicMonitor attempts to match values as you type.
The recipients you add to the report are emailed a generated report based on the format you configured and the email associated with the username.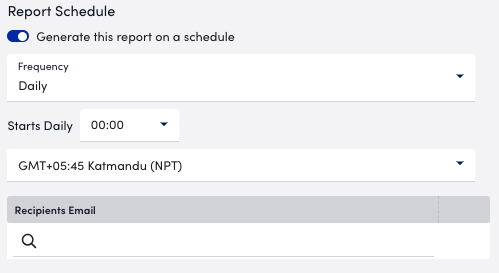
- To save the report, do one of the following:
- Select Save.
The report saves to the Report Group you selected.
If you configured the report to generate on a schedule, the report generates and sends to recipients based on the frequency you configured. - Select Save and Run.
A dialog displays confirming the report you want to run. Select Run Report to run the report.
The report saves to the Report Group you selected and generates a report based on the format you configured.
If you configured the report to generate on a schedule, the report generates and sends to recipients based on the frequency you configured.
- Select Save.
Important: The maximum limit for generating the Metrics Explorer report is 50. You must wait for 24 hours to generate the next report or contact your system administrator.
