Alerts for LM Uptime
Last updated - 15 June, 2026
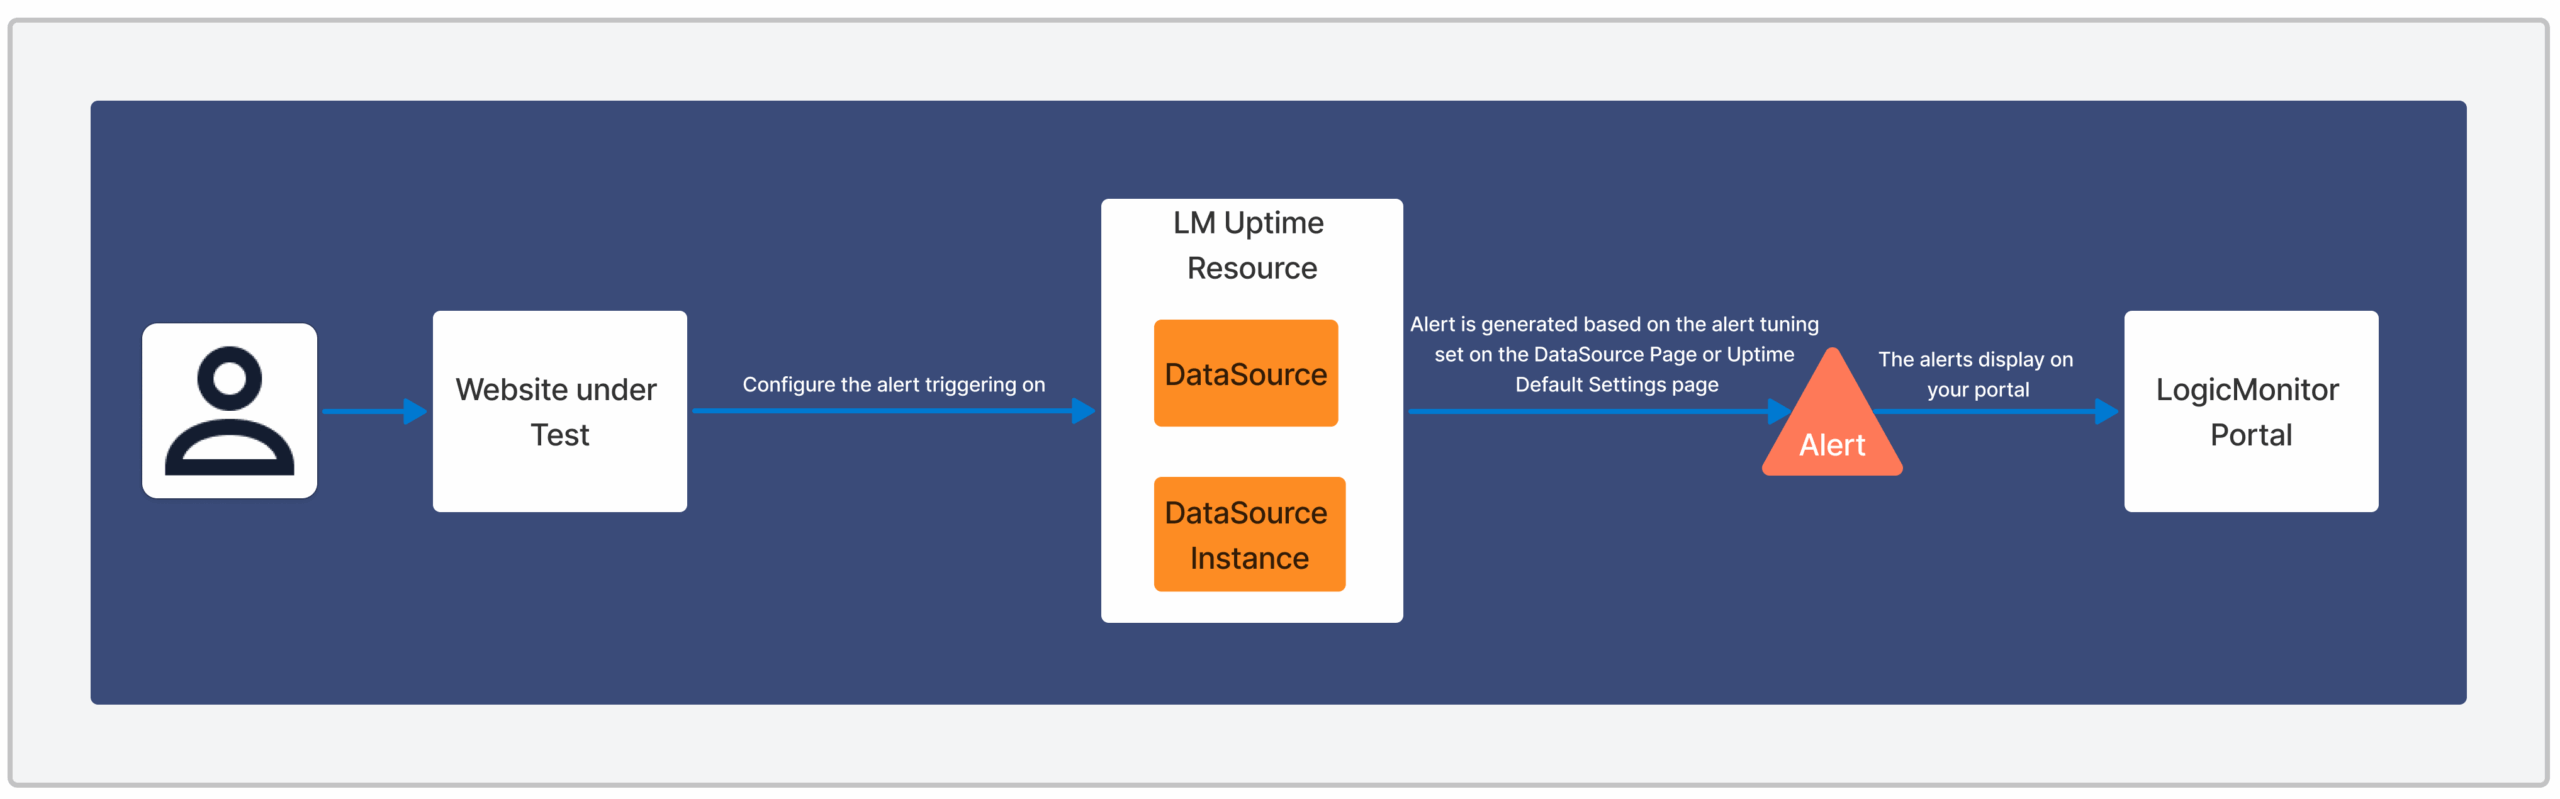
LogicMonitor raises alerts on the LM Uptime resource when a specified number of checks fail at one or more locations. These alert conditions are configured individually for each website during the setup or management of a Web Check or Ping Check. The way alerts are triggered depends on the type of check and whether it originates from an external checkpoint or an internal LM Collector. For more information on the setup, see Web Check Overview using LM Uptime or Ping Check Overview using LM Uptime.
Important:
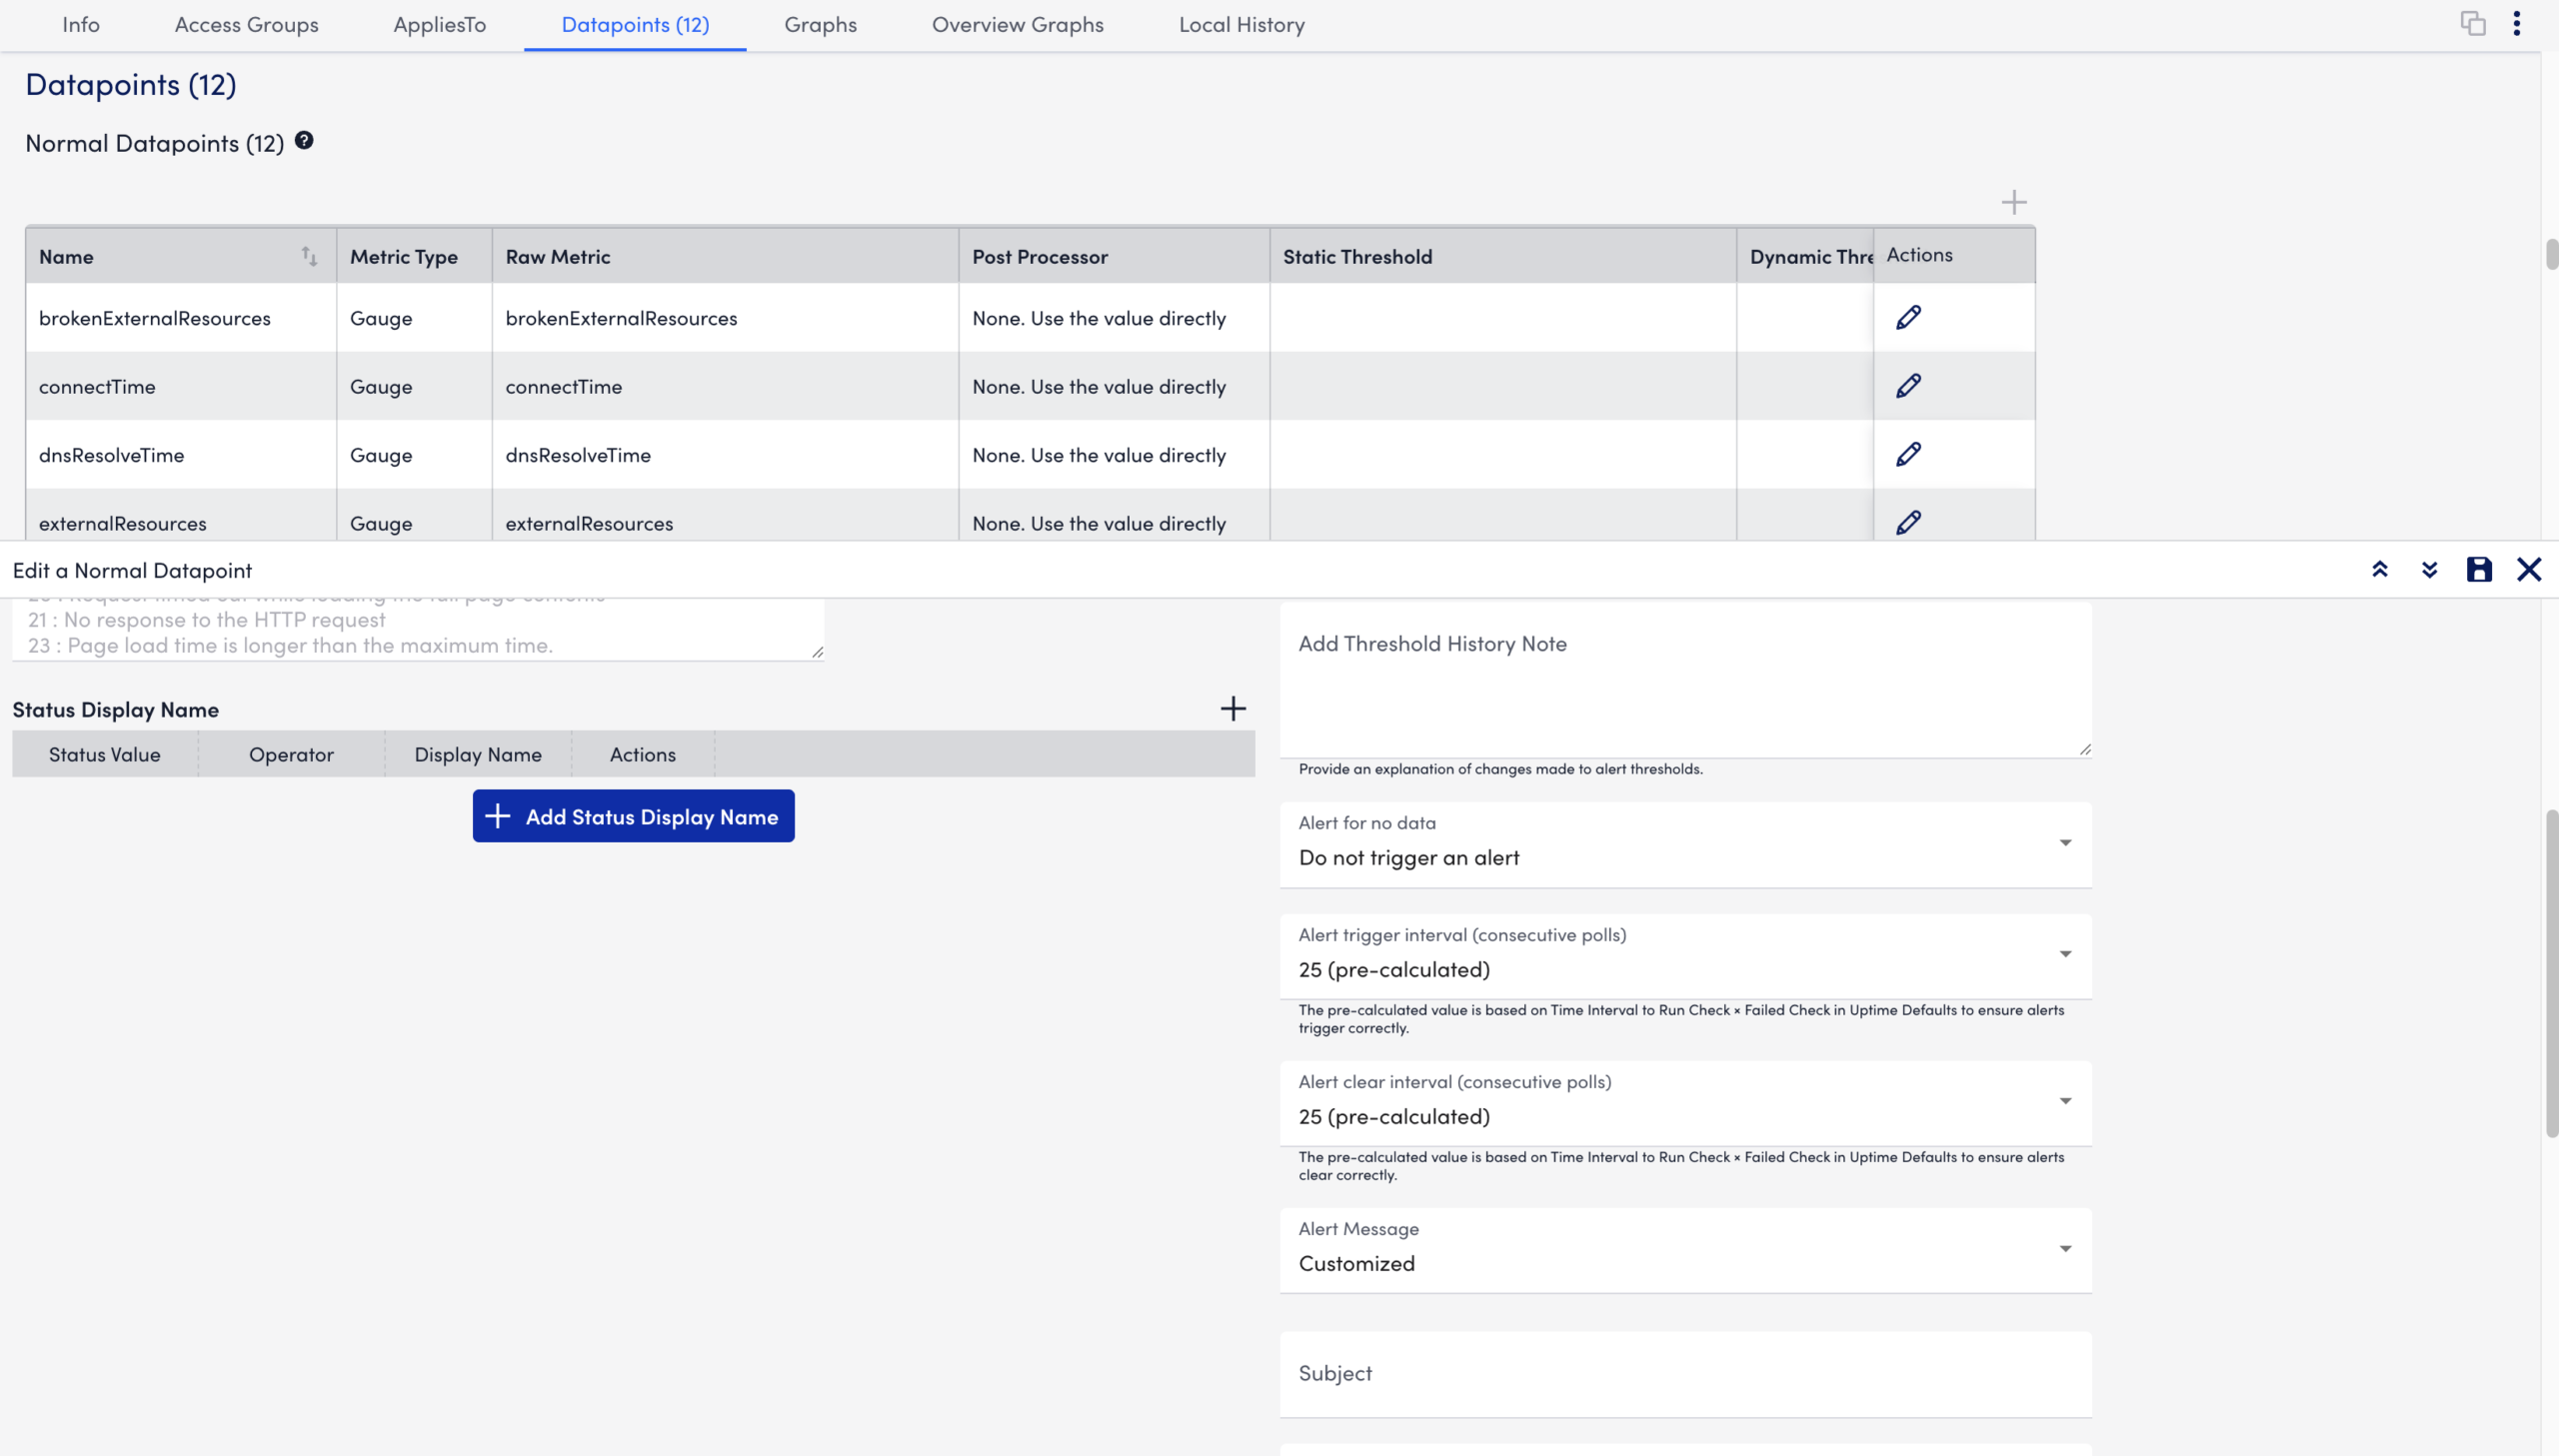
- Collection Schedule
- Alert Trigger Interval
- Alert Clear Interval
- Alert Thresholds
Do not modify the following DataSource fields. LM Uptime automatically derives these values from Uptime Defaults and LM Uptime alert tuning logic. Manual changes can result in incorrect alert behavior:
LM Uptime uses a polling-based alert transition model to determine when alerts trigger and clear for Web Check and Ping Check resources. The Failed Check value in Uptime Defaults determines how many consecutive failed polling intervals must occur before an alert triggers or clears.
The following formula describes the effective transition calculation:
Effective Transition = Polling Interval × Failed Check
For example, a 5-minute polling interval and a Failed Check value of 4 create an effective transition value of 20 minutes. In this example, the alert triggers only after four consecutive failed polling intervals. The same polling-based transition logic also controls alert clear behavior.
To keep these calculations accurate, LM Uptime DataSources use a 1 minute Collection Schedule. Changing the Collection Schedule or manually overriding the Alert Trigger Interval, Alert Clear Interval, or Alert Thresholds can desynchronize backend alert calculations from configured Uptime Defaults.
Recommendation: For checks that do not use Uptime Default Settings, alert trigger and clear behavior use the custom alert tuning values configured at the time of device creation for that Web Check or Ping Check
In these cases, LogicMonitor uses the same polling-based transition calculation, but the values are taken from the custom configuration instead of the global Uptime Defaults.
The following formula describes the effective transition calculation:
Effective Transition = Custom Polling Interval × Custom Failed Check
For example, if a Web Check does not use Uptime Defaults and is configured with a polling interval of 3 minutes and a Failed Check value of 5, the effective transition value is 15 minutes. The alert triggers only after five consecutive failed polling intervals for that check.
Uptime Defaults update alert settings for the following LM Uptime DataSource datapoints:
Web_Check_Individual— status and sslStatusWeb_Check_Overall—sslStatus, sslDaysUntilExpiration, and overallStatusPing_Check_Individual— statusPing_Check_Overall—overallStatus
Alert messages for LM Uptime resources can be customized globally using DataSource Alert templates. These messages support tokens to include dynamic, relevant information for more effective alerting. For more information, see Managing Alert Message Template.
Alerts for LM Uptime can be viewed on the main Alerts page, which displays all active alerts across LogicMonitor, or in the Alerts tab of a specific LM Uptime resource or group. The Alerts tab offers a filtered view tailored to the selected website and functions. For more information, see, Alerts Tab and Managing Alerts from the Alerts Page.