
Quick Steps to Setup LogicMonitor APM
Last updated - 25 April, 2023
Workflow
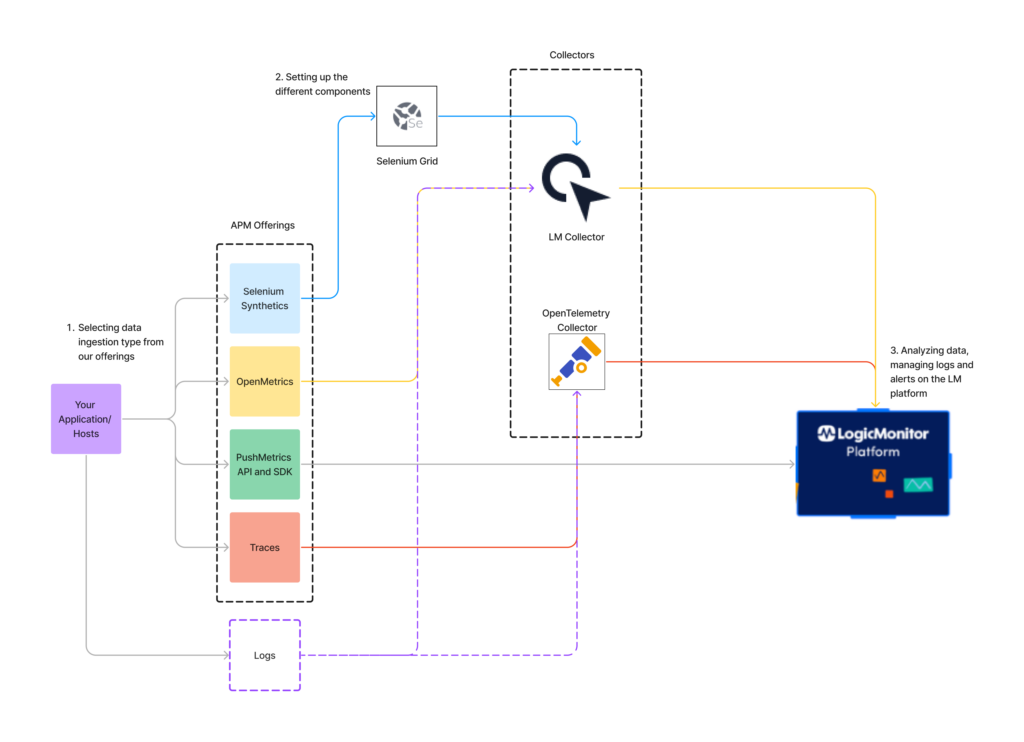
The following diagram illustrates the LogicMonitor APM setup workflow:
Procedure
Follow the below steps to setup LogicMonitor APM:
- Selecting data ingestion type from our offerings
- Setting up the different components
- Analyzing data, managing logs and alerts on the LogicMonitor platform
Selecting Data Ingestion Type from our Offerings
You need to choose the best APM offering for your application from the following:
- Emulate and test common application operations using Selenium Synthetics: For more information, see LM Synthetics Overview.
- Set up OpenMetrics (Prometheus Exposition Format) DataSources for polling an endpoint where these metrics are exposed. For more information, see OpenMetrics DataSource Wizard.
- Use the LogicMonitor Push Metrics feature to send metrics directly to the LogicMonitor platform using a dedicated API. For more information, see Getting Started with Push Metrics.
- Distributed Tracing is an OpenTelemetry-based integration that enables you to forward trace data from instrumented applications. For more information, see Distributed Tracing Overview.
Note: You can also ingest logs from your application to the LogicMonitor platform using the LogicMonitor API or SDK, LogicMonitor Collector, or OpenTelemetry collector.
Setting up the Different Components
The following is the setup requirement for the different APM offering:
Selenium Synthetics: Install LogicMonitor Collector on your system and then install Selenium Server. Once you install the LogicMonitor Collector and Selenium Server (Grid), you can add a Selenium Synthetics Web check in your LogicMonitor portal for ingesting Synthetics data to LogicMonitor. For more information, see Selenium Synthetics Setup.
OpenMetrics Integration: Install LogicMonitor Collector on your system and use the OpenMetrics datasource wizard to load metrics from an OpenMetrics endpoint and select the metrics to process into datapoints for collection. For more information, see OpenMetrics DataSource Wizard.
PushMetrics API and SDK: LogicMonitor Push Metrics REST API programmatically ingests metrics for multiple instances associated with a single resource and DataSource. For more information, see Ingesting Metrics with the Push Metrics REST API.
Traces: LogicMonitor provides a wrapped version of OpenTelemetry that is pre-configured to forward traces from your instrumented applications to the LogicMonitor platform. You can install an OpenTelemetry Collector on Linux, Docker, or Kubernetes. For more information, see OpenTelemetry Collector Installation.
Analyzing Data, Managing Logs and Alerts on the LogicMonitor Platform
All the traces and operations of the trace data from your instrumented applications displays on the Traces page. You can access the Traces page from the navigation sidebar or from a service in Resources. For more information, see Traces Page Overview.
For every static or dynamic threshold set for the metrics monitored at the Resource or Service levels, you will receive alerts on these trace and operation metrics. For more information, see Alerting on Trace Data.
