
LogAlert Groups
Last updated - 16 April, 2026
LogAlert Groups organize log messages into categories for alerting. LogAlert Groups do not trigger alerts. Instead, they define logical groupings where LogAlerts (formerly known as Log Alert Conditions) are configured to trigger alerts.
You can apply LogAlert Groups to resources or resource groups. LogAlerts define the alert criteria, such as matching specific text in a log message.
How LogAlert Groups Work
LogAlert Groups and their associated LogAlerts are created using the LM Logs Query Language to identify identify which logs trigger alerts. The querying can range from broad matches on entire resources or resource groups to very specific matches on individual log messages. You can also use regular expressions to match patterns when log content varies.
Use LogAlert Groups to organize log events or anomalies that require monitoring and action, such as errors or exceptions that require immediate attention.
To configure alerting do the following:
- Create a LogAlert Group and define filters to identify the logs to monitor.
- Create LogAlerts within the LogAlert Group to define the alert criteria and trigger alerts.
Considerations for LogAlert Groups
- Each partition supports up to 20 LogAlert Groups. Each LogAlert Group supports up to 55 LogAlerts, including up to 10 window alerts and 10 stateful alerts. Consolidate existing LogAlert Group conditions or reduce usage within the partition to meet these limit.
- You can create LogAlert Groups for unmapped resources. When no LogicMonitor-monitored resource or resource group exists, LogicMonitor automatically associates the LogAlert Group with a system-generated resource and resource group.
- The resource name matches the LogAlert Group name. The resource group for unmapped resources is called LogAlert GroupResources.
For more information, see Deviceless Logs. - LogAlert Groups and LogAlerts are evaluated for every received log. To maintain performance, define LogAlert Groups with specific scope, by limiting them to relevant device types and associated LogAlerts.
- Avoid broad definitions when logs cannot match the alert criteria. For example, Windows Event Logs do not match Syslog facility-based conditions.
Viewing LogAlert Groups
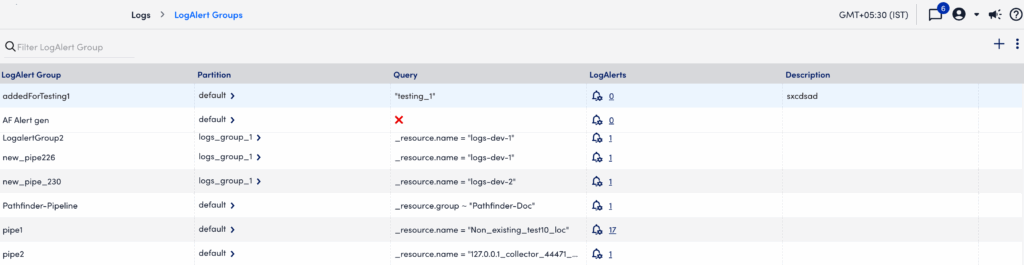
You can view LogAlert Groups on the Logs page by selecting the LogAlert Groups icon. On this page, you can review and manage existing LogAlert Group and add new ones.
The table describes the fields available on the LogAlert Groups page as follows:
- LogAlert Group—Displays the name of the LogAlert Group.
- Partition—Displays the partition associated with the LogAlert Group.
- Query—Displays the filtering conditions that define the log events in the LogAlert Group, such as the resources from which logs are received.
- LogAlerts—Displays the number of LogAlerts defined for the LogAlert Group. Select the count or icon to open the LogAlerts page and configure LogAlerts. For more information, see LogAlerts.
- Description—Displays information about the LogAlert Group.
Adding LogAlert Groups
You can add LogAlert Groups either from the Logs page or LogAlert Groups page:
- From a log event or anomaly on the Logs page:
- Open the menu for Resource or Groups.
- Select Create LogAlert Group.
The Add LogAlert Group dialog opens with the Logs query field prefilled with matching events for the selected resource or groups.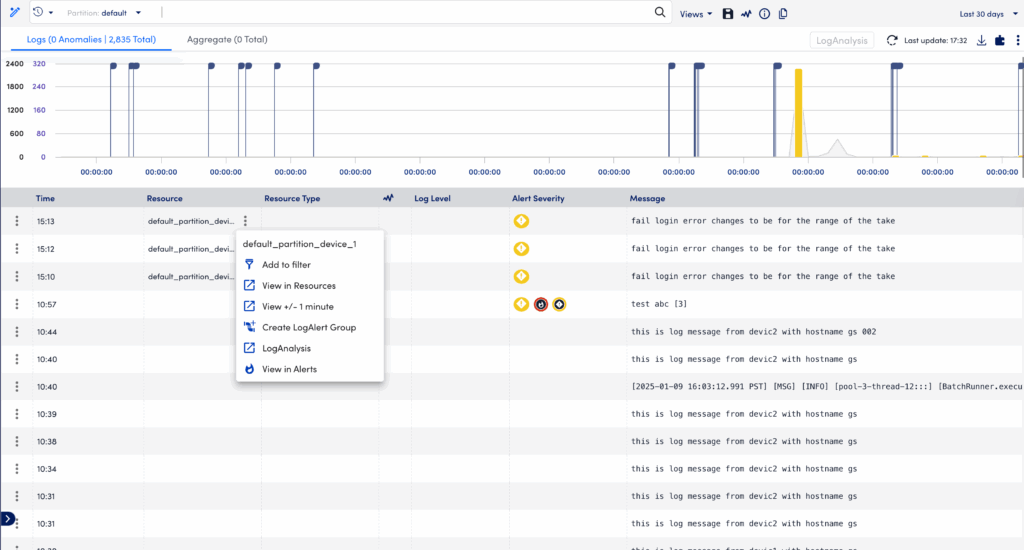
- From the LogAlert Groups page:
- Select
 Add to open the Add LogAlert Groups dialog.
 - Enter a Display Name and Display Description. These display in the LogAlert Group list.
- In Logs query field, define the events to match using the logs query language. For more information, see Query Language Overview.
- Select the arrow to preview the results and refine your query before you save.
- Select
 Save.
Save.
The LogAlert Group displays in the LogAlert Group list.
- Select
Note:
If you have existing LogAlert Groups and LogAlerts that exceed these limits, they will continue to function. However, you cannot create new LogAlert Groups or LogAlerts until you are within the supported limits.
To request an increase in the number of LogAlert Groups, contact your Customer Success Manager (CSM).
After adding a LogAlert Group, continue by defining its LogAlerts. For more information, see LogAlerts.
