Traces Page Filtering Operations
Last updated – 10 November, 2025
You can use filters to narrow the number of displayed operations. You can create an Advanced Filter. You can use the following filter options:
- Service—Operations that originated from a specific service
- Resource—Operations for a specific resource
- Operation—Specific operations or functions
- Error—Operations associated with an error
- Time—Operations over a specific time period
The Advanced Filter uses various search criteria to perform a query to create a filter. For more information about the criteria you can use in Advanced Filtering, see Advanced Filtering Criteria for Distributed Tracing.
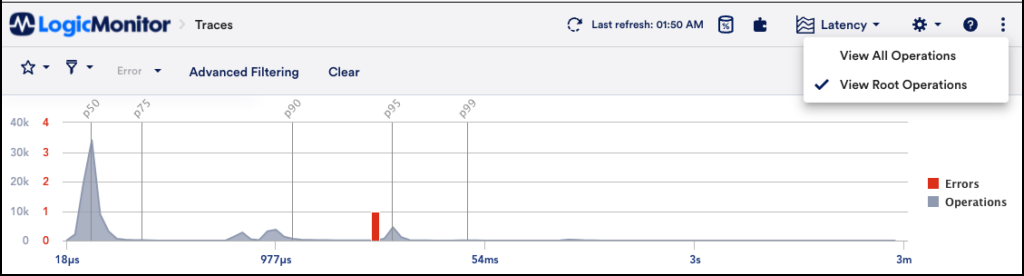
You can also refine your trace data by viewing the operations at the root level. This allows you to focus your search and determine where an issue may be occurring from the root level.
Creating a Traces Advanced Filter
- On the Traces page, ensure Advanced Filtering is enabled.
Advanced Filtering is enabled when the Query field is displayed.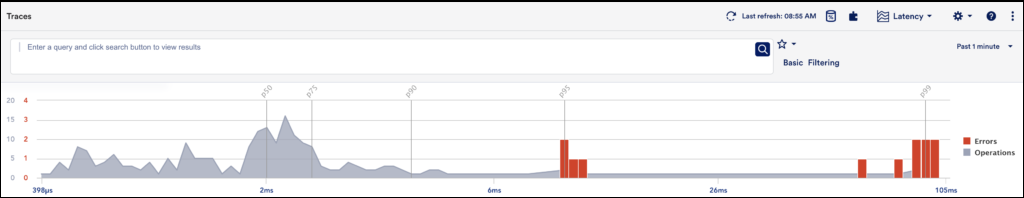
- Enter you search criteria in the Query field, and then click Search.
For more information about the criteria you can use in the Query field, see Advanced Filtering Criteria for Distributed Tracing.
The operations for the query are displayed in the Traces Graph.
Viewing Root Operations
- On the Traces page, click the Manage icon in the upper-right corner of your LogicMonitor portal.
- Select “View Root Operations”.
The Traces Graph updates to reflect the data at the root operations level.