
Resource Explorer Overview
Last updated – 16 June, 2026
Resource Explorer displays a summary of the health for all the resources that you are monitoring in your LogicMonitor portal. You can use filters and groups to focus on specific resources based on resource properties such as provider and region, quickly identify resources with critical DataSource alerts, and drill down to investigate the root cause of issues.
Requirements for Using Resource Explorer
To access Resource Explorer, you need a LogicMonitor user with the Resources permission set. For more information, see Users and Roles.
Filters
Resource Explorer provides detailed information on monitored resources. For example, selecting a top-level group opens a panel displaying additional information, such as number of resources with critical alerts and the percentage of resources with critical alerts that are Collectors.
Use the Filter by to filter resources based on any property or alias and their values. You can add a filter from the Quick add list or select the plus icon and select or type the resource property into the field. When you add a property filter, the page displays resources that have the property and the values you specify. When you use multiple filters, the page displays only resources that match all of the filters.
You can enter or select an existing value or use a regular expression wildcard to specify the value. If you do not specify a property value, the page displays the resources where the property exists, regardless of the value (including null values). When you specify multiple values for a property in a filter, the page displays all resources that match at least one of the values. For example, if you filter for Provider: AWS, Azure, GCP, the page displays all cloud resources.
Note: Resource Explorer views are available as Widgets in a LogicMonitor dashboard. If a Resource Explorer widget filter property is the same as the property in the Resource Explorer dashboard, the values in the dashboard property filter override those of the widget, regardless of which was configured first. An icon displays on the widget to indicate the results are filtered. For more information, see Resource Explorer Widget.
By default, filters include results based on the selected values for each property. To exclude results based on selected property values, select the Exclude toggle in the Filter By list menu. This displays all resources except those where the filter values exist for the given property. This option also supports wildcard characters.
Select Clear to remove all the filters from the field.
Note: Filtering in Resource Explorer supports the asterisk * wildcard for matching property values.
For example, filtering for Region: eu*, us*1, *2, *central* returns the following:
- Regions that start with “eu”
- Regions that start with “us” and end with “1”
- Regions that end with “2”
- Regions that contain “central”
Alert Filters
Alert filters allow you to see filters based on when and how alerts are triggered.
- Alerts time range- Filter alerts by the time range in which an alert began.
- Ignore alerts in SDT- Toggle this filter on to filter out alerts currently in service downtime.
- Alert Datapoints- Add datapoints to the Alert Datapoints field and choose to Ignore or Include datapoints from the dropdown.
Groups
Use Group by to group filtered resources based on one or more properties. When you add a group-by property, the page displays the resources in groups based on the values that exist for the property on those resources. When you add more than one group-by property, the page displays a breakdown of each of the properties into subgroups within that group.
For example, you can quickly add groupings by Provider and Resource Type. This organizes the monitored resources into groups by different values of Provider and then subgroups by different values of Resource Type. You can see if there are critical alerts on resources like Virtual Machines, Kubernetes pods, AWS EBS instances, and more.
The groups and sub-groups are arranged based on the order that you listed the group-by properties. You can rearrange the display order by dragging and dropping the properties in the field. The page also displays the resources that do not contain the selected properties in their own groups.
Clear removes all the group-by properties from the field.
Note: Resource Explorer does not allow grouping on properties that contain sensitive information.
Alert Severity
Use the quick filters for alert severity, represented by colored icons, to display resources that have the selected status. You can remove the None status to focus only on the resources that have a Critical, Error, or Warning alert status. By default, all alert severities are included.
For example, if you see a critical alert in AWS/EBS resources you can investigate by double-clicking AWS/EBS to drill down into the group. Because there are fewer resources in this view, the page displays each individual resource as a hexagon.
You can hover over the red hexagon to see brief information about the resource or click on the hexagon to open a panel with more information about the critical alert. From this panel, you can click Complete Alert Details to continue your investigation in a new tab or navigate to the Datapoint Analysis and Log Analysis pages for this alert.
Note: Resource Explorer displays only the alerts that are triggered on the datapoints defined by DataSources for your monitored resources. For more information, see Types of Alerts in LogicMonitor.
Saving and sharing views
You can save the collection of filters and groupings for later use or share your current investigation with other users for review.
- On the Resource Explorer dashboard, open the dropdown menu to the left of the Filter By field.
- Enter a name for the new saved view in the Save as new View field.
- Select the Save icon.
When you save a view, it is available in your account and not shareable with other users. Saved views include the selection of filters, group-by properties, and alert severity filters. You can access your saved views in the Views menu.
A Save icon displays next to the Saved views menu if you make changes to a currently selected saved view. Saving the view with this icon will overwrite the currently selected view.
Use the Copy Link URL icon to copy a customized URL link to the current view. When provided to another user, this URL displays the exact view configuration from the time the URL was generated.
The user can navigate and edit the shared view, but any changes do not reflect in the shared URL. Cloud platform user permissions can affect what information a user can view within a shared view.
Customizing Quick add Lists
You can further customize the Quick add list of both Filter by and Group by to manage which filter properties appear on the list.
- Select the Settings icon in the Quick add list for either Filter by or Group by.
- In the Manage quick add list window, a table displays all current filter/group properties in the list in order of appearance.
- Select Add to create a new quick add property.
- Enter the property name to see a list of available properties, and select the property and value you want to add.
- Select Apply.
- Use the Reorder column in the table to organize your new property in the quick add list.
- Save any changes.
The Quick add list will update automatically to display new properties and updated list order. You can also delete quick add properties from the Manage quick add list window.
Navigating Resource Explorer
The Resource Explorer displays individual resources and groups in the following views:
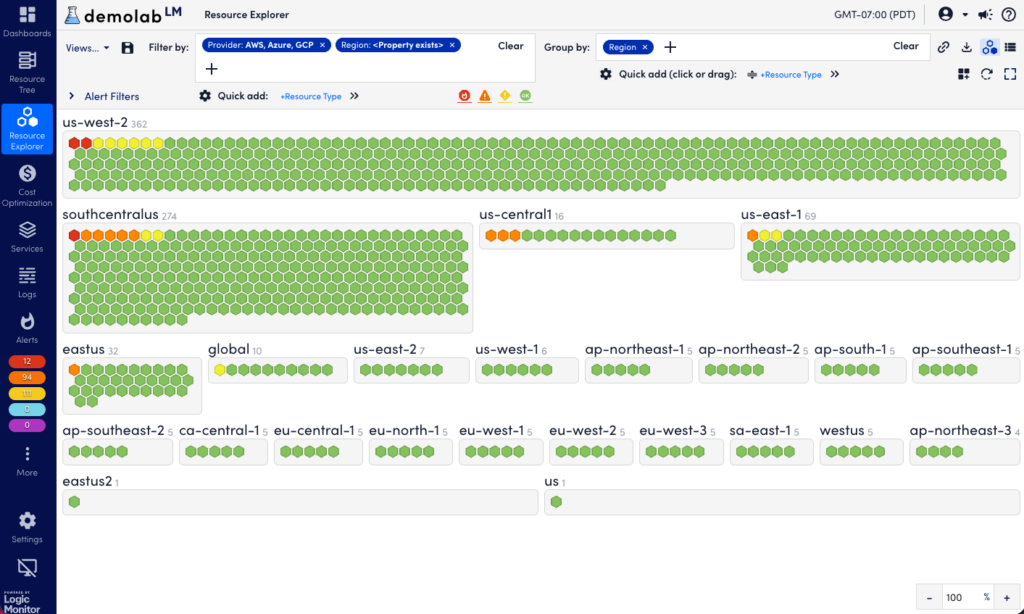
 Hive View—Organize resources as hexagons and groups resources together visually in a single container. Next to the title of each group is a count of the number of resources in the group.
The color code provides a visual indication of the highest alert severity status for resources in a group.
You can quickly view more information with the following actions:- Hover—Opens a tooltip with brief details about the group or resource. When you hover over a colored section of a bar, the tooltip displays the number of resources in the group with that alert status. When you hover over hexagons, the tooltip displays the Name, Type, and alert Status for the individual resource.
- Click—Opens a panel with information about the resources in the group or details about the individual resource. For more information, see Viewing Resource Information in this document.
- Double-click—Double-click on a group bar to drill down into the group. Double-click on a hexagon to navigate to that resource’s full details in the Resource Tree page.
 Table View—Organize resources in a table with rows generated from groups. Table columns display the group name, number of resources in the group, and active alerts of each severity.
You can view more information with the following actions: Expand—Expand the row to see the next group dimension (if any), or the resources in the group. Select Expand beside each resource to open a panel with details about the individual resource.
 View Group Details—Open a panel with information about the resources in the group
For more information, see Viewing Resource Information in this document.
Select the ![]() Refresh icon next to the Group By field to see the latest information for your resources. Hover over the icon to see when the last update took place.
Refresh icon next to the Group By field to see the latest information for your resources. Hover over the icon to see when the last update took place.
Select the ![]() Fullscreen icon to turn on fullscreen mode. Turning on fullscreen enables auto-refresh, which automatically refreshes resource details every two minutes. Hover over Last update to see the next auto-refresh time..
Fullscreen icon to turn on fullscreen mode. Turning on fullscreen enables auto-refresh, which automatically refreshes resource details every two minutes. Hover over Last update to see the next auto-refresh time..
Note: Selecting Fullscreen also disables the Filter by and Group by panels and displays only your current filter set.
Viewing Resource Information
Select groups or individual resources to open a panel that displays summary information about the resource or group. The information displayed in the panel updates as you select different groups on the page, modify the filters and group-by properties, or select and deselect alert severity filters. You can also select and drag the panel around the window.
When you select a group, the panel displays summary information for the resources within that group:
- Overview—Displays a breakdown of the resources with the highest alert severity within the group. Select different properties to customize information displayed in the charts. You can also quickly add group-by properties from this panel.
- Resources—Displays a breakdown of the different types of resources in the group and an inventory of all the resources with information about the alerts and severities. Select a resource to open a new tab and navigate to its full details in the Resource Tree view.
- Alerts—Displays a breakdown of the alerts by count and severities. You can view up to 100 recent alerts in the group by severity.
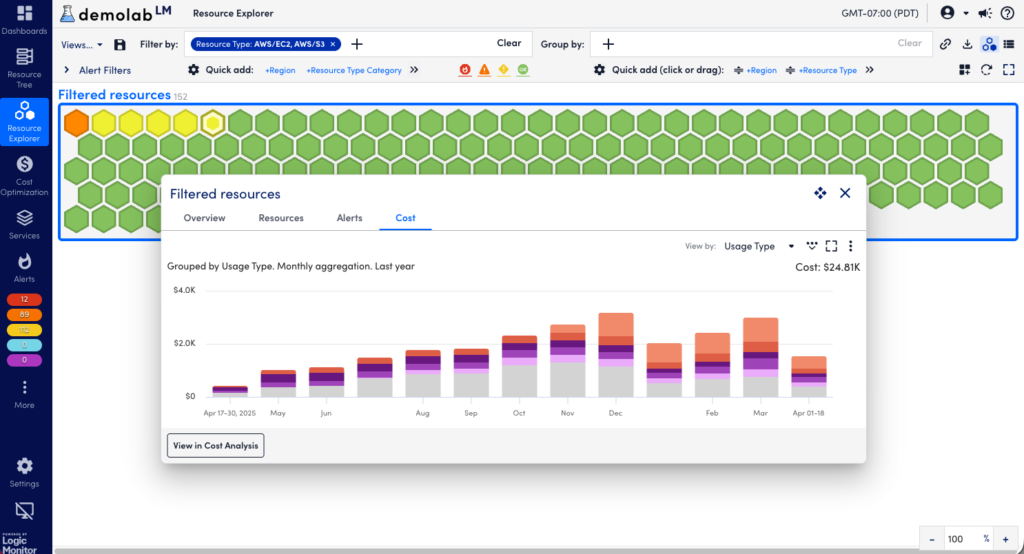
- Cost—Displays a breakdown of cost data associated with resources within the group. You can view cost details from the previous 12 months.
- Use the View By dropdown to view costs by more specific dimensions.
When you select a hexagon or individual resource, the panel displays information about the alerts and metrics on that resource:
- Alert Details–Displays information about the most recent highest severity alert and links to the Alerts tab for the resource in the Resources Tree. If a datapoint graph exists, it will display the datapoint graph associated with the alert. You can open the Alerts page in a new tab to view the Complete Alert Details, or navigate to the Datapoint Analysis, Log Analysis, or Trace Analysis for the alert if they exist.
- Metrics-Displays graphs of up to four datapoints around the time of the most recent severe alert, or from the last 12 hours if no alerts are present.
- Info-Displays a curated list of properties for the selected resource. A cloud resource will also display a table of tags configured on that resource.
- Cost—Displays a breakdown of cost data associated with the resource. You can view cost details from the previous 12 months.
Resource cost data only displays if a billing configuration is configured for the resource, and you have permission to access billing configurations. For more information, see Cost Optimization Billing Configuration.
Note: If you enable Digital Experience, you can run a Digital Experience test to evaluate user impact and performance by selecting Test user impact for the selected resource. You can run a test from the Alert Details and Info tab. For more information, see Enabling Digital Experience in LogicMonitor.
