
Distributed Tracing Overview
Last updated - 03 October, 2025
Application trace data helps you identify where an issue is occurring in an application’s communication while the application is running. The trace data contains information about each step—or span—of the communication process, such as how long a request took, which components the request interacted with, and any latency introduced in each step. Distributed Tracing is LogicMonitor’s ability to gather this distributed collection of data from your application infrastructure into one central location.
You can monitor the end-to-end communication as the requests flow through the distributed services in your environment and view the trace data directly in your LogicMonitor portal along with relevant metrics and contextual logs. In addition, you can configure alerts to notify you when any component of the process is not performing. For example, after receiving an alert that there is a slow database query for an application, you can use LogicMonitor to pinpoint where in the database the issue is occurring.
LogicMonitor’s Distributed Tracing is an OpenTelemetry-based integration which enables you to forward trace data from instrumented applications and monitor the end-to-end requests as they flow through the distributed services in you environment.
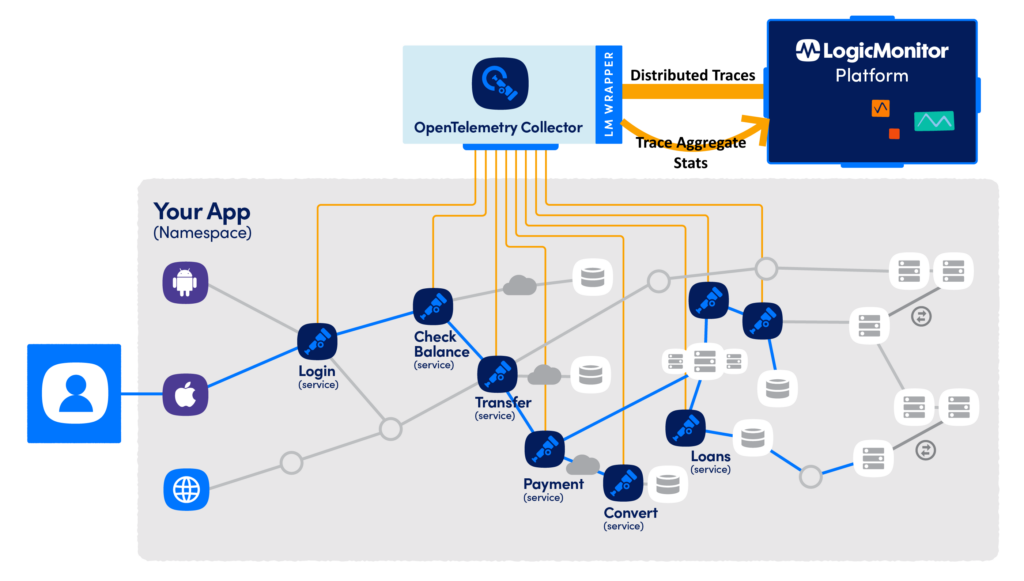
The following diagram illustrates how the distributed traces in your environment are gathered into LogicMonitor’s platform:
Before you can begin monitoring an application’s trace data with LogicMonitor, you must do the following:
- Install an OpenTelemetry Collector—The OpenTelemetry Collector is pre-configured to forward traces from your instrumented applications to the LogicMonitor platform. For more information, see OpenTelemetry Collector for LogicMonitor Overview.
- Instrument your application—Instrumenting an application enables LogicMonitor to monitor the application’s trace data. For more information, see Application Instrumentation Overview.
You can view and interact with the application’s trace data in your LogicMonitor portal with the following:
- Resources—Operations are mapped to existing resources. If resources do not already exist in LogicMonitor, new resources are automatically created. Trace metrics display at the resource level. For more information, see Viewing Traces for a Resource.
Recommendation: Monitor the underlying infrastructure for your applications through the proper modules (LM Cloud, LM Container, and traditional compute based infrastructure).
- Services—Services are automatically created to group underlying resources and display service-level operation metrics. For more information, see Viewing Traces for a Service.
- Traces Page—Service operations and end-to-end traces are accessible from the Traces Page in LogicMonitor. This allows you to proactively identify slow operations as areas for optimization and troubleshoot issues. For more information, see Traces Page Overview.
