
OpenTelemetry Collector Installation from Contrib Distribution
Last updated - 06 April, 2023
The OpenTelemetry Contrib distribution is a repository for OpenTelemetry Collector components that are not a part of the core repository and distribution of the collector. LogicMonitor Exporter is a part of the OpenTelemetry Contrib distribution.
The OpenTelemetry Collector allows you to collect OpenTelemetry-supported telemetry data from your environment to the LogicMonitor platform. LogicMonitor associates the traces and logs telemetry data from the single OpenTelemetry Collector through the LogicMonitor Exporter to simplify your application’s operations and troubleshoot issues. For more information, see LogicMonitor Exporter from OpenTelemetry.
The OpenTelemetry Contrib distribution offers you the following:
- Broad coverage of traces and log receivers from different sources—Different receivers from the OpenTelemetry Collector can be used to collect traces and log data from different traces and log sources. For example, you can export traces and logs to the LogicMonitor platform from multiple trace providers like Azure and AWS X-Ray and log providers like CloudWatch, Kafka, and Syslog.
- OpenTelemetry distribution management—You can create different distributions of OpenTelemetry Collectors as needed. OpenTelemetry Collector also supports creating builds for other operating systems and creating container images with different architectures.
- Various deployments—Using the helm chart, you can deploy in different modes like a sidecar, daemon sets, and deployment.
- Telemetry interoperability—Receivers for different trace providers can be used to convert the traces from vendor-specific format to OpenTelemetry format. You can then ingest data into the LogicMonitor platform.
Important: You are responsible for upgrading and configuring of OpenTelemetry Collectors. Contact Support if you need assistance.
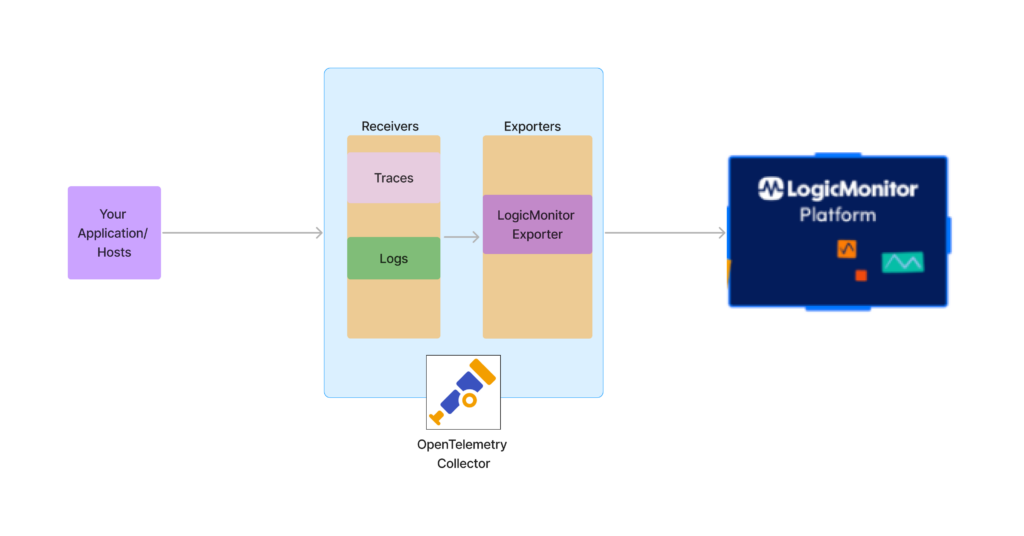
The following image illustrates the traces and logs ingestion process using a single LogicMonitor Exporter in the OpenTelemetry Collector:
Installing OpenTelemetry Collector from Contrib
Before starting the installation, see “General Requirements and Considerations” for installing the OpenTelemetry Collector. For more information, see OpenTelemetry Collector Installation.
Downloading and Installing OpenTelemetry Collector
Depending on your environment, you can download and install OpenTelemetry Collector on Linux, Windows, Docker, or Kubernetes. For more information, see Getting Started from OpenTelemetry.
For more information on viewing the different releases, see OpenTelemetry Collector Releases from OpenTelemetry.
Note: LogicMonitor Exporter is available with OpenTelemetry Collector Contrib v0.72.0 or later.
Configuring LogicMonitor Exporter
To configure LogicMonitor Exporter, you need to create a configuration file:
receivers:

  windowseventlog:

    channel: application

  syslog:

    tcp:

      listen_address: "0.0.0.0:54526"

    protocol: rfc5424

  jaeger:

    protocols:

      grpc:

  otlp:

    protocols:

      grpc:

processors:

  batch:

exporters:

  logicmonitor:

    endpoint: https://<company_name>.logicmonitor.com/rest

    api_token:

        access_id: "<access_id of logicmonitor>"

       access_key: "<access_key of logicmonitor>"

extensions:

  health_check:

service:

  extensions: [health_check]

  pipelines:

    logs:

      receivers : [ windowseventlog, syslog ]

      processors: [ batch ]

      exporters : [ logicmonitor ]

    traces:

      receivers : [ otlp, jaeger ]

      processors: [ batch ]

exporters : [ logicmonitor ]Exporting Telemetry Data from OpenTelemetry Collector
The OpenTelemetry Collector automatically starts exporting telemetry data to LogicMonitor after you add the LogicMonitor Exporter to your OpenTelemetry Collector configuration file.
