
Disclaimer: This content applies to the legacy UI and is no longer maintained. It will be removed at a future time. For up-to-date content, see SLA Widget. At the time of removal, you will automatically be redirected to the up-to-date content.
SLA Widget
Last updated - 24 July, 2025
Overview
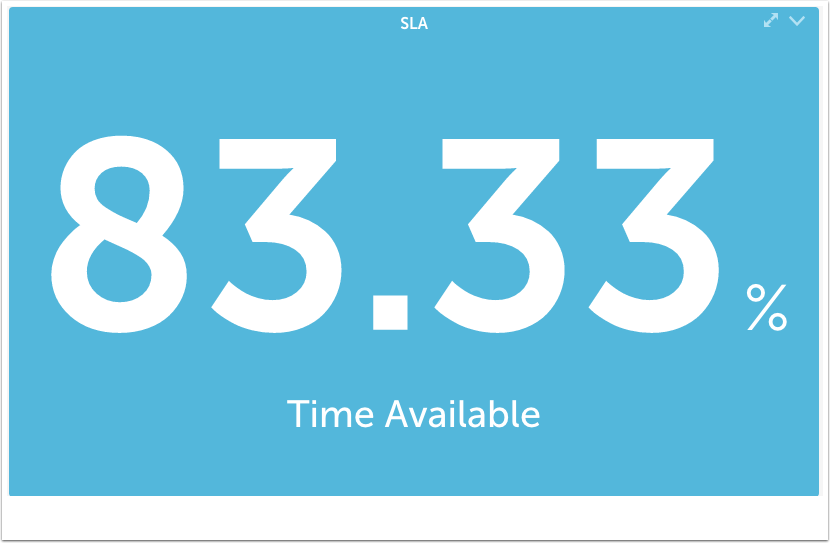
The SLA widget calculates the percentage of time in which acceptable service levels were maintained for the resources or websites included in the widget. Acceptable service levels are defined in the widget’s configurations.
How Is the SLA Widget Calculated?
For each individual website or resource included in your SLA widget, the baseline calculation is quite simple. It is the amount of time the resource or website actually met its acceptable service levels as compared to the amount of time covered by your SLA.
However, if you would like your widget to ultimately display a single percentage that represents the overall SLA value for the websites or resources being monitored, there are additional calculations that take place. Depending upon whether you’re measuring performance across websites or resources, there are potentially two calculation options available to you.
Measuring Performance Across Websites
When generating an SLA widget for websites, the overall SLA summary value is calculated by averaging the percentage of time in which acceptable service levels were maintained by the individual websites. For example, consider that an SLA widget is measuring the availability of the following four websites over a one-day period:
- Website A: Unavailable from 8-9am; 95.83% (23/24 hours)
- Website B: Unavailable from 9-10am; 95.83% (available 23/24 hours);
- Website C: No unavailability; 100% (24/24 hours)
- Website D: Unavailable from 8:30-9:30am; 95.83% (23/24 hours)
The overall SLA summary value for websites A, B, C and D is 96.87%, which is the average of their individual availabilities.
Measuring Performance Across Resources
When generating the SLA widget for resources, there are two calculation methods available for determining the aggregated SLA value. One of the methods is the one described in the previous section (i.e. averaging the percentage of time in which acceptable service levels were maintained by the individual resources).
The other calculation method measures the percentage of time in which all resources concurrently met their individual thresholds for acceptable service levels. For example, consider that an SLA widget is measuring performance thresholds for the following four resources over a one-day period:
- Resource A: Fell below defined threshold of acceptable service level from 8-9am
- Resource B: Fell below defined threshold of acceptable service level from 9-10am
- Resource C: Met acceptable service level threshold all day
- Resource D: Fell below defined threshold of acceptable service level from 8:30-9:30am
Based on these metrics, the total window of time in which at least one resource was performing at a subpar level was from 8-10am, which evaluates to an overall SLA value of 91.67%. If these four resources were calculated using the average approach of the other calculation method, the overall SLA value would be 96.87%
Configuring an SLA Widget
To configure an SLA widget, open the dashboard you would like it to display on, click the v dropdown arrow located in the far right of the open dashboard’s header and select Add Widget | SLA. This opens the Add SLA Widget dialog, which allows you to configure various widget settings.
Note: The first two fields found in the widget dialog (Title and Description, along with the final configuration (Color Schema), are universal to all widget types. To learn more about these global widget settings, see Adding and Configuring Widgets.
In the SLA Settings area of the widget configuration dialog, shown and discussed next, specify settings particular to the SLA widget.
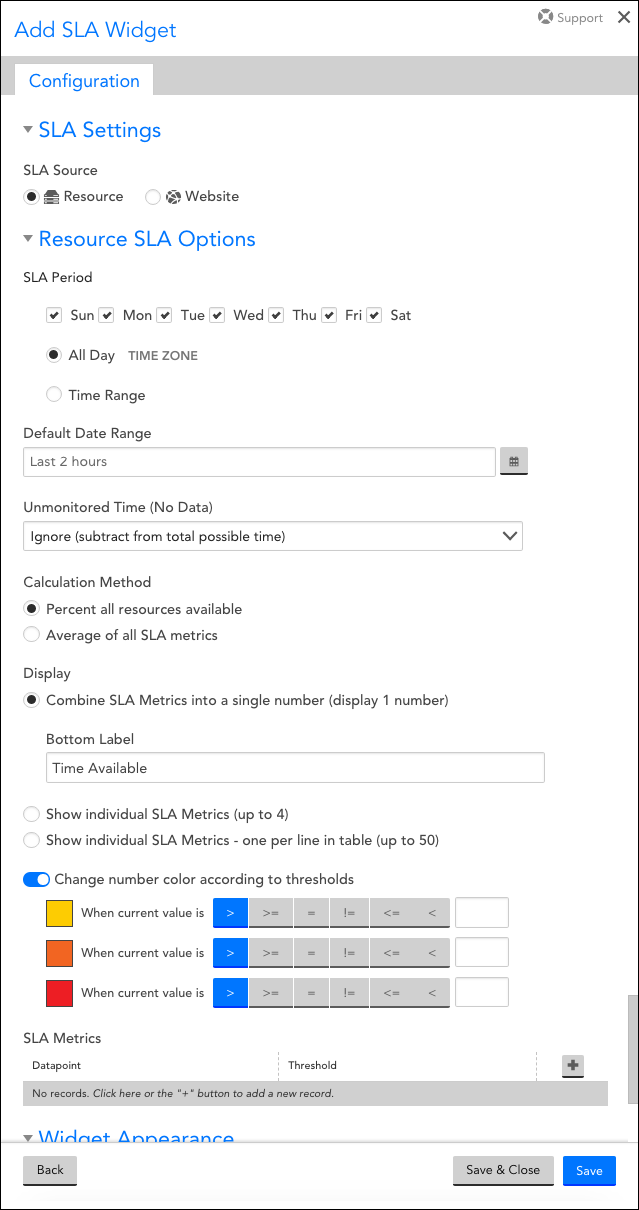
SLA Source
For the SLA Source option, indicate whether the widget will monitor SLAs for a set of resources or websites. Depending upon your selection here, you will see varying options dynamically appear.
Note: In the next few sections, we’ll cover those configurations that are common to both resource and website widgets, even though the sections may not match the order in which they appear in the configuration dialog; in the section titled Configurations Unique to Websites or Resources, we’ll branch off into the unique configurations available for each widget type.
SLA Period
Using the configurations under this heading, indicate the period (days and time) in which the SLA is in effect. Select the All Day option if your SLA spans all 24 hours of the selected days. If the SLA does not cover days in their entireties, select the Time Range option to indicate a window of time, down to the quarter hour, within each day that the SLA spans.
Note: This section should reflect the time range of your actual SLA, not the time range of the widget. The widget’s time range is determined in the configuration discussed next.
Default Date Range
Click your cursor into the Time Range field to display the options available for setting a predefined or custom duration of time for which data will be pulled for this widget.
Note: The range set at the dashboard level will take precedence over the widget’s specified range. To respect a widget’s range, make sure its parent dashboard’s time range is set to “Default time range (Varies per widget).”
Change Number Color According to Thresholds
Toggle the Change number color according to thresholds slider to the right to enable up to three varying color displays depending upon the current SLA value. For example, you could configure your SLA widget to display any SLA values lower than 97% in red. This is an excellent way to provide at-a-glance indicators for the general wellbeing of the resources or websites being monitored.
Configurations Unique to Websites or Resources
Depending upon your selection for the SLA Source field–either “Resource” or “Website,” you will see fields unique to that selection.
Configurations Unique to Websites
Websites Table
Click the + icon located at the top right of the Website table to identify the websites that will be tracked by this widget. Use the Group and Website fields in combination to add a website metric. Multiple metrics can be added, but they must be configured and saved one at a time.
Before saving a metric, check the Exclude SDT periods checkbox if you’d like scheduled downtime (SDT) to be removed from the SLA calculations.
Configurations Unique to Resources
Unmonitored Time (No Data)
The Unmonitored Time (No Data) field allows you to establish what impact, if any, the amount of time in which no data was reported for the resources has on the SLA calculation. There are three options available for selection from this field’s dropdown menu:
- Ignore (subtract from total possible time). This option does not include unmonitored time in its SLA calculations. For example, if your widget’s time range spans 100 hours, of which there are five hours of missing data, the widget will calculate the SLA value based on a total time range of 95 hours.
- Count as violation (subtract from uptime). This option will consider any unmonitored time as a violation against your SLA. For example, if your widget’s time range spans 100 hours, of which 15 of those hours represent performance that doesn’t meet SLA thresholds and five of those hours represent no data received, the widget will calculate SLA violation time as 20 hours, which results in an overall SLA value of 80%.
- Count as available (add to uptime). This option will consider any unmonitored time as meeting SLA requirements. For example, if your widget’s time range spans 100 hours, of which 15 of those hours represent performance that doesn’t meet SLA thresholds and five of those hours represent no data received, the widget will calculate SLA violation time as 15 hours, which results in an SLA value of 85%.
- Collector delay with no data: This option will only consider a “No Data” value as a violation. If there is a delay in the time we receive a datapoint that does not match the defined polling interval, this will not be considered a violation, as long as the datapoint is valid.
Calculation Method
As detailed in the How Is the SLA Widget Calculated? section of this support article, there are two calculation methods available when aggregating SLA values among multiple resources. The Percent of all resources available option measures the percentage of time in which resources concurrently met their individual thresholds for acceptable service levels; the Average of all SLA metrics option averages the percentage of time in which acceptable service levels were maintained by the individual resources.
Display
The SLA widget offers three display options:
- Combine SLA Metrics into a single number (display 1 number). The widget will display a single SLA summary value for all websites or resources monitored, which will be calculated using the method selected in the Calculation Method field. If this display option is selected, you have the ability to update the label that displays under the value.
- Show individual SLA Metrics (up to 4). The widget will display up to four individual SLA metrics (as added/saved in the Datapoint table (discussed next)) in its display quadrants. If a metric has more than one resource associated with it, the resources will be aggregated into one overall SLA number using the calculation method selected in the Calculation Method field.
- Show individual SLA Metrics – one per line in table (up to 50). For even more granularity, the widget can display up to 50 of the lowest performing SLA items per datapoint. The quantity can be customized by clicking one of the quantity buttons that dynamically appears upon selecting this option.
If you select the calculation method as Percent all resources available and the Display type as Combined SLA Metrics, then the least SLA value among the resources is displayed.
For example:
There are two resources A and B. The SLA for resource A is 25%, and for resource B is 0%. The selected calculation method is Percent of all resources, and Display type is selected as the Combined SLA Metrics, then the least SLA value displayed is 0%. You may also select the Average of all SLA metrics options for getting the average value of all the resources.
Datapoint Table
Click the + icon located at the top right of the Datapoint table to identify the datapoints that will be tracked by this widget (along with corresponding SLA thresholds that must be met). From the dialog that expands, configure the following fields and options:
- Use the Group, Resource, DataSource, Instance, and Datapoint fields in combination to add a single metric. Multiple metrics can be added, but they must be configured and saved one at a time.
- For each datapoint, specify the DataSource SLA Threshold using the dropdown operator menu and field immediately to the right of it. If you’d like to refer to the global thresholds (warning, error, and critical) already established for this datapoint for help in determining the threshold for this widget, click the View current Global Thresholds (for reference) hyperlink to display them.
- Check the Exclude SDT periods checkbox to remove scheduled downtime (SDT) from the SLA calculations. SDT exclusion can be set at the resource or group level. If the exclusion is set at the resource level, then only SDT set at the resource level will be excluded from the SLA calculation. Any SDT set at the group level for those resources will NOT be excluded in this case. If the exclusion is set at the group level, then only SDT set at the group level will be excluded from the SLA calculation. For example, consider that you have SDT set for a group from 8-9pm each Wednesday. One of the resources in the group additionally has SDT set for 5-6pm each Thursday. If this option is configured for the resource level, the Thursday 5-6pm SDT will be excluded. If this option is configured for the group level, the Wednesday 8-9pm SDT period will be excluded.
- If you selected either of the Show individual SLA Metrics options, use the Label field to add a custom display label for the current metric.
