
Digital Experience Monitoring
Digital experience monitoring (DEM) uses synthetic monitoring and RUM to catch performance issues before users notice them, covering DNS, CDN, and every Internet path in between.


Denton Chikura
The quick download:
DEM extends your monitoring strategy from infrastructure to the full user journey.
-
Synthetic monitoring proactively tests application paths before real users hit them, catching payment failures, broken forms, and integration errors during development.
-
Real User Monitoring (RUM) tracks actual user sessions in real time, enabling faster root cause analysis and data-driven SLA improvements.
-
DEM extends coverage to components you don’t directly control, including DNS, CDN, and ISP networks, where performance bottlenecks often hide.
-
Pair DEM with your existing infrastructure, APM, and log monitoring tools to build a complete, unified monitoring strategy without duplicating coverage.
What is digital experience monitoring?
As more applications move to public cloud infrastructure, IT teams lose the direct visibility they had in traditional data centers. The tradeoff between complexity and observability is most pronounced in public cloud computing.
Public cloud infrastructure reduces the burden of managing your own infrastructure. At the same time, the downside is reduced control over the systems you use and, therefore, lower visibility into usage.
Digital Experience Monitoring (DEM) builds on your existing monitoring foundation to address this tradeoff directly. As defined in Gartner’s Market Guide for DEM,
“Digital experience monitoring (DEM) is a performance analysis discipline that supports the optimization of the operational experience and behavior of a digital agent, human or machine, with the application and service portfolio of enterprises. These users, human or digital, can be a mix of external users outside the firewall and inside it. This discipline also seeks to observe and model the behavior of users as a flow of interactions in the form of a customer journey.”
Another way to think about DEM is that users’ actions are observable through the frontend user interfaces and the backend APIs, as the transactions they initiate flow through the systems. More importantly, what’s measured is the quality of their experience. By understanding the friction points in the overall user journey, business owners can deliver a better customer experience and improve retention and revenue.
Types of digital experience monitoring
There are two main types of technology that can support DEM:
Both techniques work with applications hosted in public cloud environments with complex transaction journeys. It’s important to incorporate multiple DEM strategies to ensure applications run as intended and are optimized for the user experience.
Synthetic monitoring
Synthetic monitoring, or active monitoring, uses technology to emulate the journey a user might take when interacting with an application. Synthetic monitoring deploys scripts that generate multiple permutations of random paths, covering a wide range of user interaction scenarios.
These paths vary in many details, such as browser type, user locales, different journeys (e.g., completing a form or a purchase pipeline), latency, and other variables. This is important because all user scenarios are hard to catch during development, even with extensive end-to-end and integration testing.
Synthetic monitoring solutions are automatic and can give insight into application performance across different user scenarios. This is especially useful for ensuring errors in business transactions are caught before deployment. For example, during a checkout process, it can catch when a payment method fails due to a bad API call or an invalid database transaction by generating a scenario that tests these different paths.
Real user monitoring
Where synthetic monitoring mimics user interactions, RUM tracks actual user activity across an application.
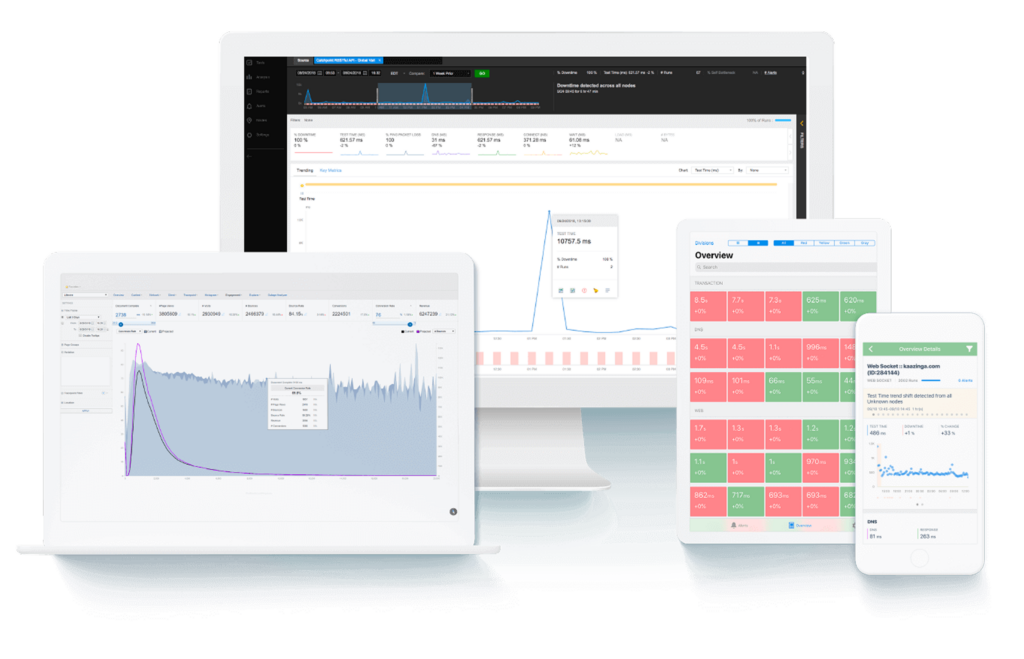
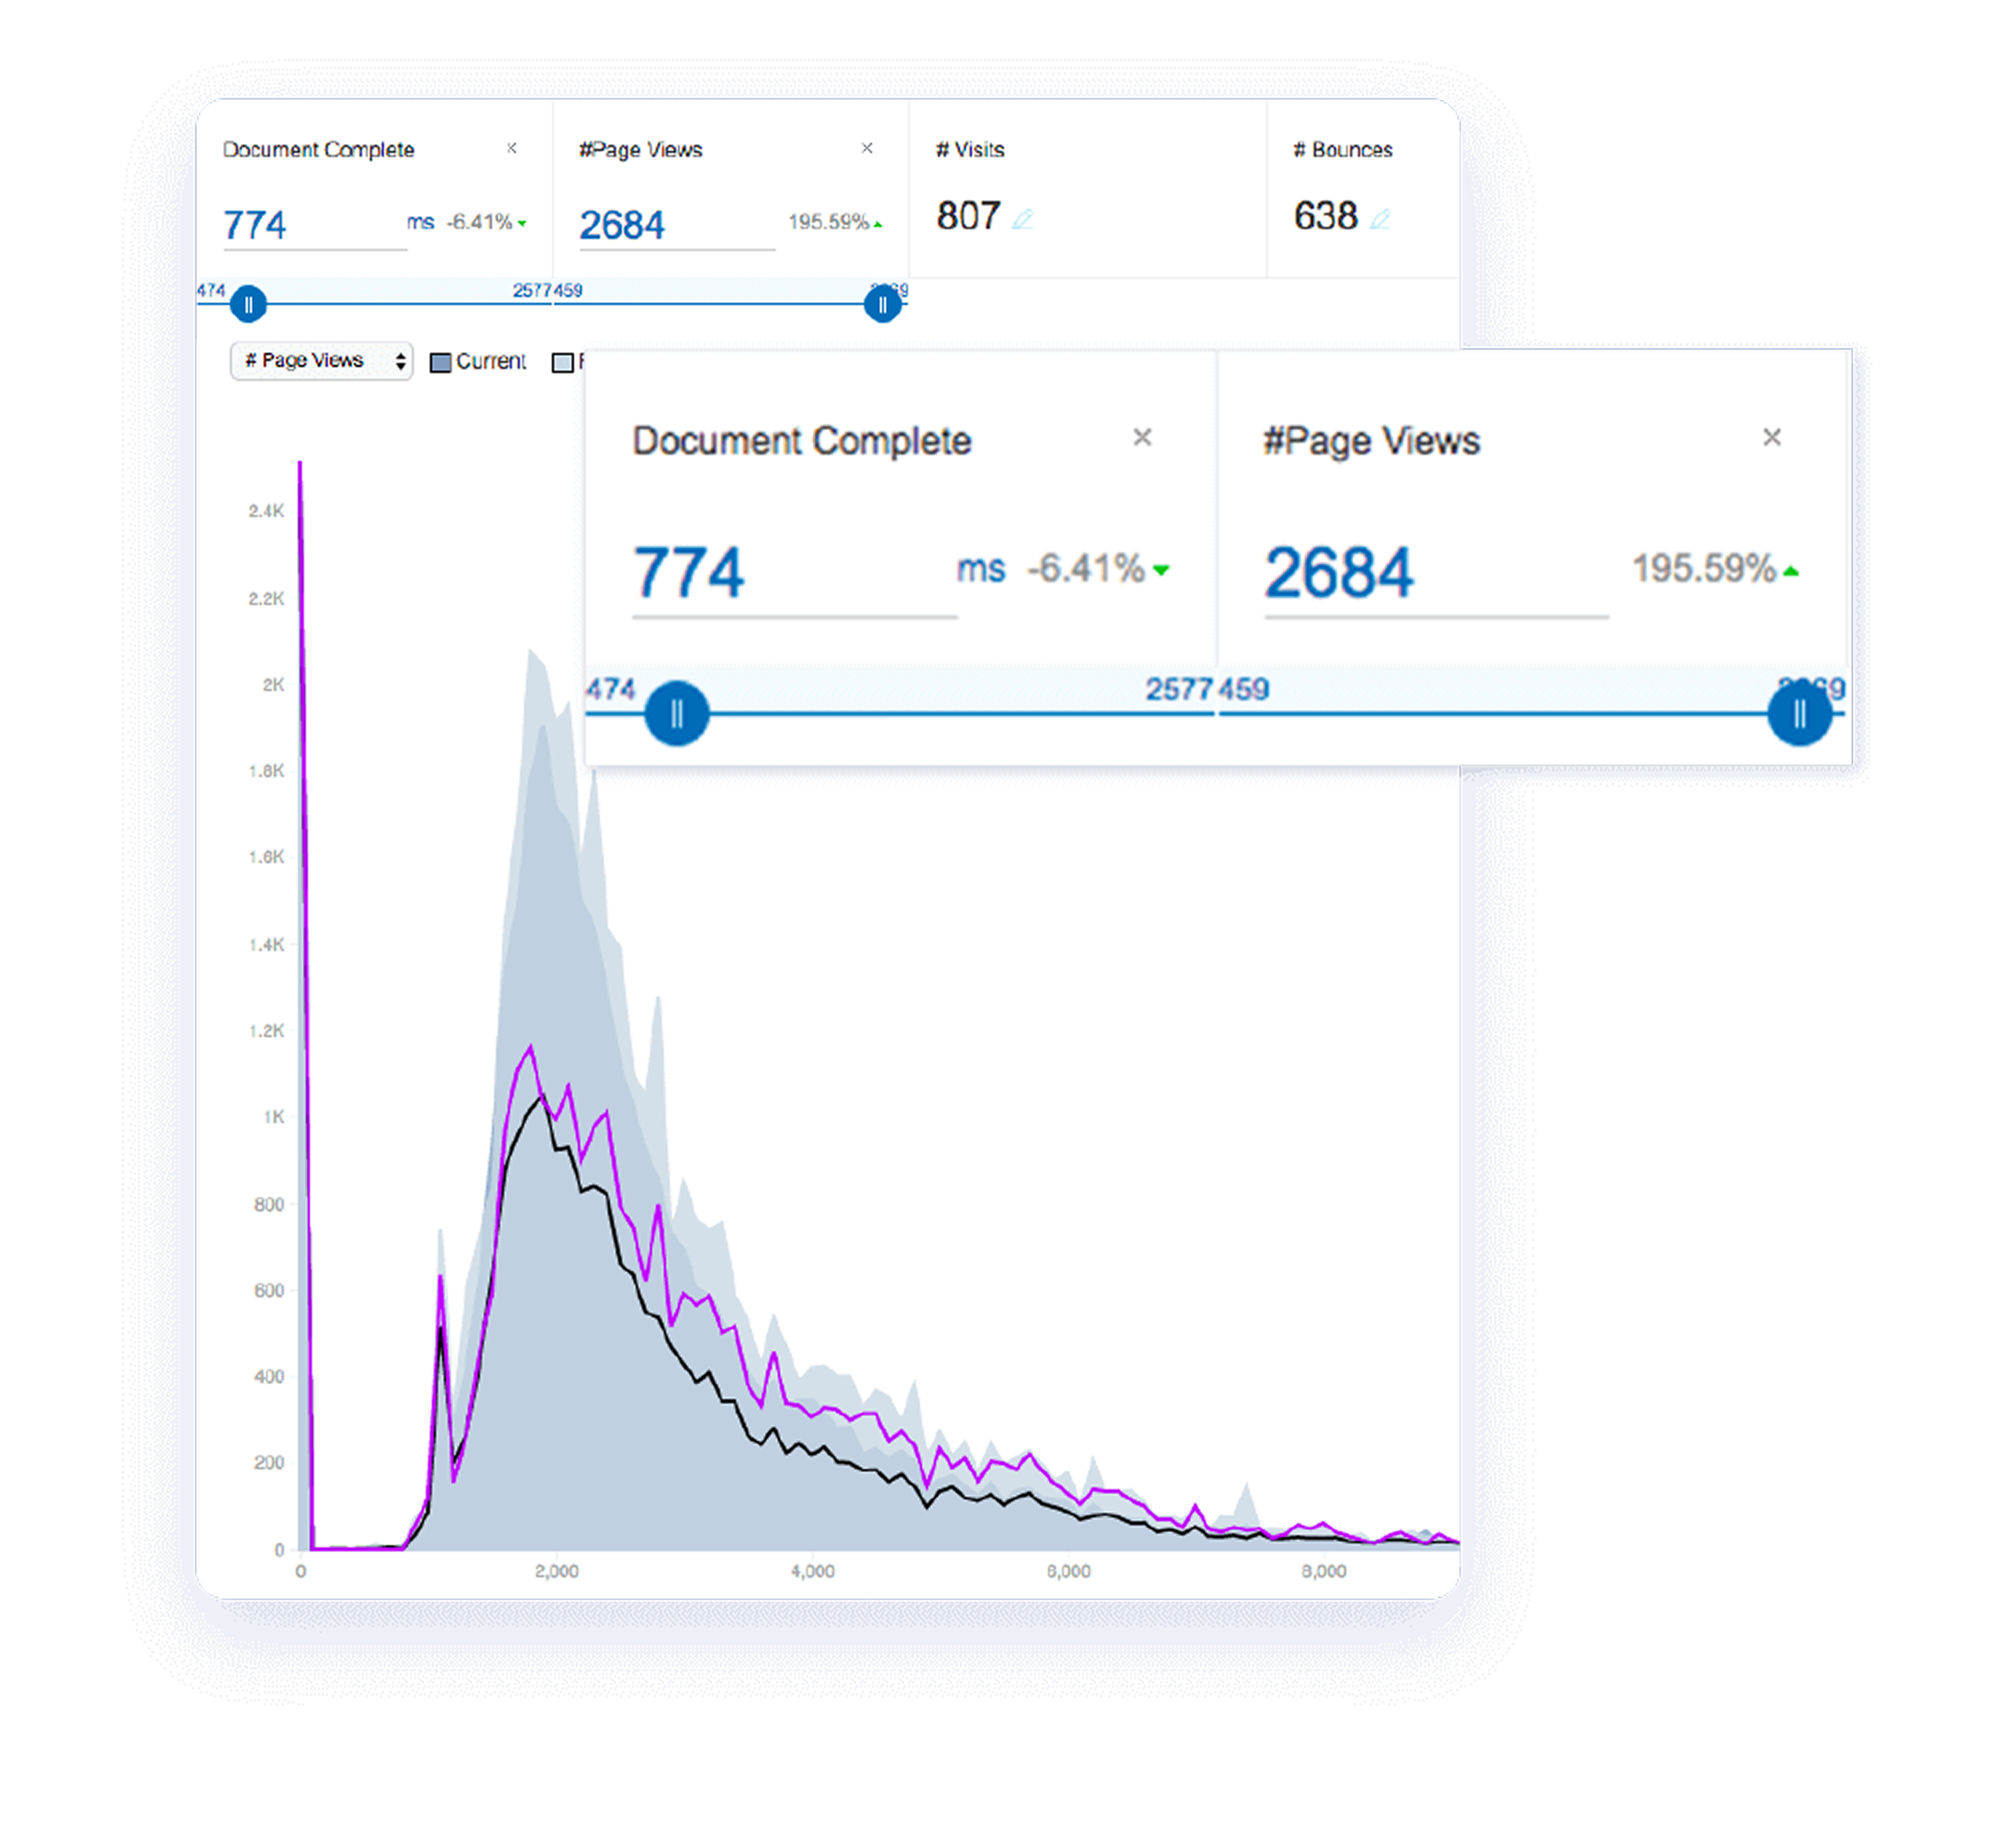
RUM solutions often include a dashboard to visualize, in real time, the number of user sessions an application supports, a user’s path during a session, demographic data, and user metadata (browser type, location, etc.).
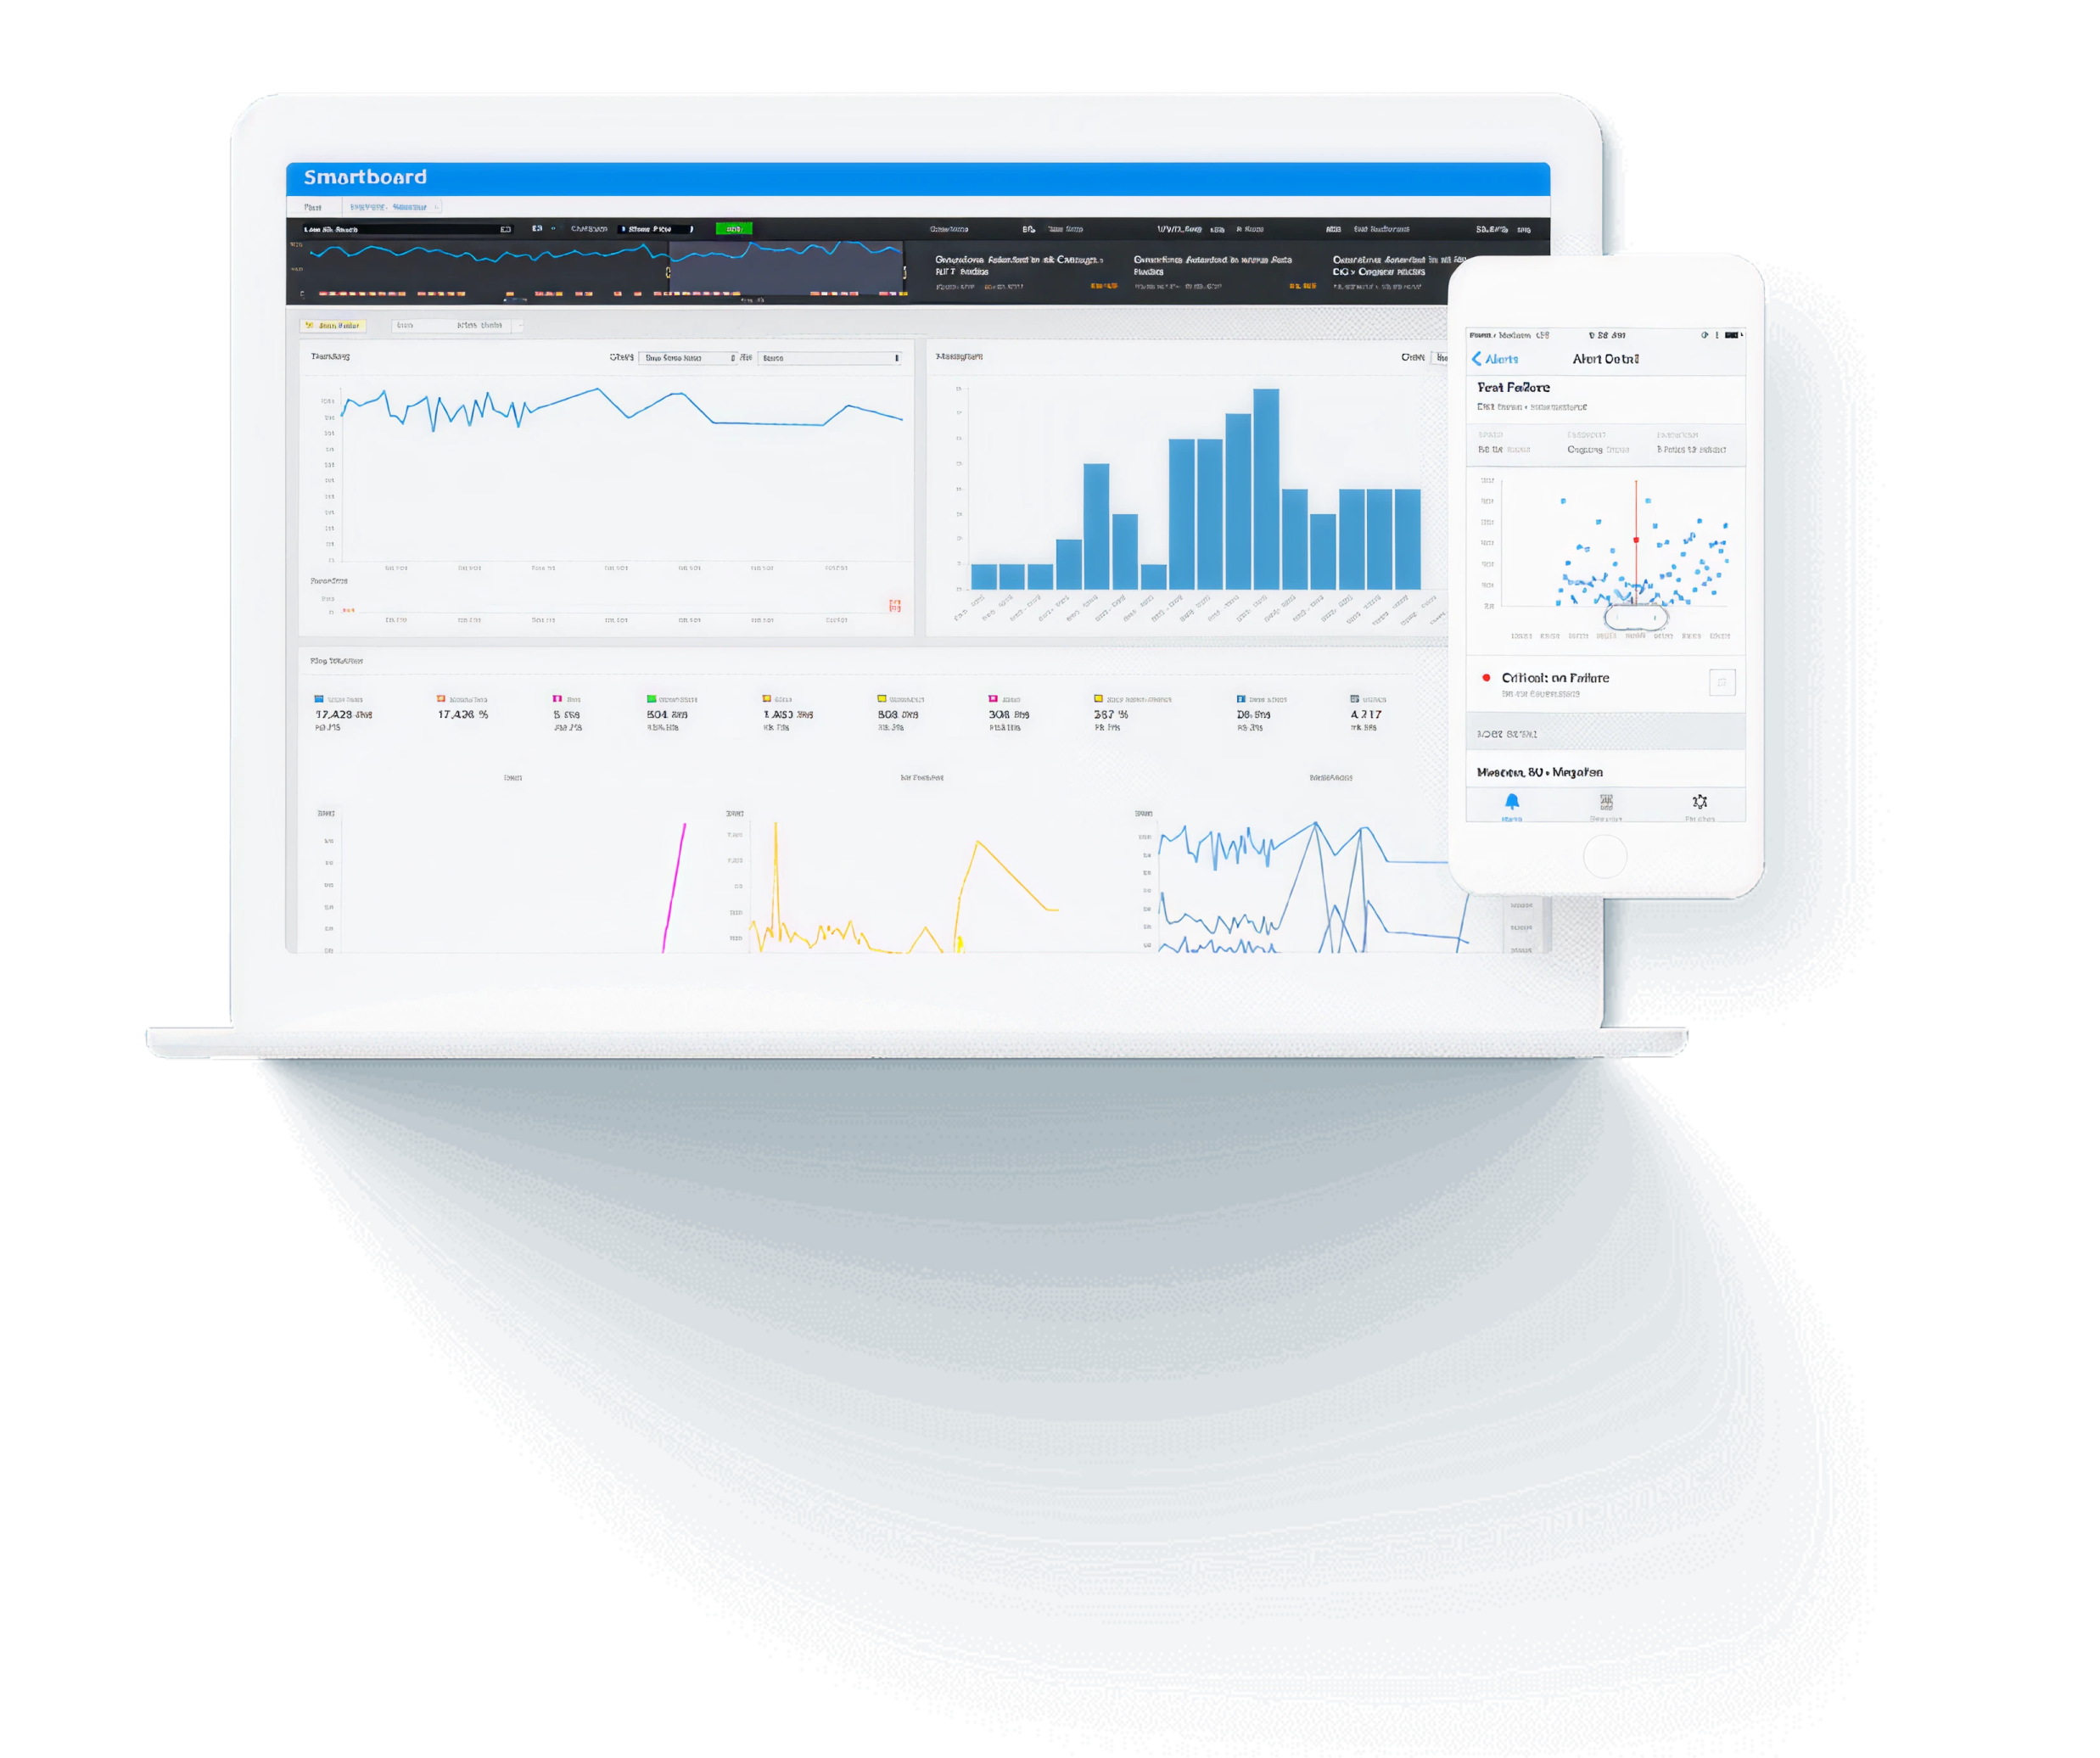
RUM solutions also provide multiple ways to analyze this data. For example, when there’s a critical issue (like a server outage or unavailability of resources), RUM solutions allow administrators to pinpoint affected transactions, trace it to an origin when the issue occurred, and even show the affected users. RUM thus facilitates root cause analysis (RCA) by providing a way to monitor in real-time.
Why DEM?
DEM extends performance visibility beyond the application code to include the user journey, DNS, CDN, and ISP networks. Combined with Application Performance Monitoring (APM), it gives teams a unified view from end user to underlying infrastructure.
DEM focuses on a more general area that includes IoT, software applications, networks, infrastructure, and other areas, emphasizing performance from the user’s perspective. APM covers application performance from the software code’s perspective (how many times the code was executed, how long it took to complete, and if it ended in an error).
Although the two are different, they work together to provide a complete view of application performance, from code execution through infrastructure to end-user experience. DEM adds the outside-in perspective that connects user-facing symptoms to their root causes deeper in the stack.
Components you don’t control directly, such as DNS (domain name service) and CDN (content delivery network), can affect the end-to-end digital experience. DEM covers these as well. This functionality is valuable because an application distributed across the Internet is inherently complex, and a performance bottleneck can occur anywhere along its transaction path.
DEM improves system resiliency by detecting issues before users encounter them. When paired with infrastructure monitoring, logs, traces, and AI-assisted correlation, it helps teams trace user-facing symptoms back to the responsible component, whether that’s a DNS provider, a CDN edge node, or an internal service.
Use cases and best practices
It’s important to know when to use synthetic monitoring and RUM. We have organized typical use cases in the table below.
| DEM Solution | Use Case | Example |
|---|---|---|
| Synthetic Monitoring | Test application features that are still in development. Its benefits come from proactively preventing unforeseen issues. | Developers are working on a new account-creation portal that incorporates various third-party integrations and must support multiple account types. |
| Detect unknown problems when user traffic is low. Facilitate pinpointing issues by emulating workload when launching an entirely new product or feature before the application has any significant traffic. | ||
| RUM | Root Cause Analysis (RCA). Pinpoint the origin of a failure and collect data to speed up remediation. | Leadership is interested in improving service level agreements based on historical application performance data. |
| Analyze performance trends over time to inform reactive measures that improve user experience. The support team wants to diagnose a problem that only a small subset of users is experiencing. |
Some common pitfalls to avoid are:
- Plan for application changes. Synthetic monitoring isn’t resilient to user interface changes. A small change could break the testing harness and cause false alerts. The best practice is to include a step in the continuous integration/continuous delivery (CI/CD) process to validate that the changes won’t break the existing monitoring.
- Create a proposal outlining your monitoring needs. DEM solutions, such as synthetic monitoring, require planning and discussion with engineers. Don’t implement a solution without taking the time to document your organization’s requirements. Read this guide to the must-have synthetic monitoring features.
How LogicMonitor achieves DEM
DEM is a discipline, not a product. What determines whether you actually achieve it is how your monitoring reaches users, and most implementations fall short in the same way: they run synthetic tests from cloud infrastructure. That tells you how your application performs cloud-to-cloud, not how it performs for a user on a home broadband connection in Frankfurt, a mobile carrier in Chicago, or a corporate network in Singapore.
LM Internet Performance Monitoring, powered by Catchpoint, is the bedrock of LogicMonitor’s DEM capabilities, measuring performance from where users actually are rather than from cloud infrastructure. That means thousands of vantage points across ISPs, wireless carriers, enterprise networks, and last-mile connections globally. Synthetic monitoring and RUM run from those real-world locations, not from cloud nodes, so the data reflects the conditions users actually experience.
LM Internet Performance Monitoring delivers Internet infrastructure visibility that most DEM tools don’t reach. Where standard DEM tells you that users in a region are experiencing degraded performance, LM Internet Performance Monitoring can tell you whether the cause is a BGP routing change, a DNS resolution failure, or a CDN delivery issue, and whether it’s inside your infrastructure or somewhere on the Internet path outside your control. Having that depth of visibility in the same platform as your synthetic and RUM data is what makes root cause analysis across the full delivery chain practical rather than theoretical.
That data connects directly into LM Envision’s infrastructure and application telemetry. Edwin AI reasons across all of it, correlating a degraded RUM session with a BGP route change, a CDN edge issue, or a spike in DNS resolution time, and surfacing the likely cause rather than leaving the team to piece it together manually. The result is a complete view from user experience to underlying cause, across both the Internet path and the internal stack.
Most monitoring strategies cover what’s inside the firewall well. The harder part is maintaining the same quality of visibility across the Internet path, where you have no direct control over the infrastructure and no native telemetry. That’s the gap LogicMonitor, through Catchpoint, closes.
CHAPTERS
NEWSLETTER
Subscribe to our newsletter
Get the latest blogs, whitepapers, eGuides, and more straight into your inbox.
SHARE
See how Catchpoint delivers the Internet performance visibility your users depend on.
Catchpoint IPM delivers deep visibility into the Internet infrastructure carrying your users’ traffic: DNS, CDN, BGP, and ISP networks, helping your team alert on what matters and debug faster when incidents happen.
FAQs
What’s the difference between synthetic monitoring and real user monitoring?
Both are tools within IPM’s arsenal. Synthetic monitoring uses scripted tests to emulate user journeys from real-world vantage points, catching issues proactively even when no real traffic exists. RUM tracks actual user sessions, showing how real users experience your application across different networks, carriers, and locations. Synthetic is best for pre-deployment testing and low-traffic periods. RUM is best for root cause analysis and tracking performance trends over time.
Can DEM replace Application Performance Monitoring (APM)?
No, and it shouldn’t try to. APM monitors your application from the inside: code execution, database performance, error rates. IPM monitors from the outside in, covering the DNS, CDN, BGP, and ISP infrastructure between your systems and your users. DEM is what you achieve when both are working together in the same platform.
What’s the relationship between IPM and DEM?
IPM is the outside-in discipline that makes DEM achievable. It covers the Internet path that APM and infrastructure monitoring can’t see. Synthetic monitoring and RUM are the tools IPM uses to measure that path. DEM is the outcome: full visibility from user experience back to underlying cause, across both the Internet path and the internal stack.
How should I get started?
Start by identifying the user journeys that matter most to your business and mapping the Internet path they travel. Deploy synthetic monitoring from real-world vantage points to test those journeys proactively, and add RUM to understand how real users experience them across different networks and locations. Connect that data with your existing infrastructure, APM, and log monitoring so root cause analysis works across the full delivery chain, not just the parts you directly control.

By Denton Chikura
Technical Writer

Denton Chikura is a technical writer and longtime observability advocate focused on helping site reliability engineers and engineering teams discover the tools and capabilities that strengthen internet resilience. He works at the intersection of monitoring, performance, and infrastructure to make complex systems more understandable and usable, bridging the gap between deep technical detail and real‑world operations. His goal is to help teams build faster, detect issues earlier, and recover smarter, ultimately making the internet a better, more reliable place for everyone.
Disclaimer: The views expressed on this blog are those of the author and do not necessarily reflect the views of LogicMonitor or its affiliates.
© LogicMonitor 2026 | All rights reserved. | All trademarks, trade names, service marks, and logos referenced herein belong to their respective companies.
