
SLA Widget
Last updated – 25 March, 2026
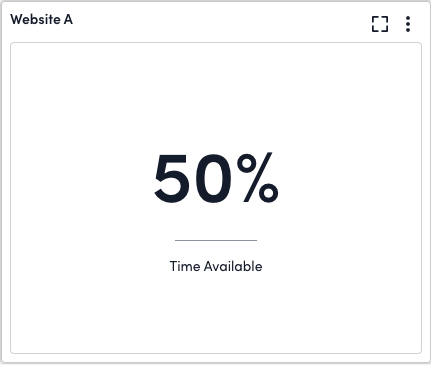
The SLA (Service Level Agreement) widget calculates the percentage of time the acceptable service levels were maintained for resources or websites included in the widget. You can define the acceptable service levels in the widget’s configurations.
SLA Widget Calculations
The SLA widget calculation is the amount of time the individual resource or website met its acceptable service levels as compared to the amount of time covered by your SLA.
Note: SLAs can include time periods that are not under consideration in their calculations. For example, regularly scheduled outages for updates or backups.
However, if you want your widget to display a single percentage that represents the overall SLA value for the websites or resources being monitored, there are additional calculations that take place, as shown in the following table:
| Entity Calculated | Description | Example |
| Websites and Resources | The overall SLA summary value is calculated by averaging the percentage of time that acceptable service levels were maintained by the individual websites or resources. | For example, an SLA widget is measuring the availability of the following four websites over a one-day period:
|
| Resources | You measure the percentage of time in which all resources concurrently met their individual thresholds for acceptable service levels. | For example, an SLA widget is measuring performance thresholds for the following four resources over a one-day period:
|
Configuring an SLA Widget for Resources
- In LogicMonitor, navigate to Dashboards, select a current Dashboard or create new, and then add an Advanced Metrics widget.
For more information, see Dashboard Creation.
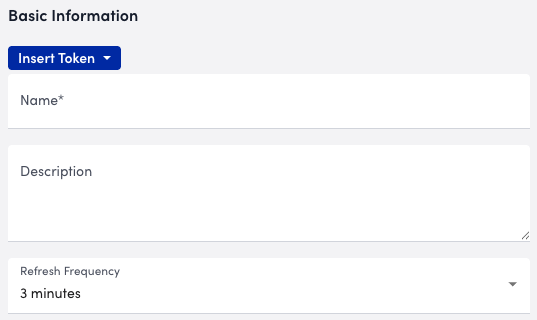
For more information, see Widget Creation. - Configure the Basic Information settings.
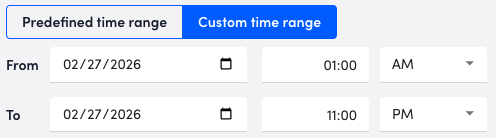
For more information, see Configuring Standard Widget Settings. - Select whether to configure a predefined time range or custom time range for the widget by doing the following:
- To configure a predefined time range for the widget, select Predefined time range and then choose a time range option.
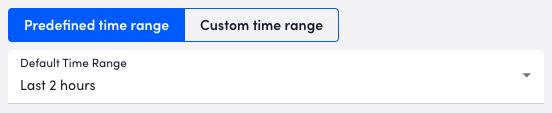
- To configure a custom time range for the widget, select Custom time range and then configure the time range settings.
- To configure a predefined time range for the widget, select Predefined time range and then choose a time range option.
- In the SLA Options section, select Resource.
- In the SLA Period section, do the following to configure the days and time range for the SLA period:Note: These settings reflect the time range of your SLA sand not the time range of the widget.
- Select the days you want to include in the SLA period.
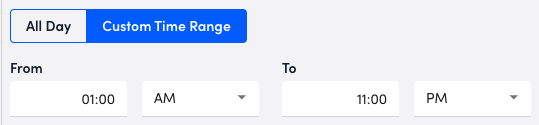
All days are selected by default. - Configure the time range for the SLA period by doing one of the following:
- To span the SLA over all 2 hours of the selected days, select All Day.
- To span the SLA over partial days select Custom Time Range, and then configure the range to apply to each day that the SLA spans.
- Select the days you want to include in the SLA period.
- From the Time Zone dropdown, select the applicable time zone.
- From the Behavior When No Data Is Selected dropdown, select one of the following to establish the impact that no reported data has on the SLA calculation:
- To consider unmonitored time in the SLA calculations, select “Subtract from total possible time.”
- To consider unmonitored time as a violation against your SLA, select “Subtract from uptime.”
- To consider unmonitored time as meeting SLA requirements, select “Add to uptime.”
- To consider time delay or receiving data, select “Collector delay with no data.”
For this option, a delay is considered when the data comes within the set poll interval delay time. However, if the data comes after the set poll interval delay time, it will be considered as system down.
In addition, if you change the set poll interval time, the SLA calculation might be affected, and an incorrect SLA is displayed.
- From the Metrics Display Behavior dropdown, select one of the following to configure how the metrics display in the widget:Note: The value that is calculated is determined using the method selected in the Calculation Method field.
- To display a single SLA summary value for all resources monitored, select “Aggregate SLA metrics and display one number.”
- To display up to four individual SLA metrics (as saved in the Datapoint table) in its display quadrants, select “Display up to four SLA metrics.”
If a metric has more than one resource associated with it, the resources are aggregated into one overall SLA number using the calculation method selected in the Calculation Method field. - To display up to 50 of the lowest performing SLA items per datapoint, select “Display up to 50 SLA metrics in table.”
- In the Bottom Label field, enter a bottom label to identify the resource this SLA is for in the widget.
You can leverage tokens in this field.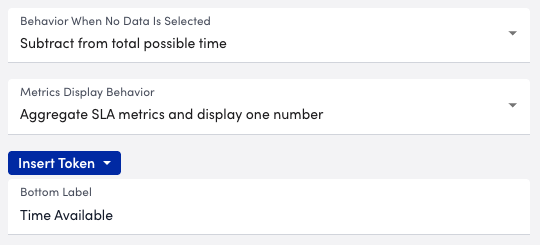
- In the SLA Items settings, select Add Record, and then do the following:
- Add datapoints.
For more information see Widget Datapoint Configurations. - In the DataSource SLA Threshold section, configure the Datapoint value must be setting to determine the thresholds for this widget.
You can use the Current global thresholds for reference.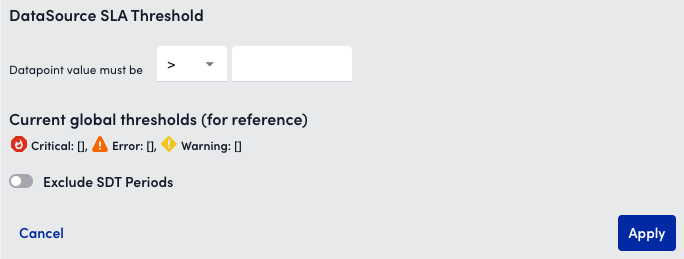
- To remove scheduled downtime (SDT) from the SLA calculations, toggle on Exclude SDT Periods, and then select one of the following:Note: These thresholds are not connected to the alert thresholds, so having a number show up as a color (even though they are the same colors) does not result in LogicMonitor alerting you.
- To exclude only SDT set at the resource level from the SLA calculation, select Resource.
Any SDT set only at the group level is considered an outage and counts as downtime for the SLA. - To exclude only SDT set at the group level from the SLA calculation, select Resource Group.
- To exclude only SDT set at the resource level from the SLA calculation, select Resource.
- (Applies to the “Display up to 50 SLA metrics in table” option in the Metrics Display Behavior dropdown only) In the Bottom Label field, enter a bottom label to identify this datapoint.
- Select Apply.
You can add as many datapoints as needed.
- Add datapoints.
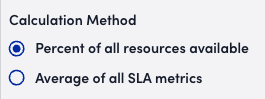
- In the Calculation Method section, select one of the following:
- To measure the percentage of time that resources concurrently met their individual thresholds for acceptable service levels, select Percent of all resources available.
- To average the percentage of time that acceptable service levels are maintained by the individual resources, select Average of all SLA metrics.
- In the Display Settings section, configure the following for how you want the widget to display on your Dashboard:
- (Applies to the “Display up to 50 SLA metrics in table” option in the Metrics Display Behavior dropdown only) From the Quantity to Display dropdown, select how many results you want displayed.Note: The widget supports a maximum of 50 total items.
- To enable up to three varying colors to display depending on the current SLA value, toggle on Change Number Color According To Thresholds.
For example, you can configure your SLA widget to display any SLA values lower than 97% in red. This is an excellent way to provide at-a-glance indicators for the general wellbeing of the resources or websites being monitored.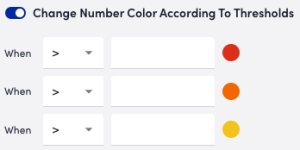 Note: These thresholds are not connected to the alert thresholds, so having a number show up as a color (even though they are the same colors) does not result in LogicMonitor alerting you.
 - (Applies to the “Display up to 50 SLA metrics in table” option in the Metrics Display Behavior dropdown only) To display the thresholds defined as percentage bars, toggle on Show percentage bar.
- (Applies to the “Display up to 50 SLA metrics in table” option in the Metrics Display Behavior dropdown only) From the Quantity to Display dropdown, select how many results you want displayed.
- Configure the Widget Color Schema settings.
For more information, see Configuring Standard Widget Settings. - Select Save.
Configuring an SLA Widget for Websites
- In LogicMonitor, navigate to Dashboards, select a current Dashboard or create new, and then add an Advanced Metrics widget.
For more information, see Dashboard Creation.
For more information, see Widget Creation. - Configure the Basic Information settings.
For more information, see Configuring Standard Widget Settings. - Select whether to configure a predefined time range or custom time range for the widget by doing the following:
- To configure a predefined time range for the widget, select Predefined time range and then choose a time range option.
- To configure a custom time range for the widget, select Custom time range and then configure the time range settings.
- To configure a predefined time range for the widget, select Predefined time range and then choose a time range option.
- In the SLA Options section, select Website.
- In the SLA Period section, do the following to configure the days and time range for the SLA period:Note: These settings reflect the time range of your SLA sand not the time range of the widget.
- Select the days you want to include in the SLA period.
All days are selected by default. - Configure the time range for the SLA period by doing one of the following:
- To span the SLA over all 2 hours of the selected days, select All Day.
- To span the SLA over partial days select Custom Time Range, and then configure the range to apply to each day that the SLA spans.
- Select the days you want to include in the SLA period.
- From the Time Zone dropdown, select the applicable time zone.
- In the SLA Items settings, select Add Record, and then do the following:
- In the Website Group Name field, enter a website group name and select it from the results list or enter a * glob expression to select all website groups.
- In the Website Name field, enter a name of a website within the group you selected and select it from the results or enter a * glob expression to select all websites within the selected website group.
- To remove the scheduled downtime (SDT) from the SLA calculations, toggle on Exclude SDT Periods.
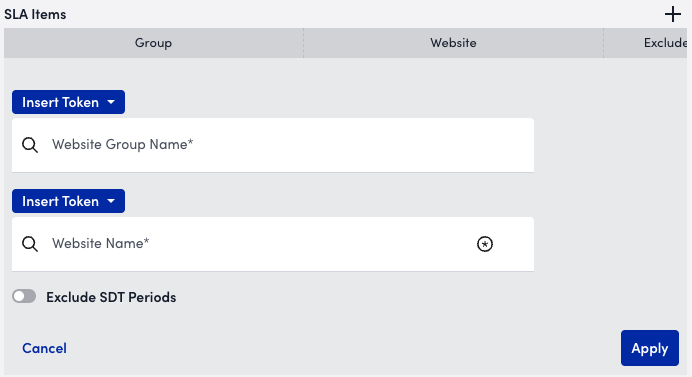
- Select Apply.
You can add as many website datapoints as needed.
- In the Display Settings section, enable up to three varying colors to display depending on the current SLA value, toggle on Change Number Color According To Thresholds.
For example, you can configure your SLA widget to display any SLA values lower than 97% in red. This is an excellent way to provide at-a-glance indicators for the general wellbeing of the resources or websites being monitored.
Note: These thresholds are not connected to the alert thresholds, so having a number show up as a color (even though they are the same colors) does not result in LogicMonitor alerting you.
- Configure the Widget Color Schema settings.
For more information, see Configuring Standard Widget Settings. - Select Save.
