
Turn Log Management Into Log Intelligence
Correlate metrics, logs, and traces with contextual events automatically. Surface anomalies cut noise, and get to root cause faster—no query language or context switching required.
Correlate metrics, logs, and traces with contextual events automatically. Surface anomalies cut noise, and get to root cause faster—no query language or context switching required.
Teams fix problems faster when log data, metrics, and alerts are already connected—no context switching, no dead ends.
Real-time insight into patterns and anomalies helps you catch problems early and avoid costly escalations.
You won’t waste time chasing false alarms or digging through noise. Just see clear signals when something needs action.
When everyone works from the same log data in one platform, silos shrink and handoffs get smoother.
You don’t need to ingest everything—just the logs that matter most, stored and routed where they add value.
Whether it’s an outage, an audit, or an investigation, you’ll always have the log data you need—no scrambling, no gaps.
OBSERVABILITY POWERED BY LOGICMONITOR ENVISION AND EDWIN AI
LM Envision’s Logs connects the dots between your logs, metrics, and alerts in real time—no context switching, no query language, no waiting. With built-in anomaly detection, pattern recognition, and automated log analysis, you can reduce noise, eliminate blind spots, and troubleshoot faster in a single platform.
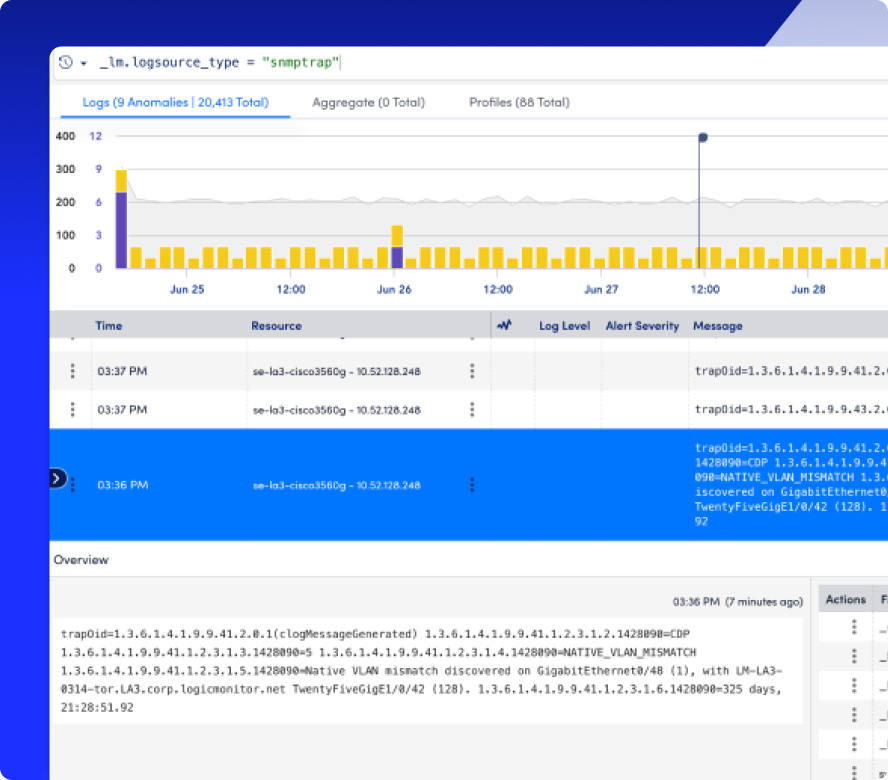
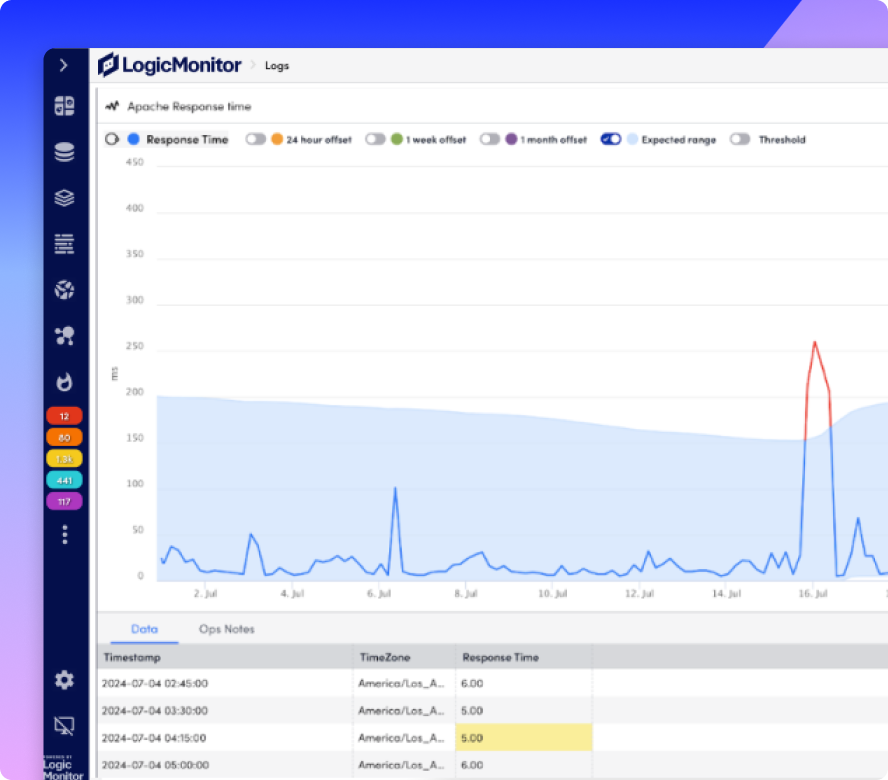
Automatically highlight never-before-seen log events and behaviors, so you can act on the early signs of an issue before it spreads.
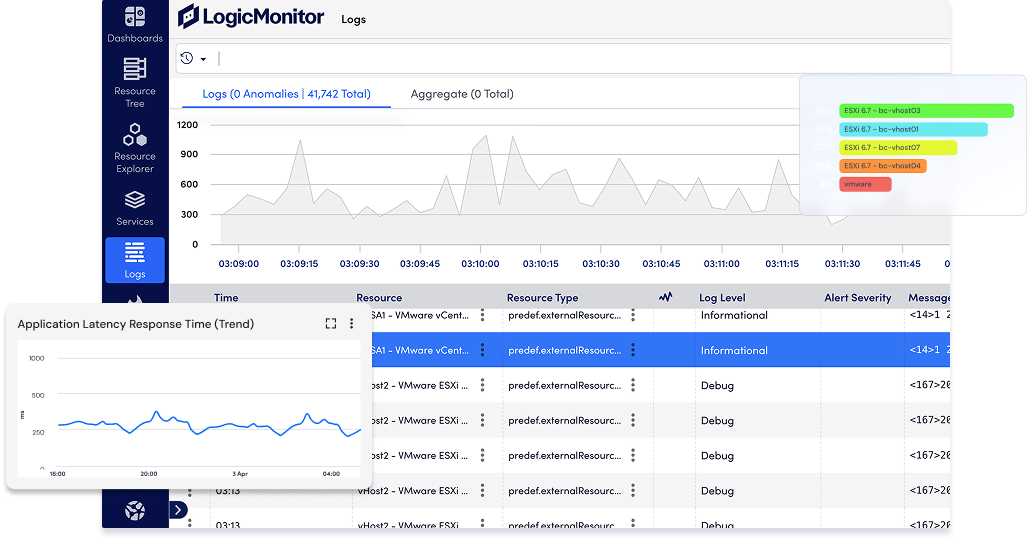
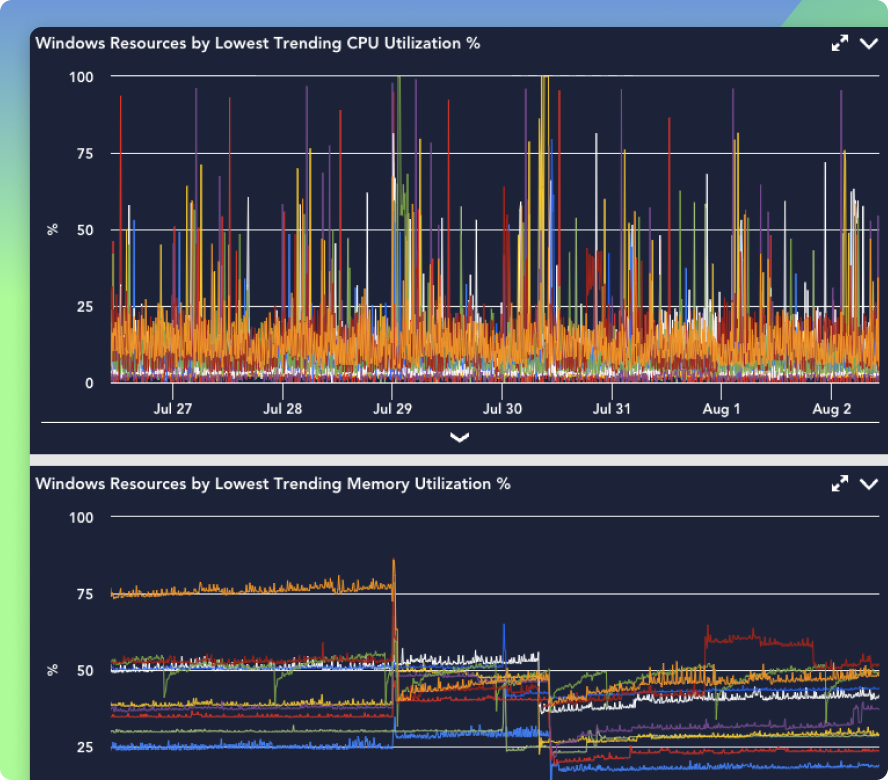
Search, filter, and visualize log activity across applications, services, and infrastructure—no query language required. Spot trends, track unusual behavior, and investigate changes over time with ease.
Automatically group similar events and highlight what’s different, so you can focus on what’s new, not just what’s loud.
Use Cribl pipelines, log filters, and partitions to fine-tune which logs are ingested, how long they’re kept, and where they’re stored.
Bring log data into context by linking it to alerts, metrics, and the infrastructure it impacts. Automatically map events to monitored resources, so you can stop guessing and start fixing.
INTEGRATIONS
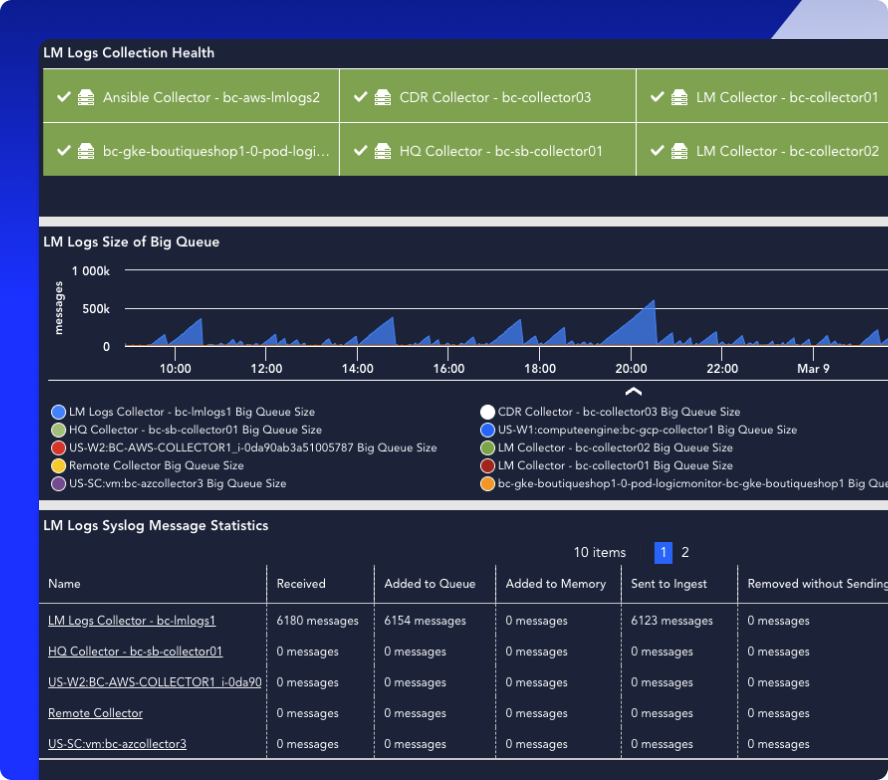
LM Logs plays well with the tools you already use—forwarders, cloud services, SIEMs, and more. Route, transform, and enrich logs before ingestion, or stream directly into LM Logs from any source with an API, syslog, or Fluent Bit pipeline.
1,000+
log sources supported
↑60%
ingest reduction with Cribl
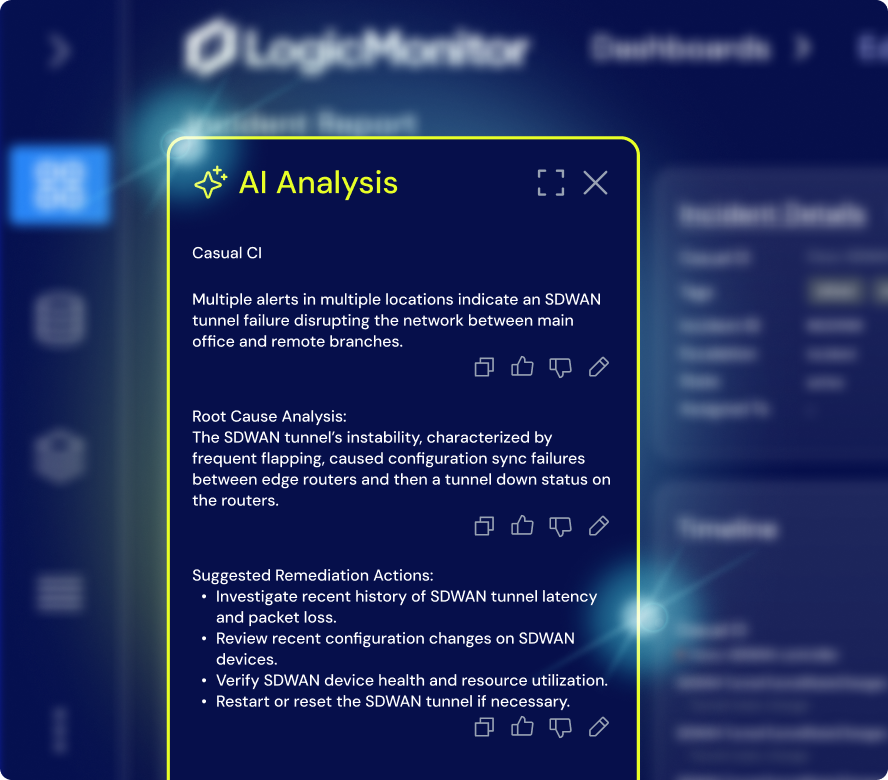
AI AGENT FOR ITOPS
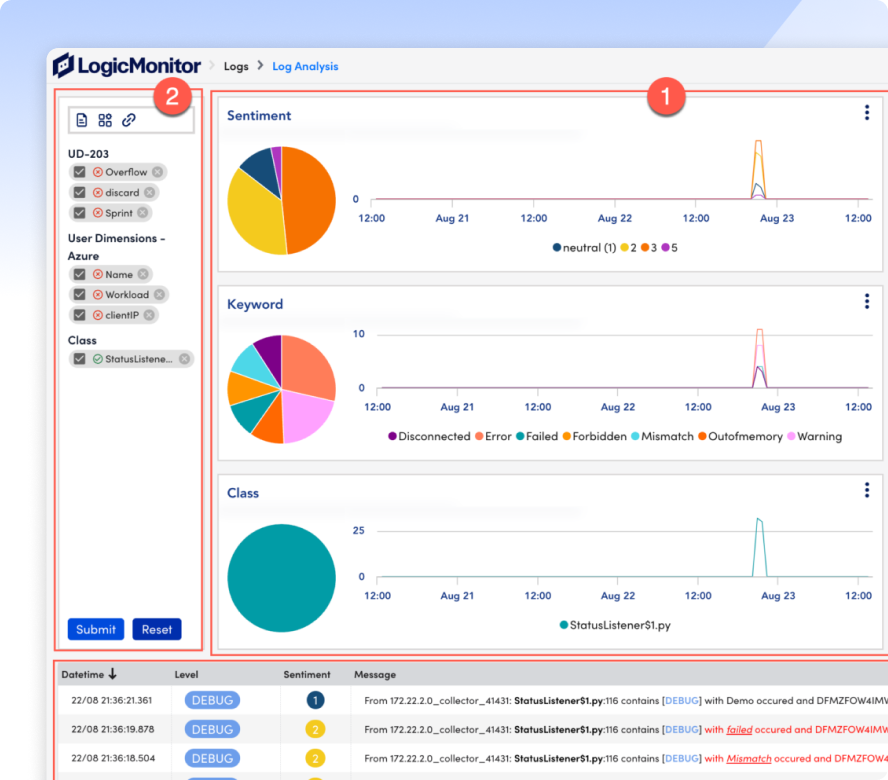
Edwin AI doesn’t just ingest your log data—it understands it. With built-in anomaly detection, log sentiment scoring, and guided investigation, Edwin flags what’s new, what’s risky, and what’s worth your attention before you even ask.
67%
ITSM incident reduction
88%
noise reduction
GET ANSWERS
Get the answers to the top log monitoring, log management, and log analysis questions.
It’s surprisingly simple. LM Logs works out of the box with syslog, Fluent Bit, Fluentd, cloud sources like AWS CloudWatch and Azure Monitor, and more. You can start ingesting logs in minutes using LM Envision’s built-in collectors, or route logs via Cribl or the API for advanced control.
Nope. LM Logs surfaces log anomalies, patterns, and insights automatically. You can drill down, correlate with metrics, and filter all without query language knowledge. For advanced users, our query bar supports regex, saved searches, and tracked queries, but they’re completely optional.
Absolutely. You can filter logs before ingestion using Cribl or Fluent Bit, route specific sources to different partitions, and set retention by log type. LM Logs gives you full control to reduce noise and manage cost without sacrificing visibility.
Logs are automatically enriched and mapped to your monitored resources using hostname, IP, or device properties. This mapping powers our in-context troubleshooting workflows, so alerts, metrics, and logs show up together where they matter most.
Not at all. LM Logs is built for ITOps teams of any size or skill level. With anomaly detection, guided log analysis, and intuitive workflows, even junior responders can investigate issues confidently. And for power users, the platform scales with advanced search, alerting, and integrations when you’re ready.
