
Adding a Service
Last updated – 18 November, 2025
The Services functionality is used for monitoring the health of instances of one or more monitored resources together. From the LogicMonitor navigation sidebar, use the Services tab to create a service.
Note: You cannot directly assign manage permissions to dynamic groups (or services which are a type of dynamic group) as the resources that make up these groups are ever changing. Only administrators and those with admin-level manage permissions to resources.
Creating a service involves the following steps:
- Adding Basic Info – Add information such as name, description, and other.
- Adding Members – Add resources and individual instances to the service you are creating.
- Adding Metrics – Add metrics and complex datapoints to your service.
- Finish creating the service – Continue by creating alerts for the service, or creating another service.
Adding Basic Information to a Service
- From the LogicMonitor left navigation sidebar, select Services. The Services page appears with the Services tree, which contains a root folder and a list of all the available services.
- To select the location for your service, select the root folder or any other service from the Services tree, and select
 Add. The Add dialog box appears with the following options:
- Service: Select Service to create a service by grouping together the instances across one or more monitored resources.
- Service Group: Select Service Group to create a service group by grouping together the services you want.
- Select Service. The Add Service page appears.
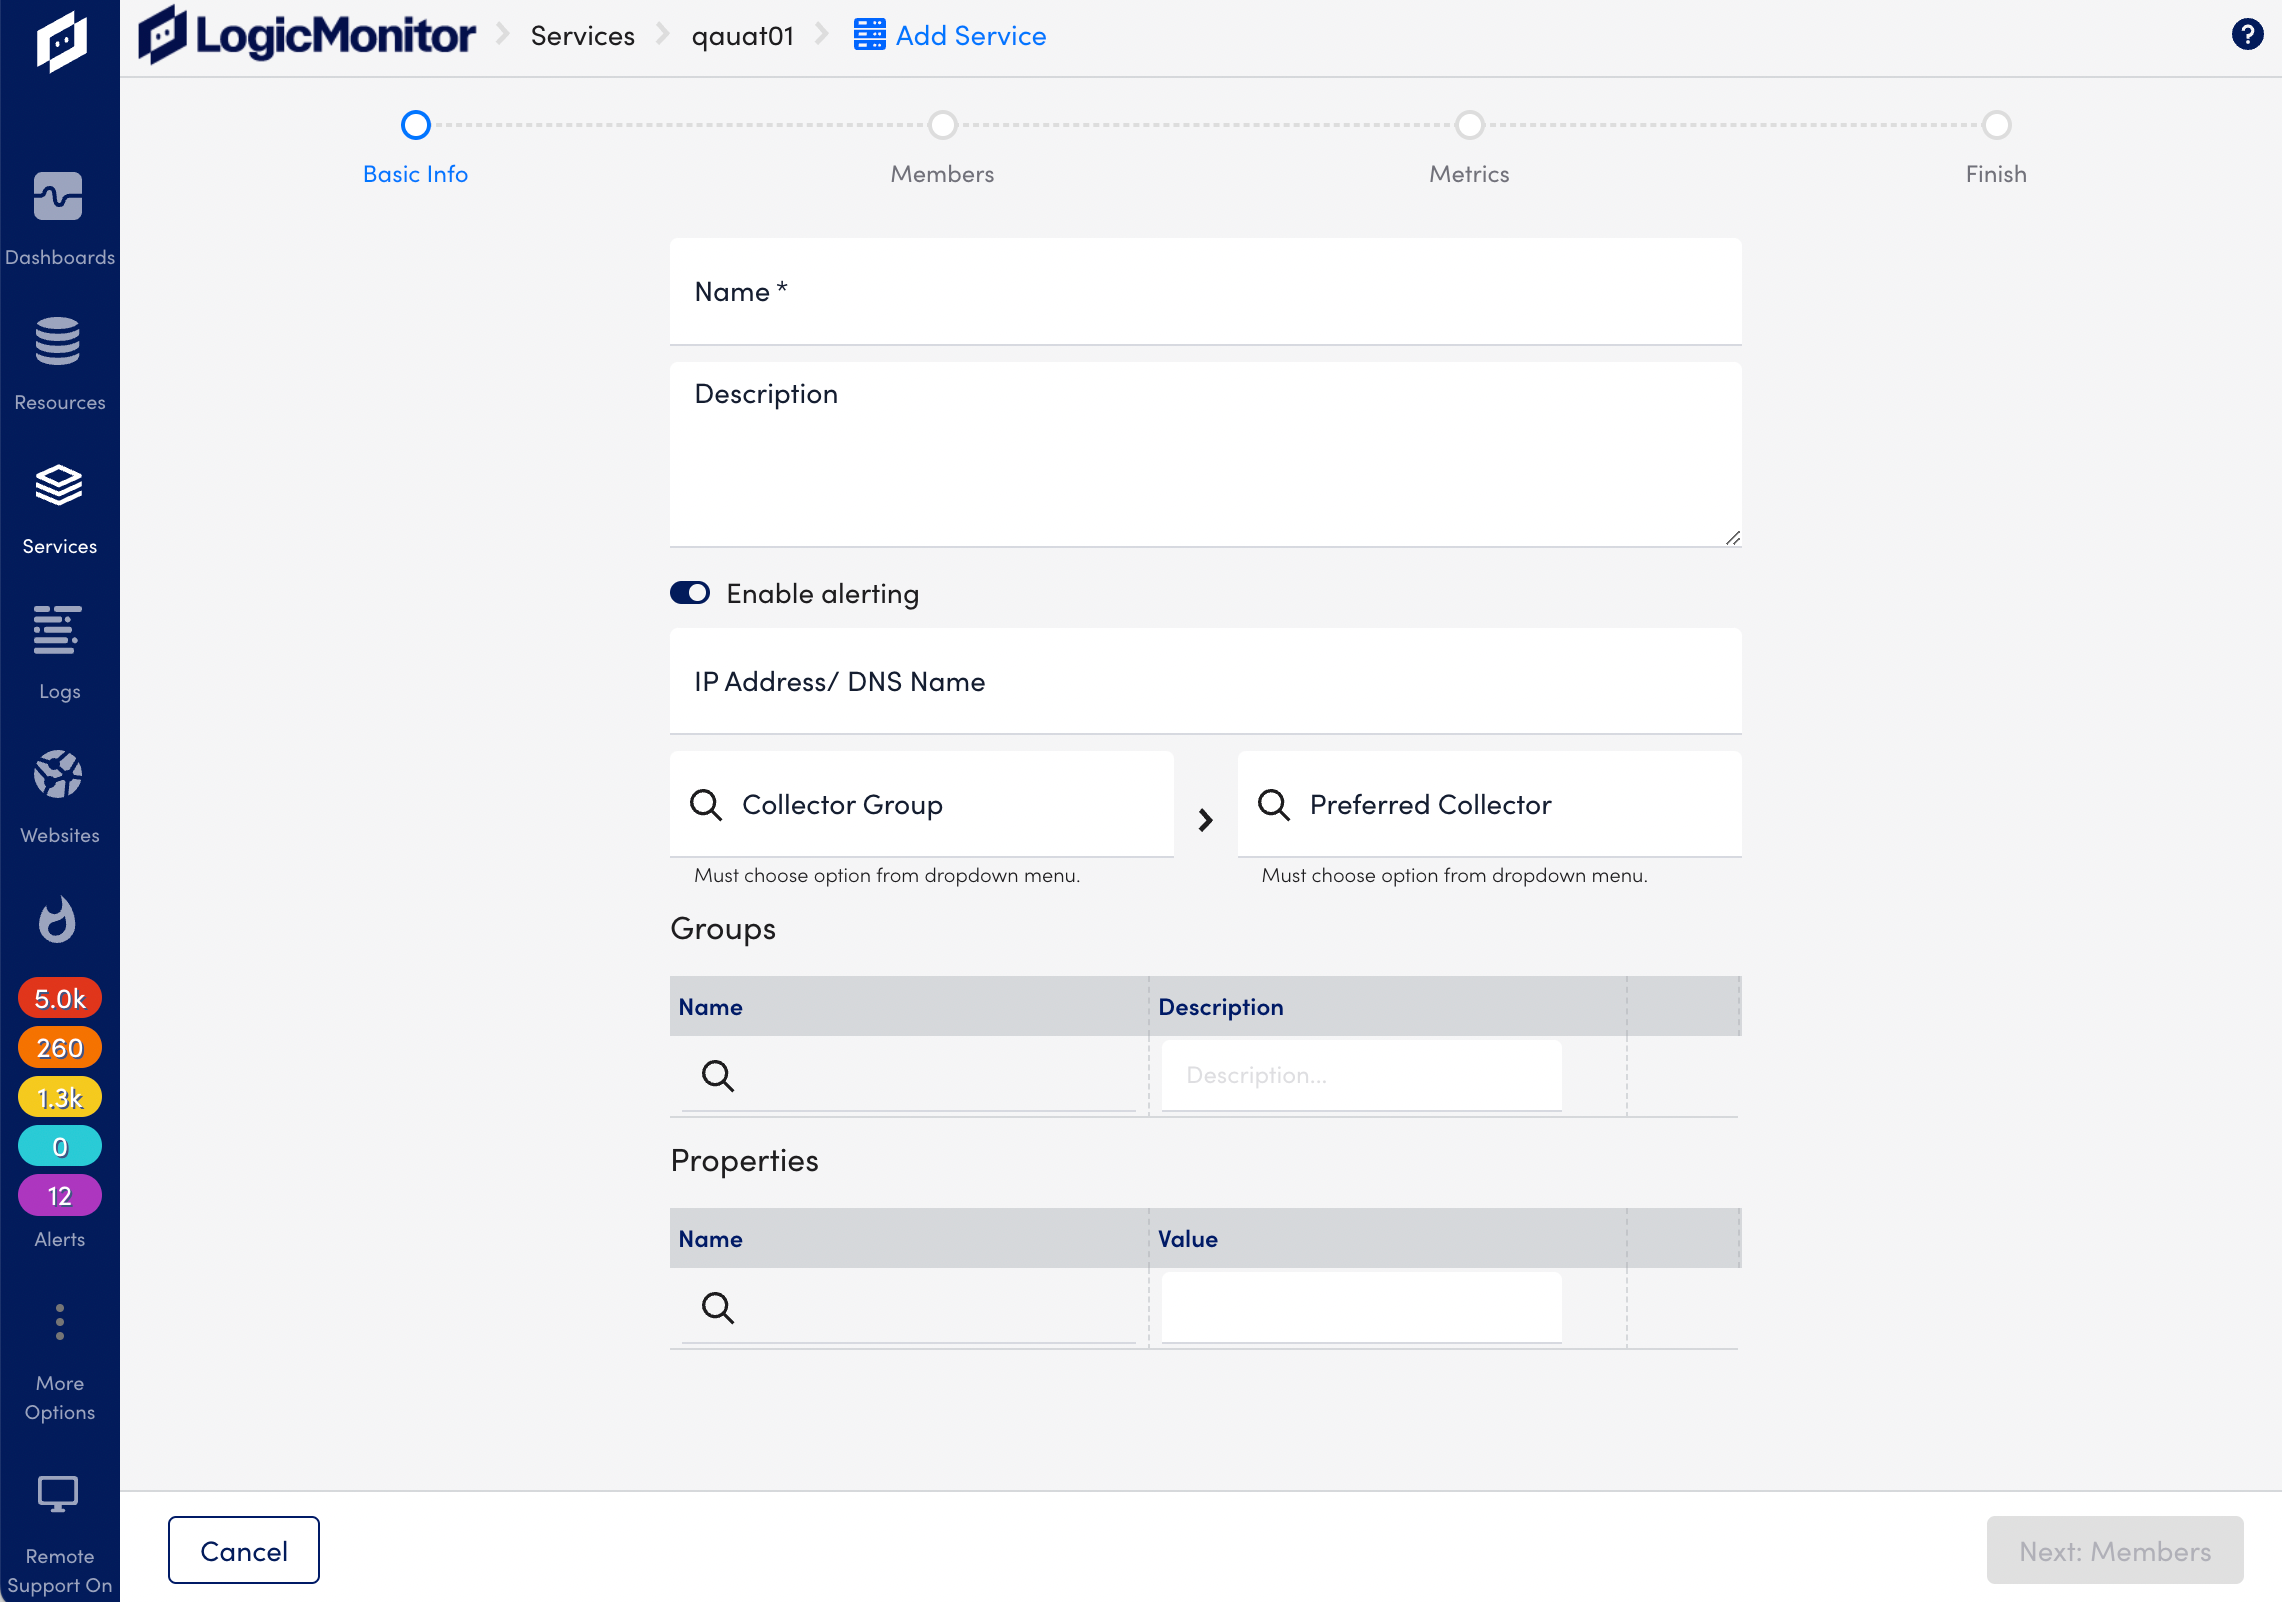
- Provide the following Basic Info for your service.
| Field | Description |
| Name | (Required) Enter a name for the service that reflects what the Service represents. |
| Description | Enter a description for the service. |
| Enable alerting | Select the Enable alerting toggle to turn on or turn off the alerts for this service. |
| IP Address/DNS Name | Enter the IP address or DNS name for the service. |
| Collector Group | Select the search icon to view the list of available collector groups and then select the group you want. |
| Preferred Collector | Select the search icon to view the list of available collectors from the group you have selected and then select the collector you want. |
| Groups | Select Note: Use the Groups table to add the service to a Service Group in the Services tree to organize your services. Services cannot be added to Device Groups. You can add Service Groups using Services > Add > Service Group. |
| Properties | Select the search icon for Name to view available properties and then select the property you want. You can add multiple properties to your service. Note: Add properties to your service if you want to apply the same aggregate DataSource to many Services. For example, you might have several clustered instances of the same application running in different locations, and want to set up a Service for each. In this case, you can go through the Add Service Wizard completely the first time, and leverage a property to apply the automatically created DataSource to future Services, without having to go through the wizard again. |
- Select Next: Members to add members to your service.
Adding Members to a Service
After adding basic information, add members to your service.
- Select Add Service > Basic Info > Next: Members. The members information page appears.
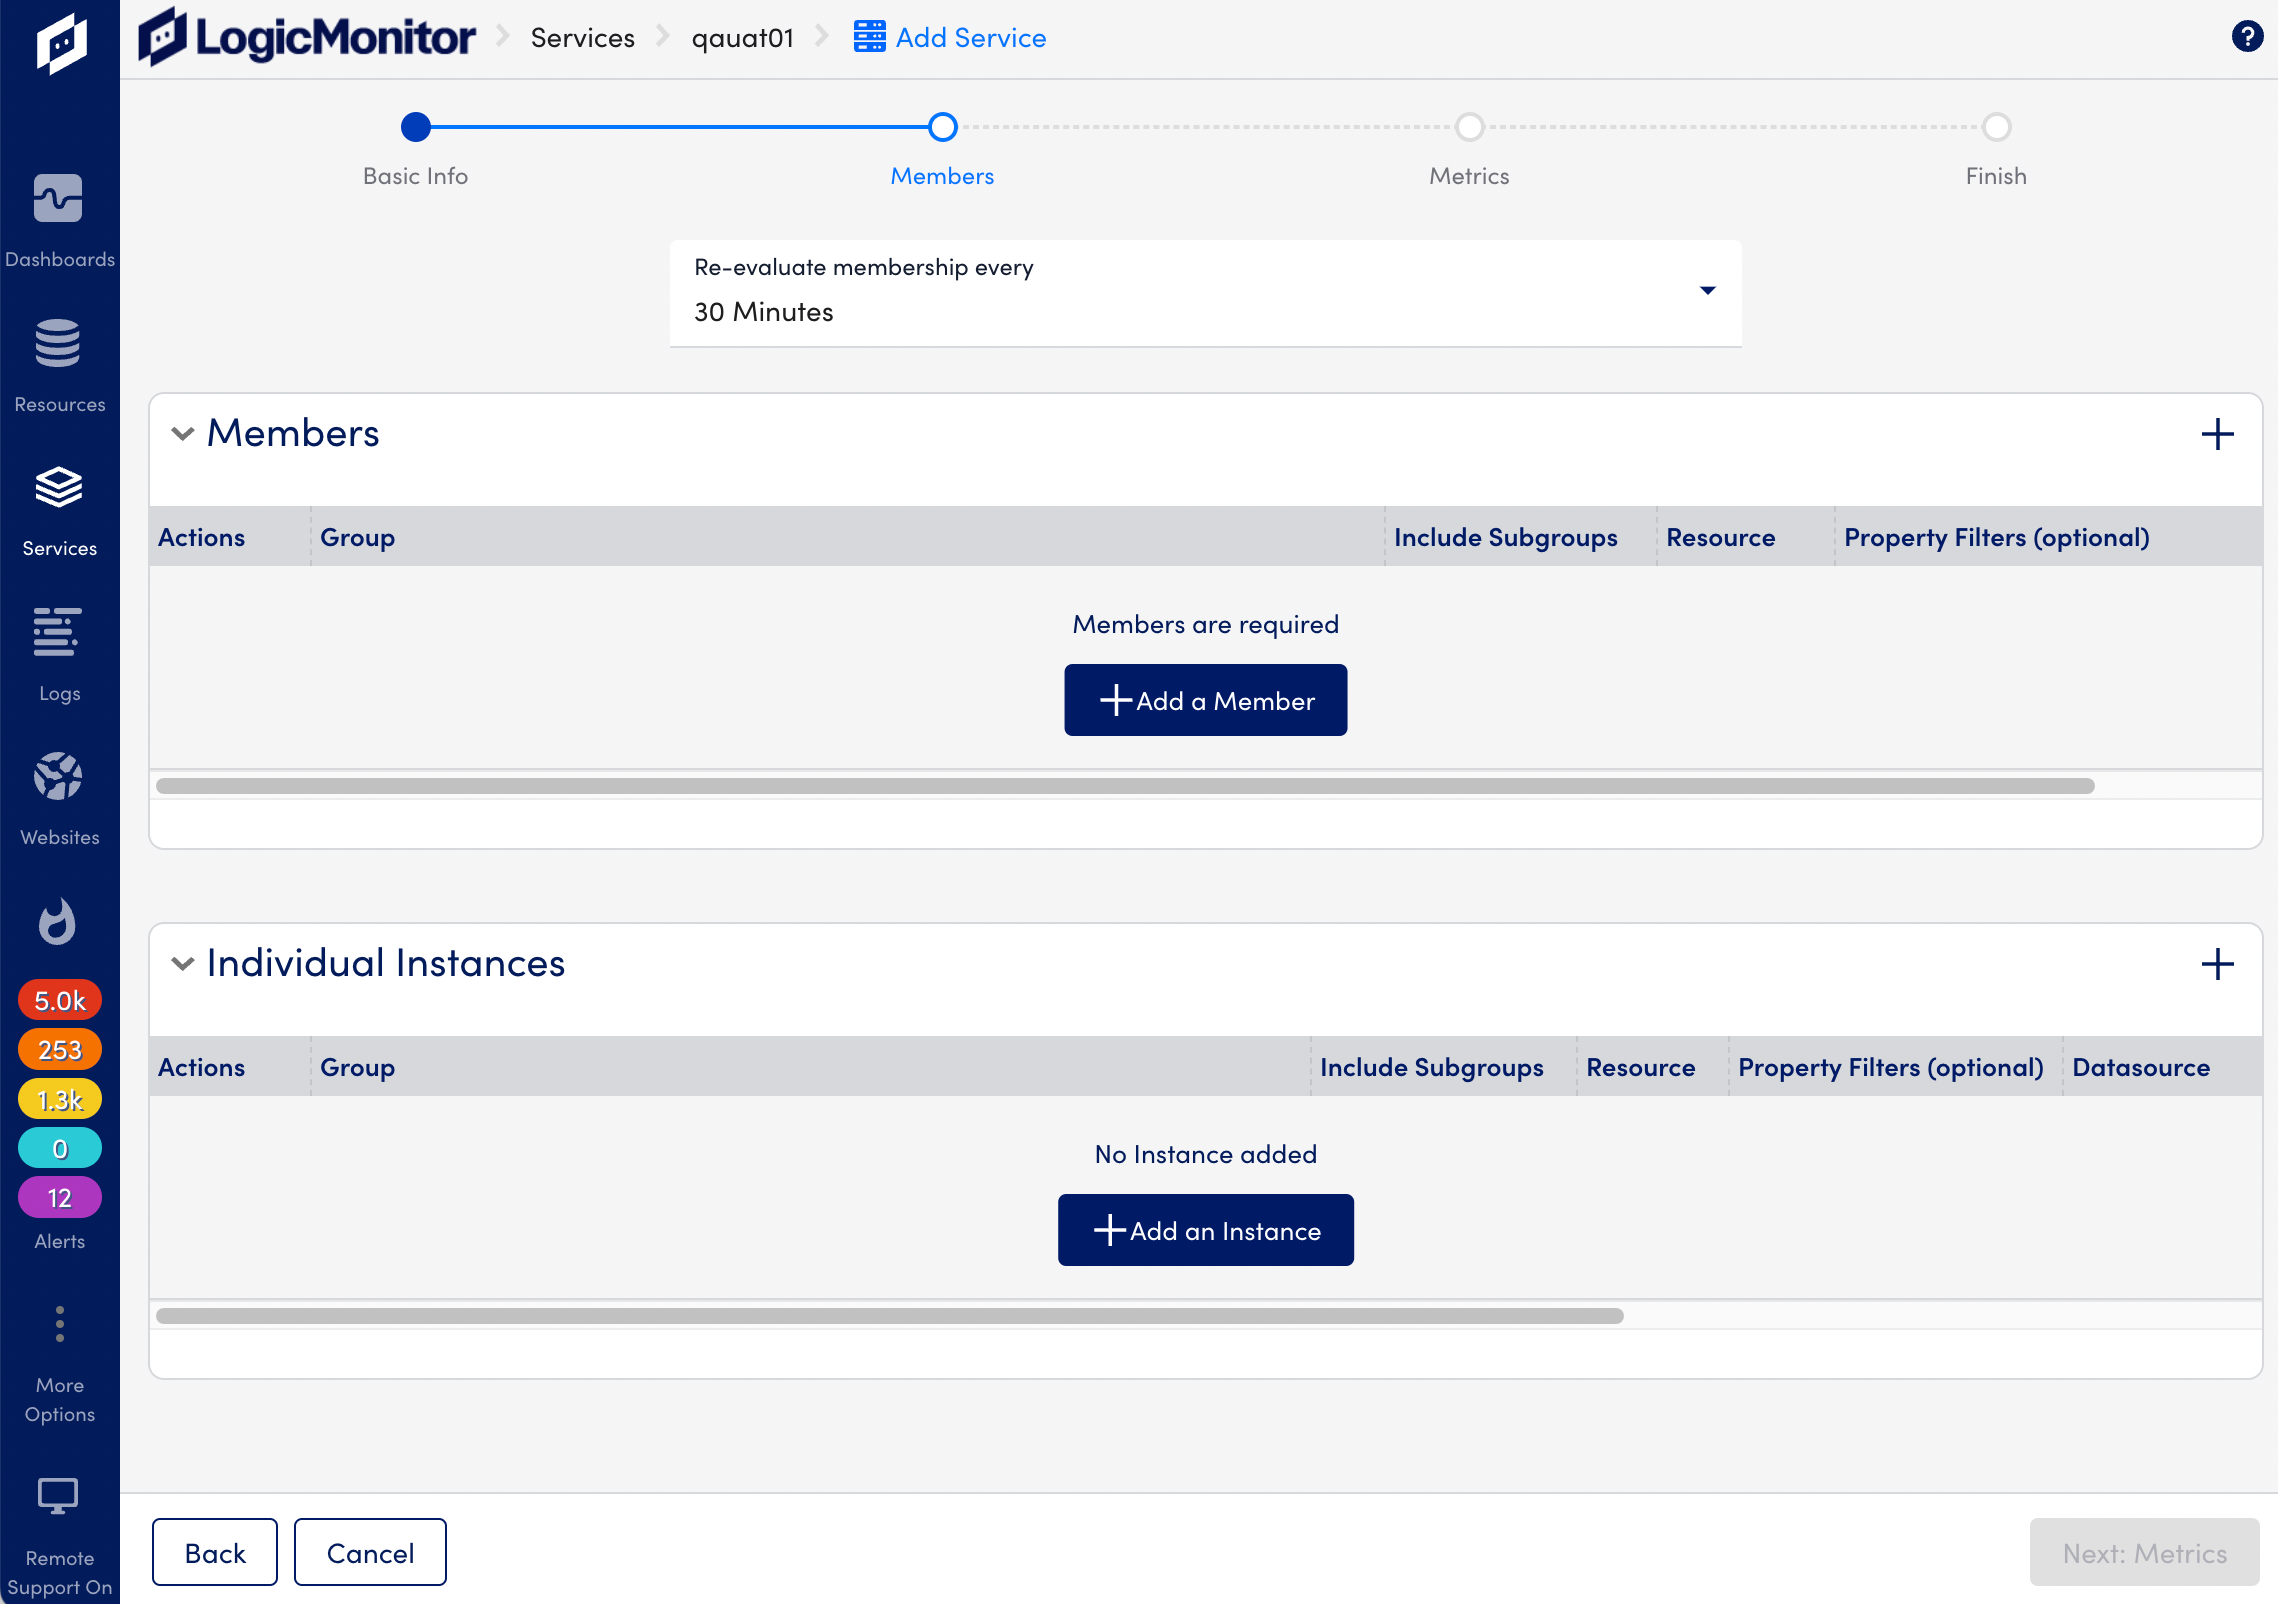
- Select a membership option from the Re-evaluate membership every drop-down. The options are as follows:
- 5 Minutes: Re-evaluates membership of the added members after every 5 minutes.
- 30 Minutes: Re-evaluates membership of the added members after every 30 minutes.
- 1 Day: Re-evaluates membership of the added members after every 24 hours.
Note:This option enables you to select how often the membership criteria for your Service should be re-evaluated. Use a smaller value for a more dynamic Service (for example, containerized application, cloud auto-scaling group), and use a larger value for more static Service.
- From Members, select the +Add a Member button, and then provide the following information.
| Field | Description |
| Group | Select the search icon to view the list of available groups and then select the group you want. |
| Include Subgroups | Select the Include Subgroups toggle if you want to include subgroups for the member. |
| Resource | Select the search icon to view list of available resources and then select the resource you want. |
| Property Filters | Select the search icon for Name to view available filter properties and then select the property filter you want. You can add multiple groups to your service. Note: The resource Property Filter enables you to dynamically match resources based property values. You can make membership dynamic by either using glob in the group, device, and instance name fields, and/or by adding a resource property filter. For example, you could match all servers with ‘kafka’ in the name by entering ‘*kafka*’ in the device field. Also, you could match all EC2 instances in a specific Auto Scaling group by adding a device property filter set to match any devices with the property ‘system.aws.tag.aws:autoscaling:groupName’ set to the Auto Scaling group name. |
- Select the Save icon. The member is added in the Members section.
- From Individual Instance, select the +Add an Instance button to add an instance of the member, and then provide the following information.
| Field | Description |
| Group | Select the search icon to view the list of available groups and then select the group you want. |
| Include Subgroups | Select the Include Subgroups toggle to include if you want to include subgroups for the member. |
| Resource | Select the search icon to view the list of available resources and then select the resource you want. |
| Property Filters | Select the search icon for Name to view the available filter properties and then select the property filter you want. You can add multiple groups to your service. |
| DataSource | Select the search icon for Name to view the available DataSources and then select the DataSource you want. |
| Instance | Select the search icon for Name to view the available instance and then select the instance you want. |
- Select the Save icon. The instance is added in the Individual Instances section.
- Select Next: Metrics to add metrics to your service.
Adding Metrics to a Service
After adding members, do the following to add metrics to your service.
- Select Add Service > Basic Info > Members > Next: Metrics.
The Metrics information page appears.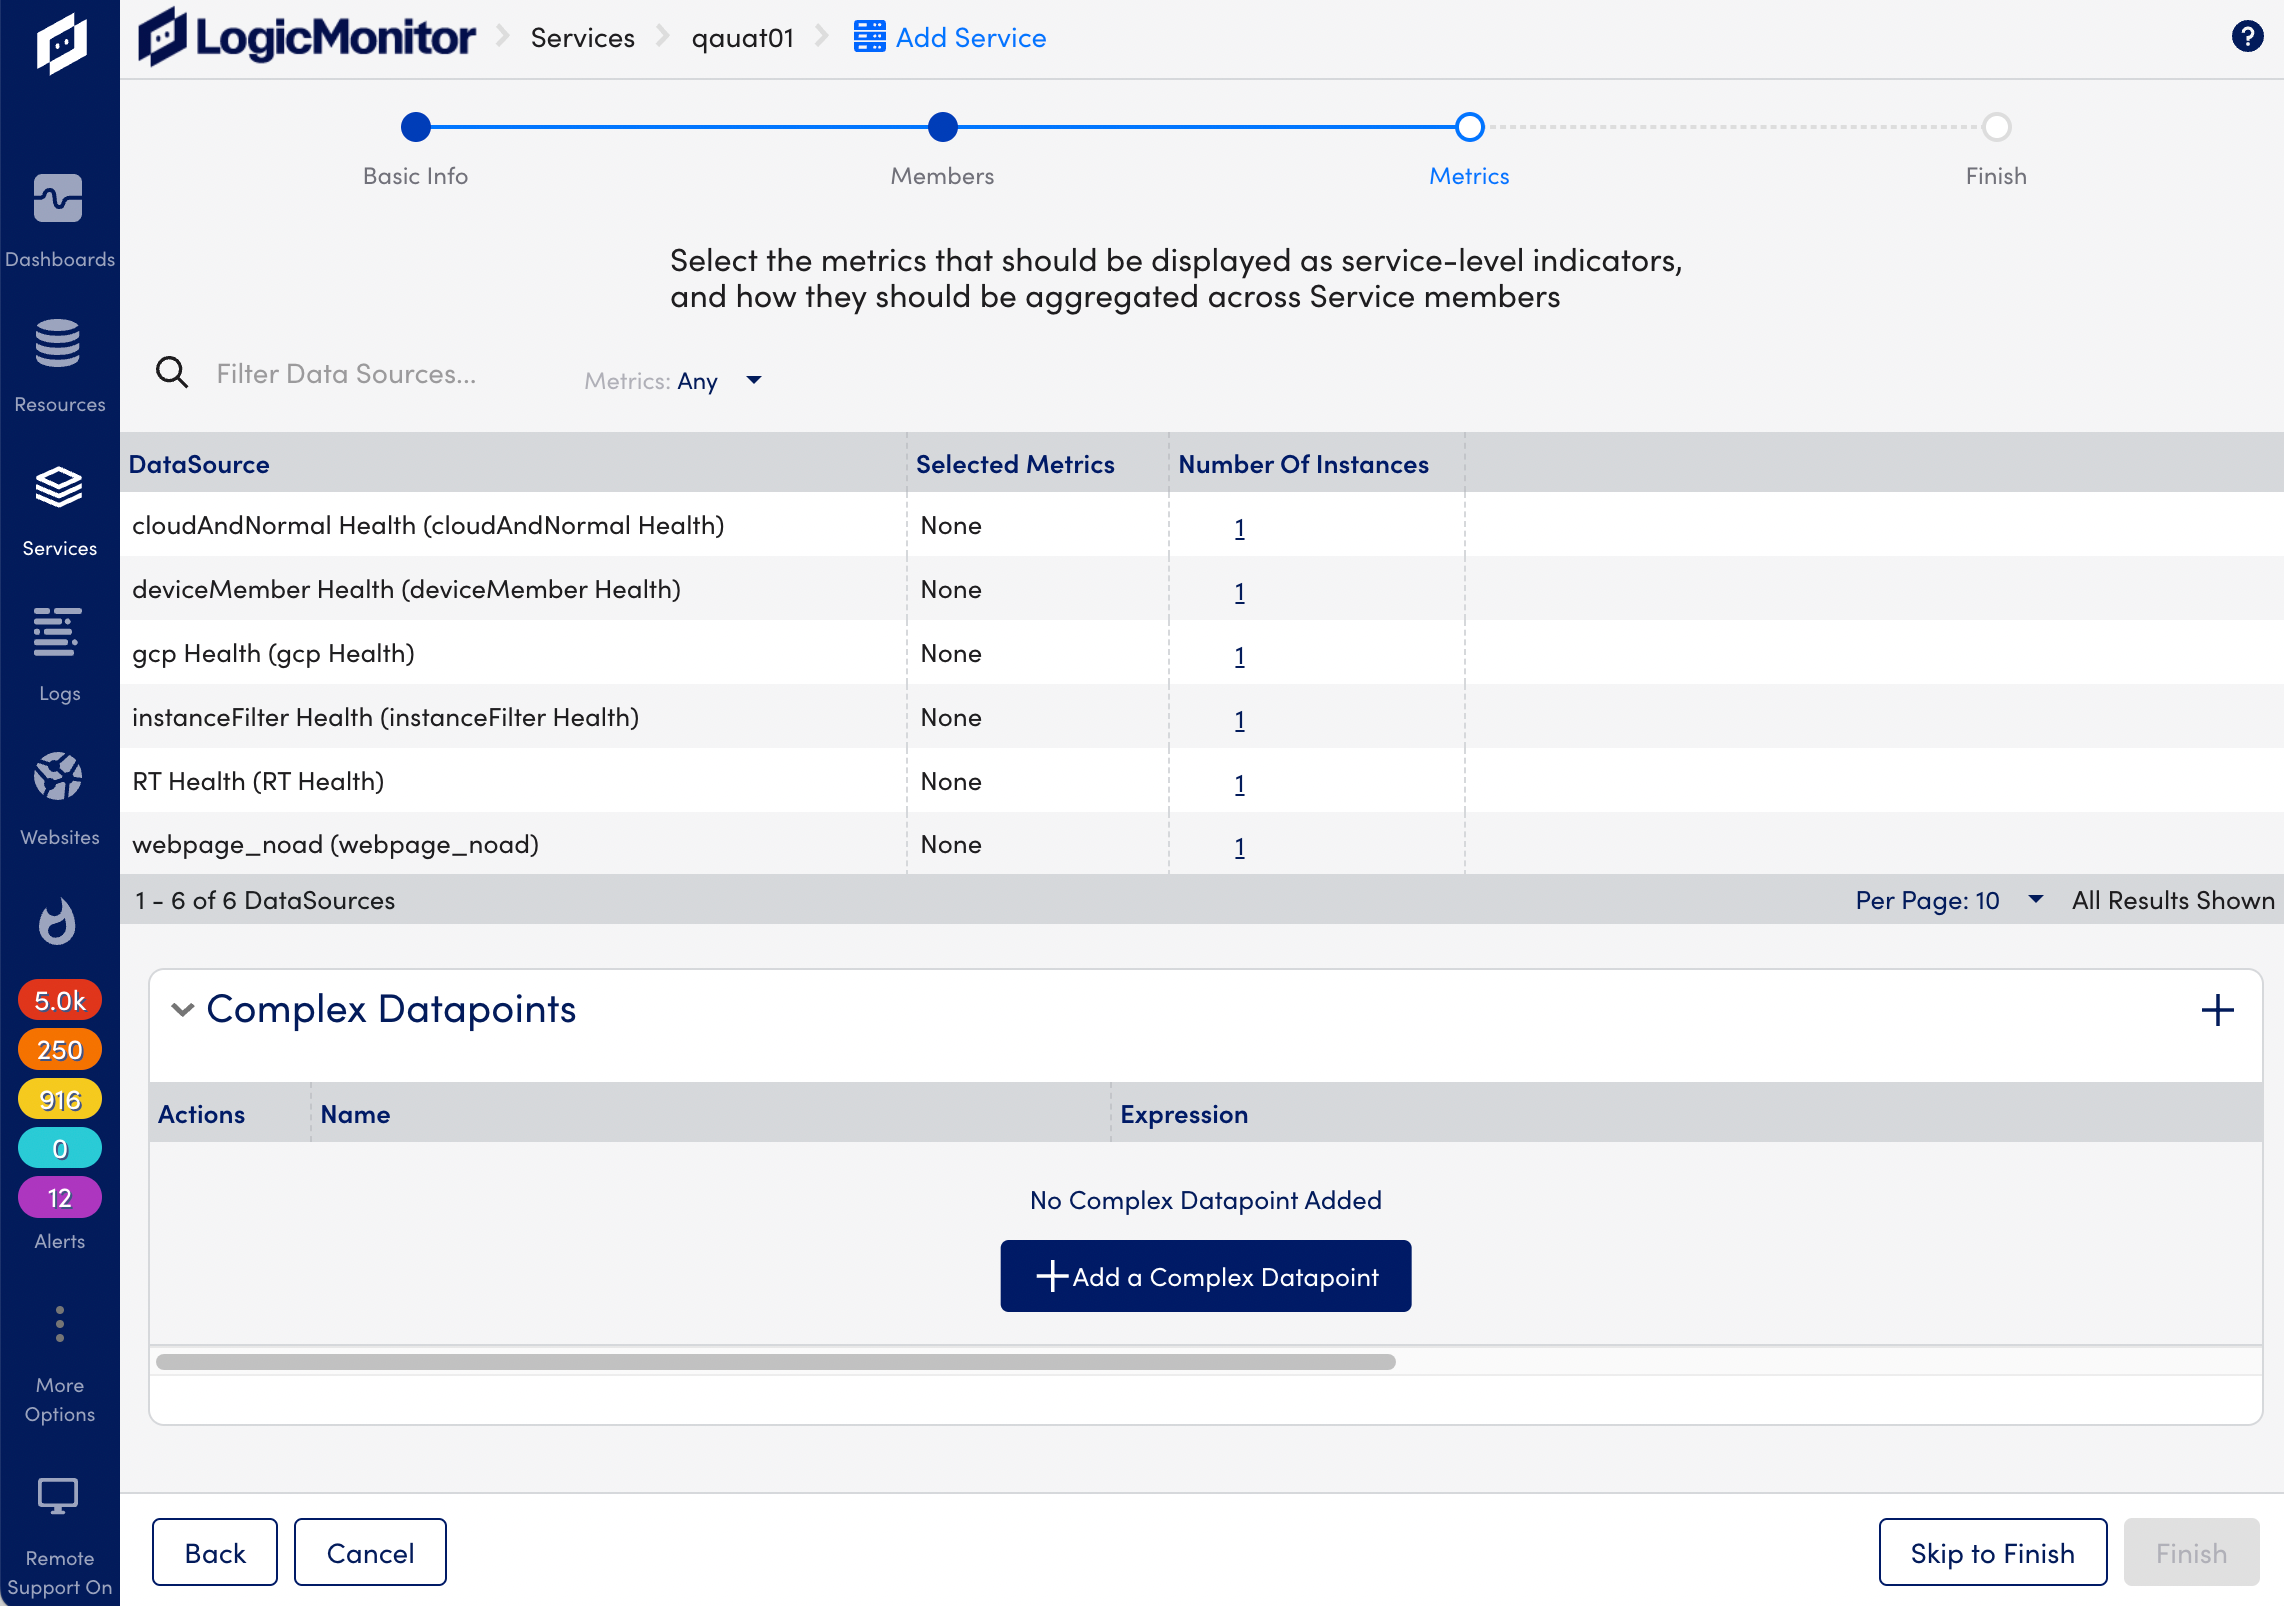
- From DataSource, select a datasource to add a metrics. The Metrics section appears.
- From Metrics, select the metrics you want. The following options are available.
| Metrics | Description |
| Mean | Aggregated metrics for a given datapoint. |
| Sum | The total of aggregated metrics for a given datapoint. |
| Min | The minimum number for a metric over a specified time range. |
| Max | The maximum number for a metric over a specified time range. |
| Count | The total number of instances for that datapoint and DataSource combination. |
| Range | The difference between Max and Min. |
| Unbalanced | In load balancing, some nodes receive small tasks while other nodes receive larger and more complex tasks. For such scenarios, unbalanced metrics can provide insights into these issues. An Unbalanced service refers to a group of instances that is not utilized evenly for some metrics. Select the Unbalanced option for any datapoint to add unbalanced service detection. You can also set alerts and thresholds for the datapoints. |
| Percentile | The specified percentile value of all available values for the datapoint for each timestamp. |
- Select the Save icon. The metrics are added to the DataSources. The number of selected metrics appear in the Selected Metrics column for that Datasource.
- To add a complex datapoint, from Complex Datappoints, select +Add a complex datapoint, and then provide the following information.
| Field | Description |
| Name | (Required) Enter a name for the complex datapoint. |
| Description | Enter a description for the complex datapoint. |
| Insert a Datapoint | Select the datapoint that you want to insert in the expression. |
| Expression | Create the expression you want using the datapoint. The Expression is a mandatory field. To know more about creating an expression, see Complex Datapoints. |
- Select the Save icon. The metrics are added to the DataSources.
- Select Finish to complete the service creation process.
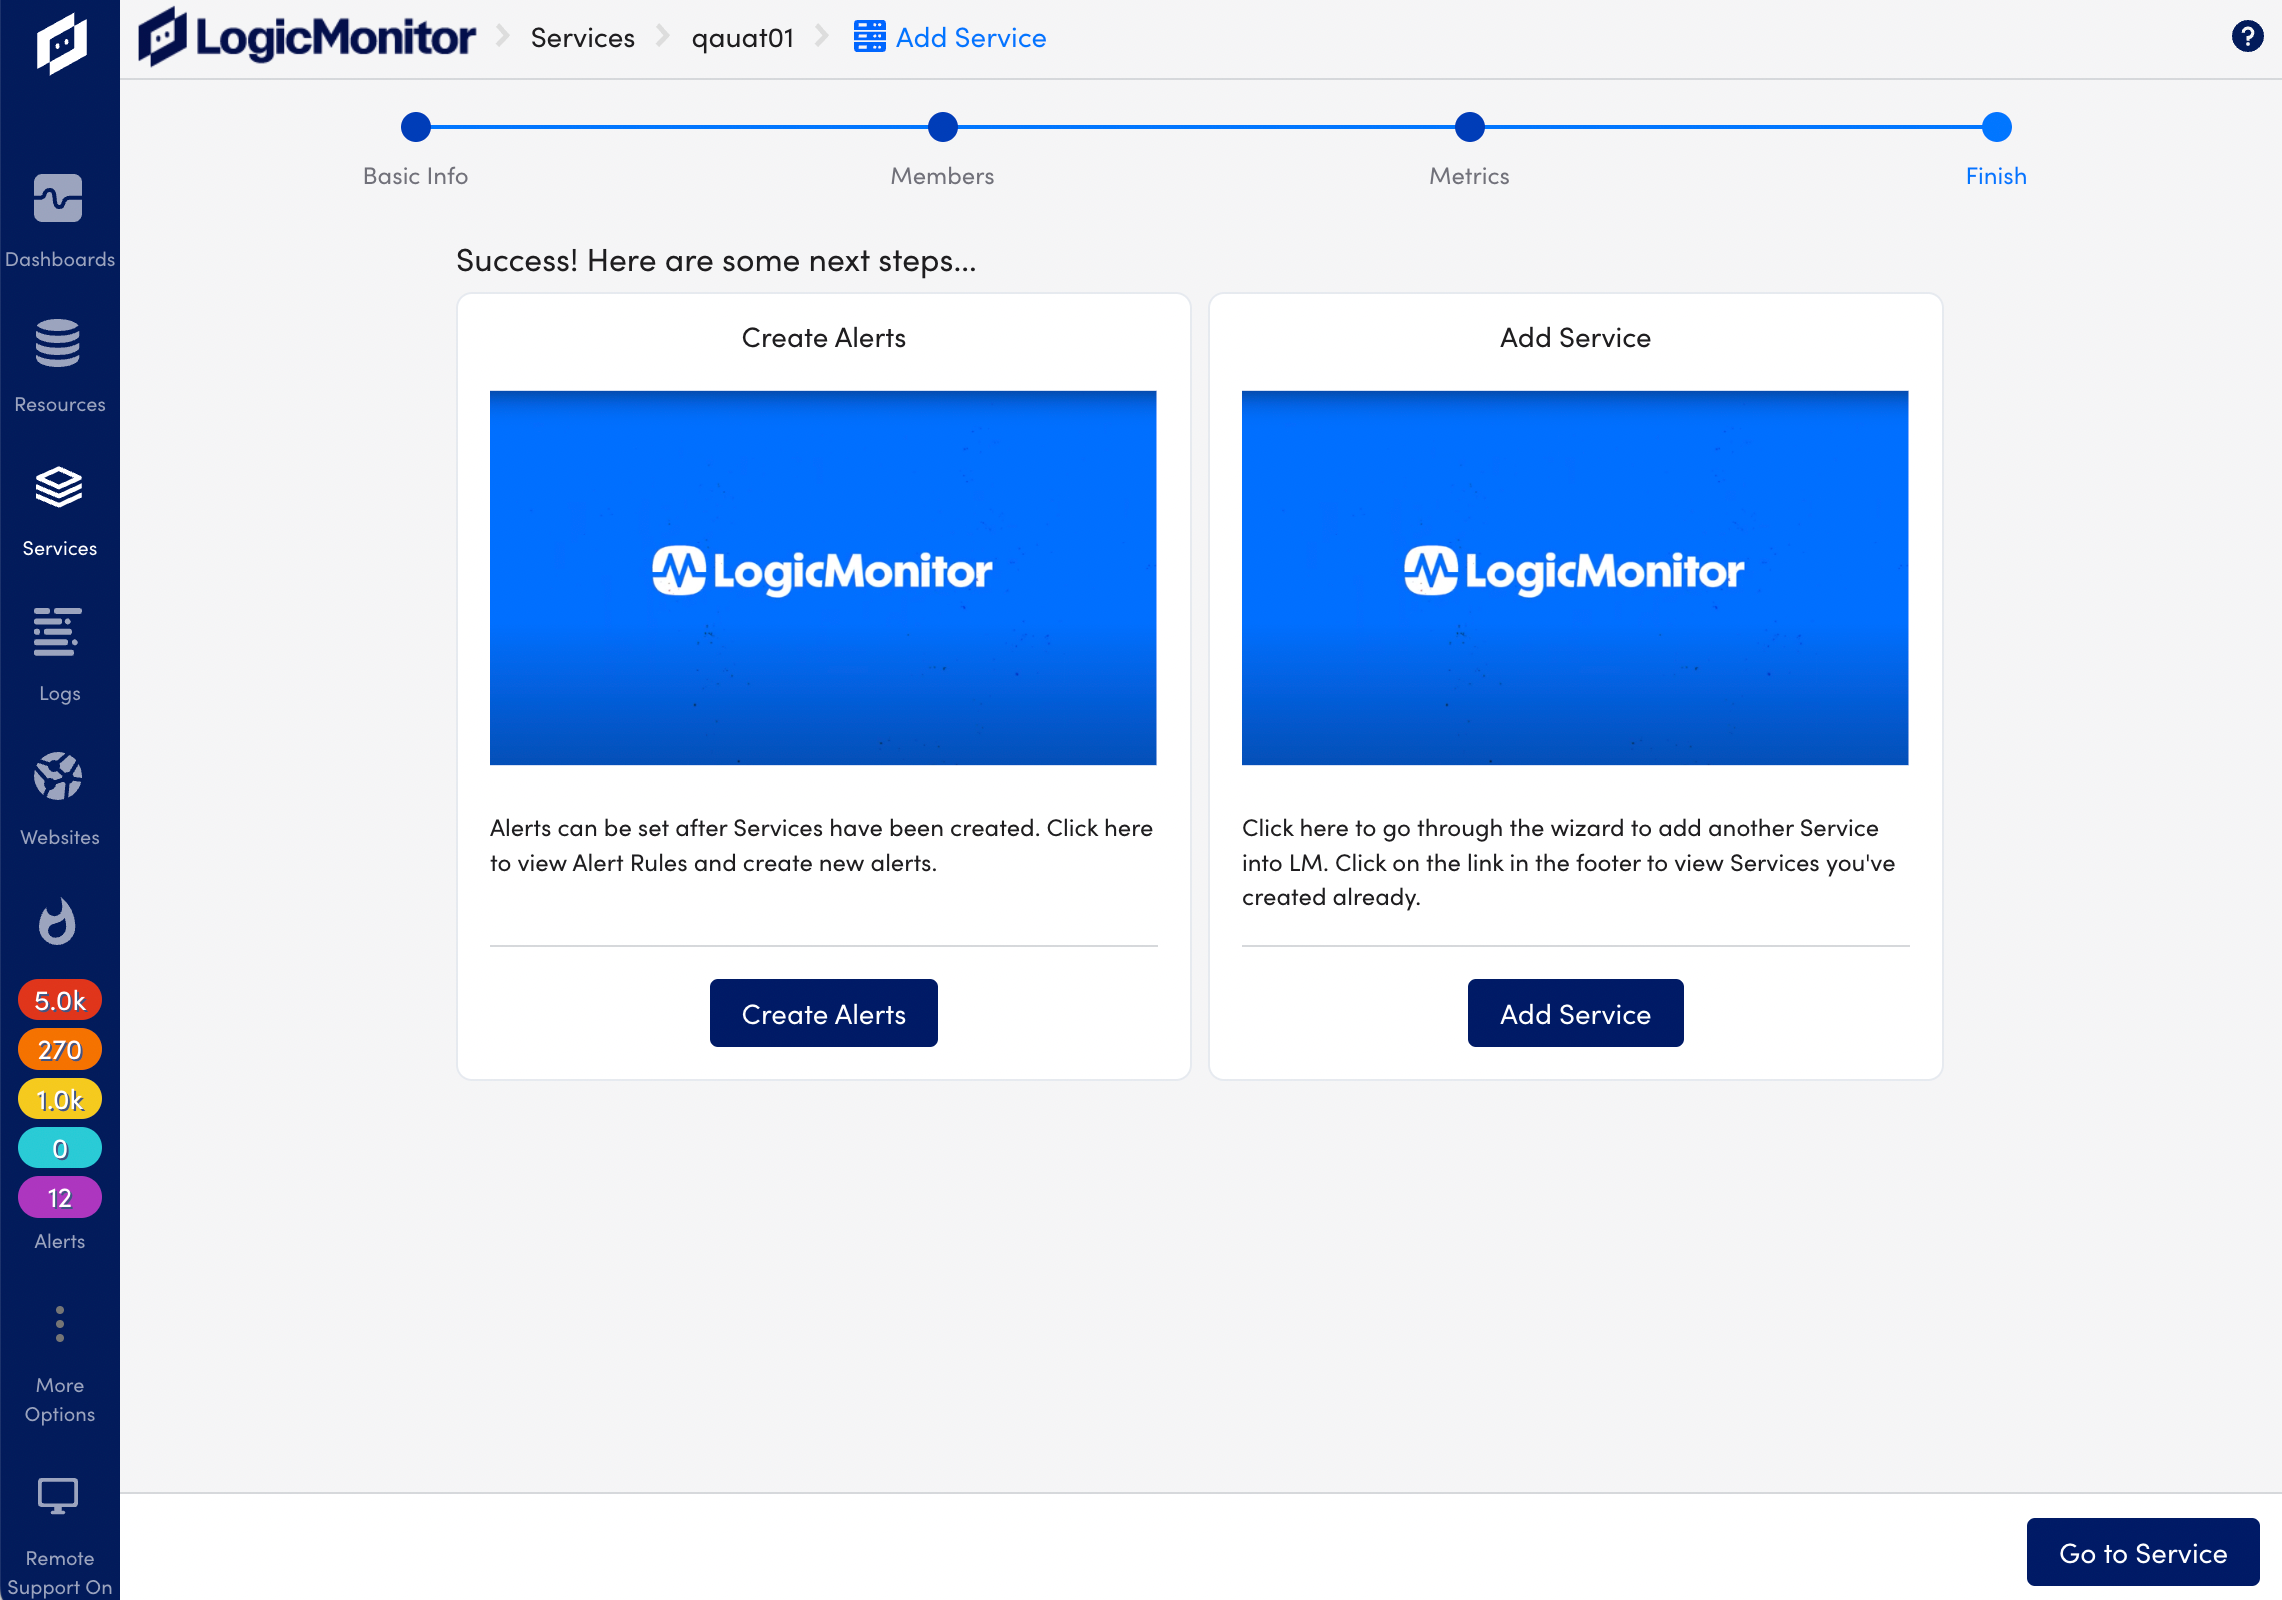
Finish Adding a Service
After you finish adding a service, you can do the following:
- Go to Service: Select to review the service you have just created.
- Create Alert: Select to create rules and alerts for the service, see Alert Rules.
- Add Service: Select to add another service.
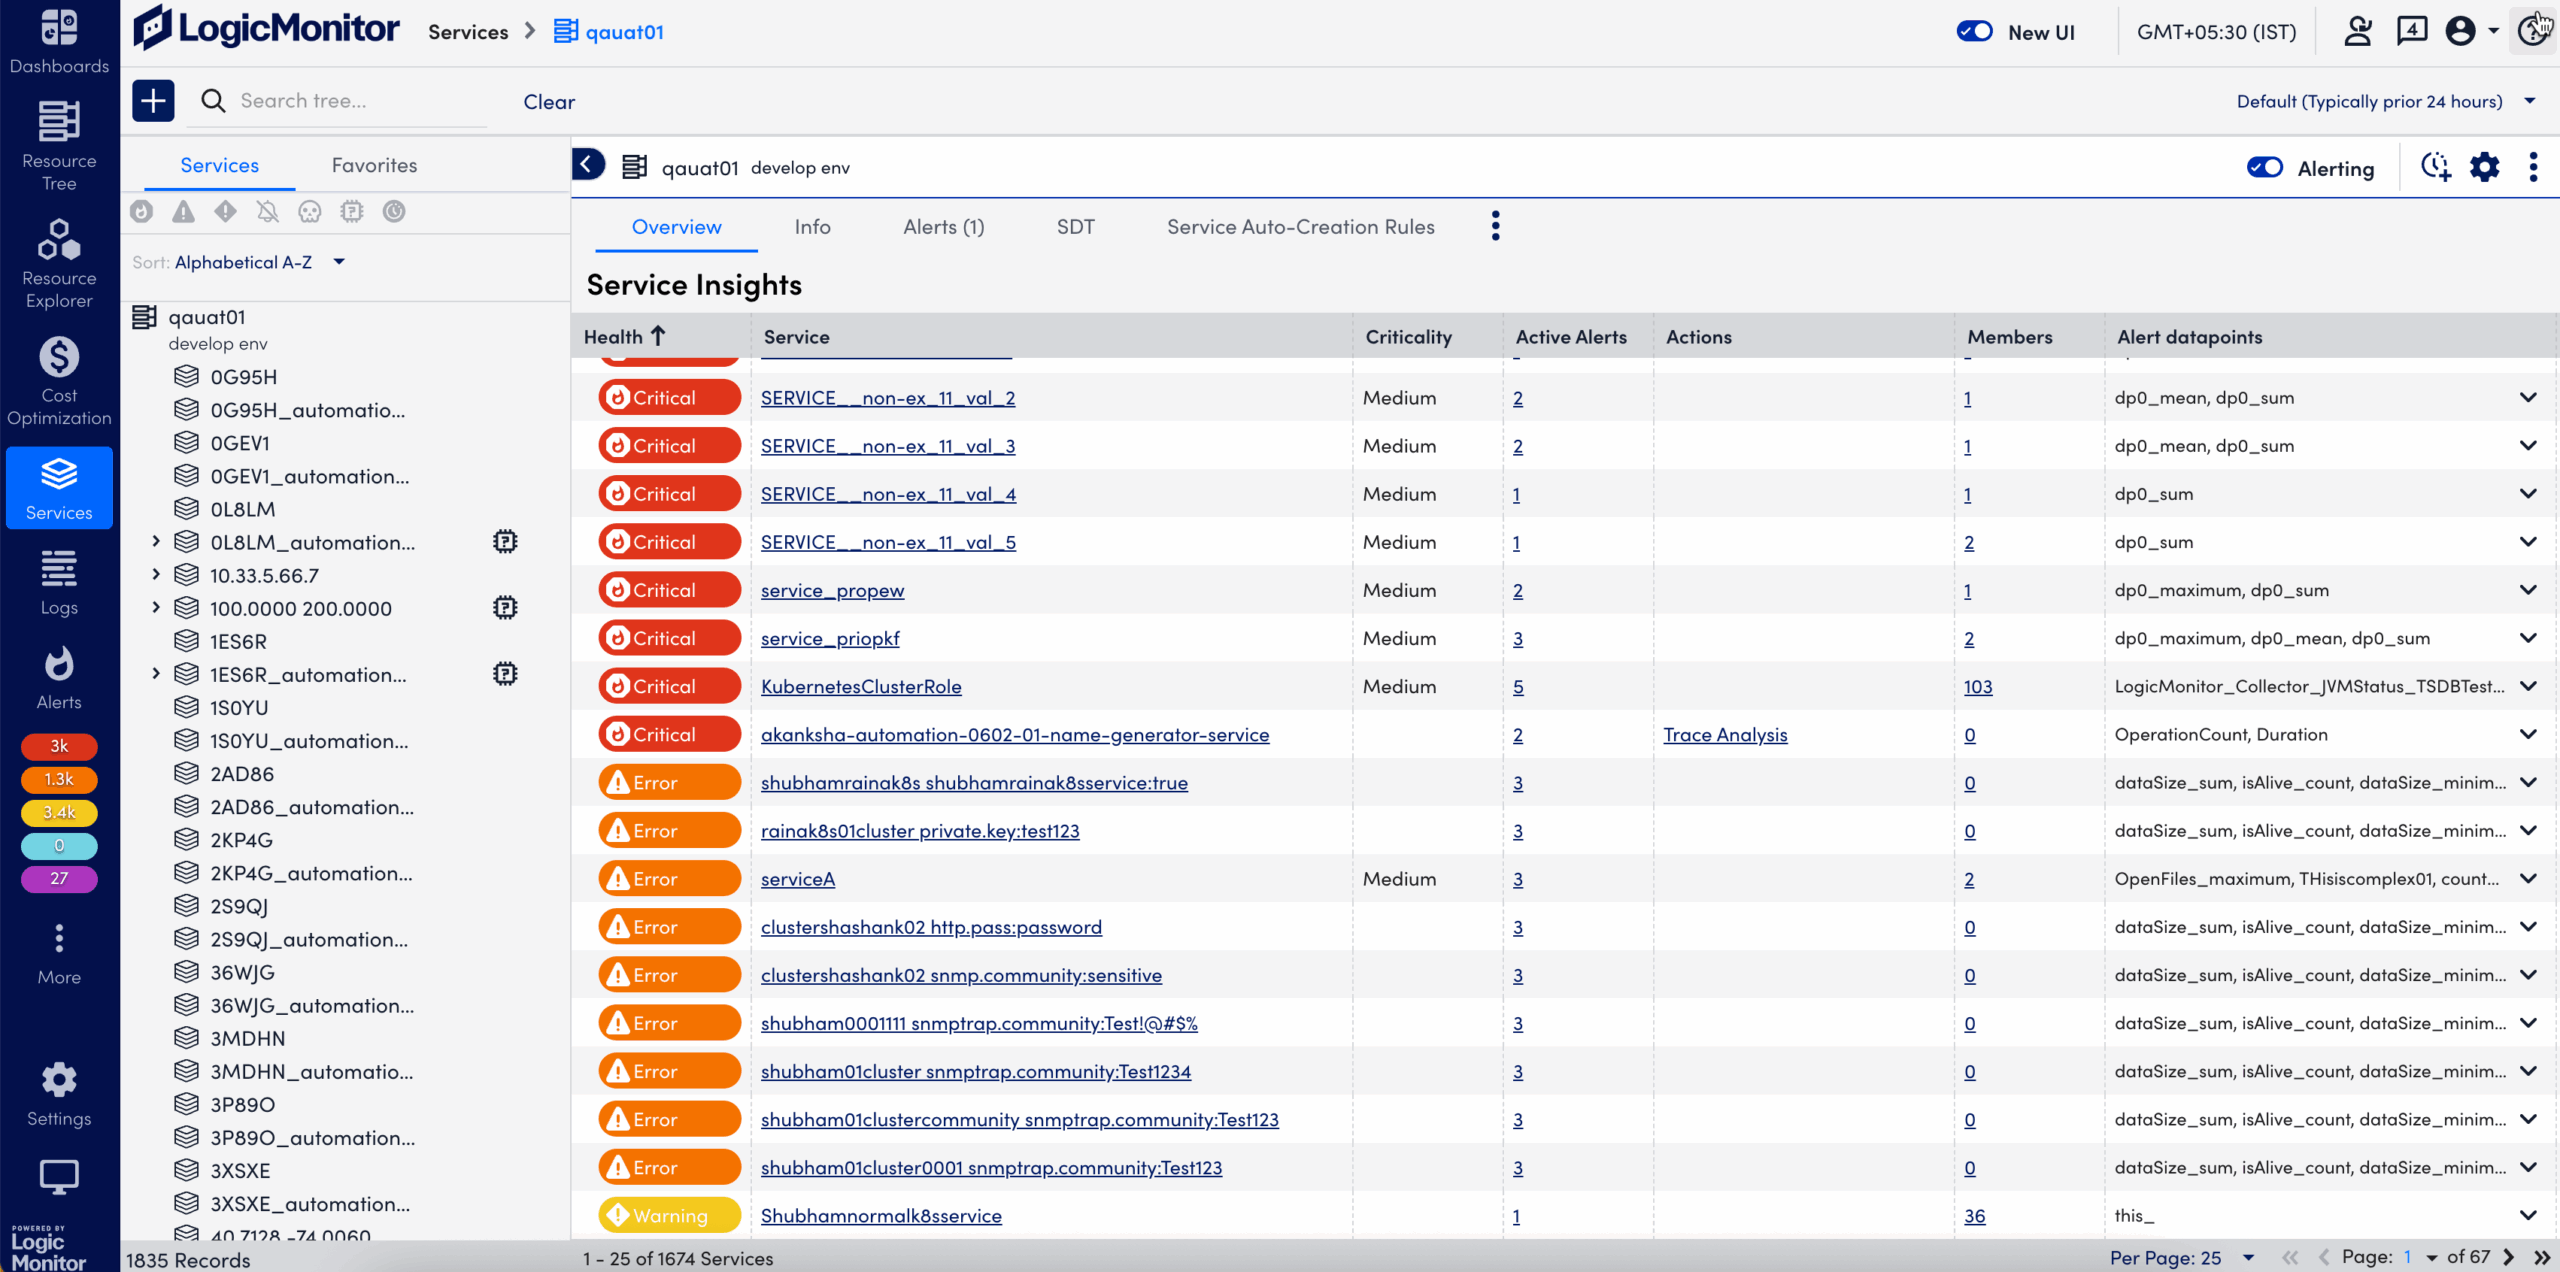
About Services Page
You can access Services from the Services tree. When you open a service, the Service page displays various tabs with more information about the service.
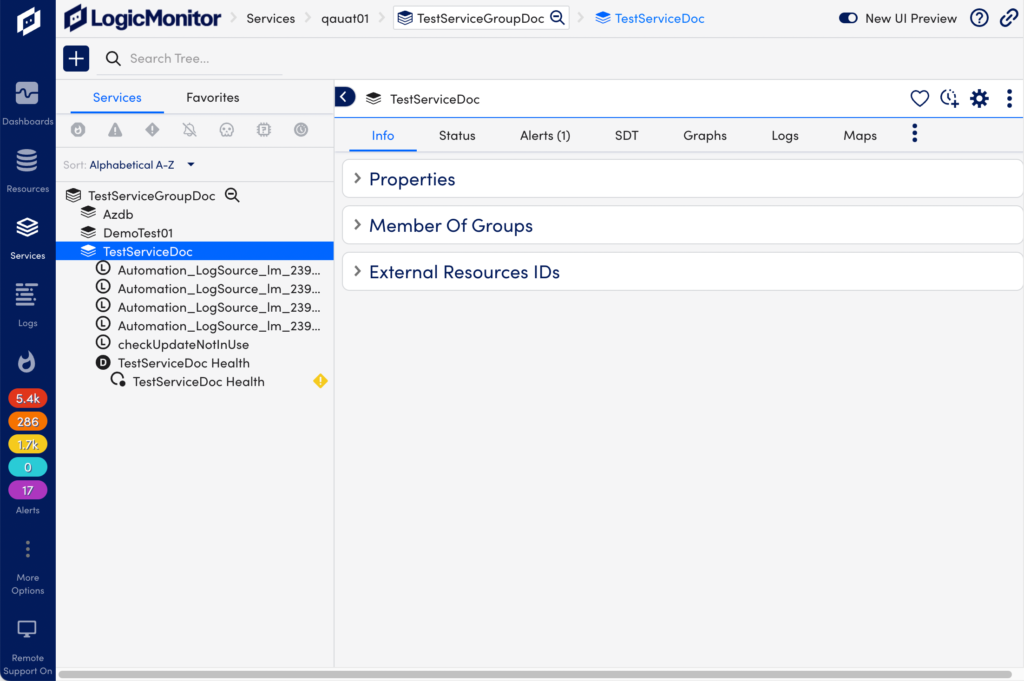
The Service page has the following tabs.
| Tab | Description |
| Info | Displays the resources and individual instances that belong to the Service. The Info tab has the following sections: Properties – Displays properties such as Type, Name, Value, and Inherited From. Members of Groups – Displays the name of the groups that this service is added to. If you want to go to the group, select the group name. External Resources IDs – Displays the external resources IDs. |
| Status | Displays the status of your Service based on the alert thresholds you configured. To add the status widgets to your dashboard, from the status widget, select More, and then select Add to Dashboard. |
| Alerts | Displays Service alerts, but also enables you to include alerts for individual instances and resources. You may find starting at the Service level and drilling down into the individual resource and instance alerts useful for troubleshooting. To know more about alerts, see Alerts. |
| Inventory | Displays services as follows: For the Service Group, this tab displays all of the services within the group. For the individual Service, this tab displays all of the members within an individual service. |
| SDT | The Schedule down time (SDT) tab displays if there is any SDT applied to the service. Adding an SDT for the Service will also add SDT to each member of the service (resources and individual instances). |
| Graphs | Displays the DataSource graphs that are created by default. You can drill down from the aggregate data to individual instance data for any given graph using the Member Instance Graphs list on the Graphs tab when the DataSource is selected. |
| Logs | Displays log events associated with a service. To know more about logs, see Logs. |
| Maps | Displays a dynamic topology map for your Service, and also shows each resource and individual instance member. |
