
Web Check
Last updated - 16 October, 2023
Web Checks periodically make HTTP GET, HEAD, or POST requests to one or more URLs. LogicMonitor supports two types of Web Checks:
- External Web Check—Performed by one or more geographically dispersed checkpoint locations. These locations are hosted by LogicMonitor and are external to your network. The purpose of an External Web Check is to verify that your website is functioning appropriately for users outside of your network (as compared to regular server monitoring which is performed internally) and to adequately reflect these users’ experience.
- Internal Web Check—Performed by one or more Collectors internal to your network. The purpose of an Internal Web Check is to verify that websites and cloud services (whether internal or external to your network) are functioning appropriately for users within your private network.
For information on the type of data that is monitored for your configured Web Checks and how that data is organized on the Websites page, see Data Monitored for Websites.
For more information on how LogicMonitor monitors your portal, see LogicMonitor Security Best Practices.
Creating External Web Checks
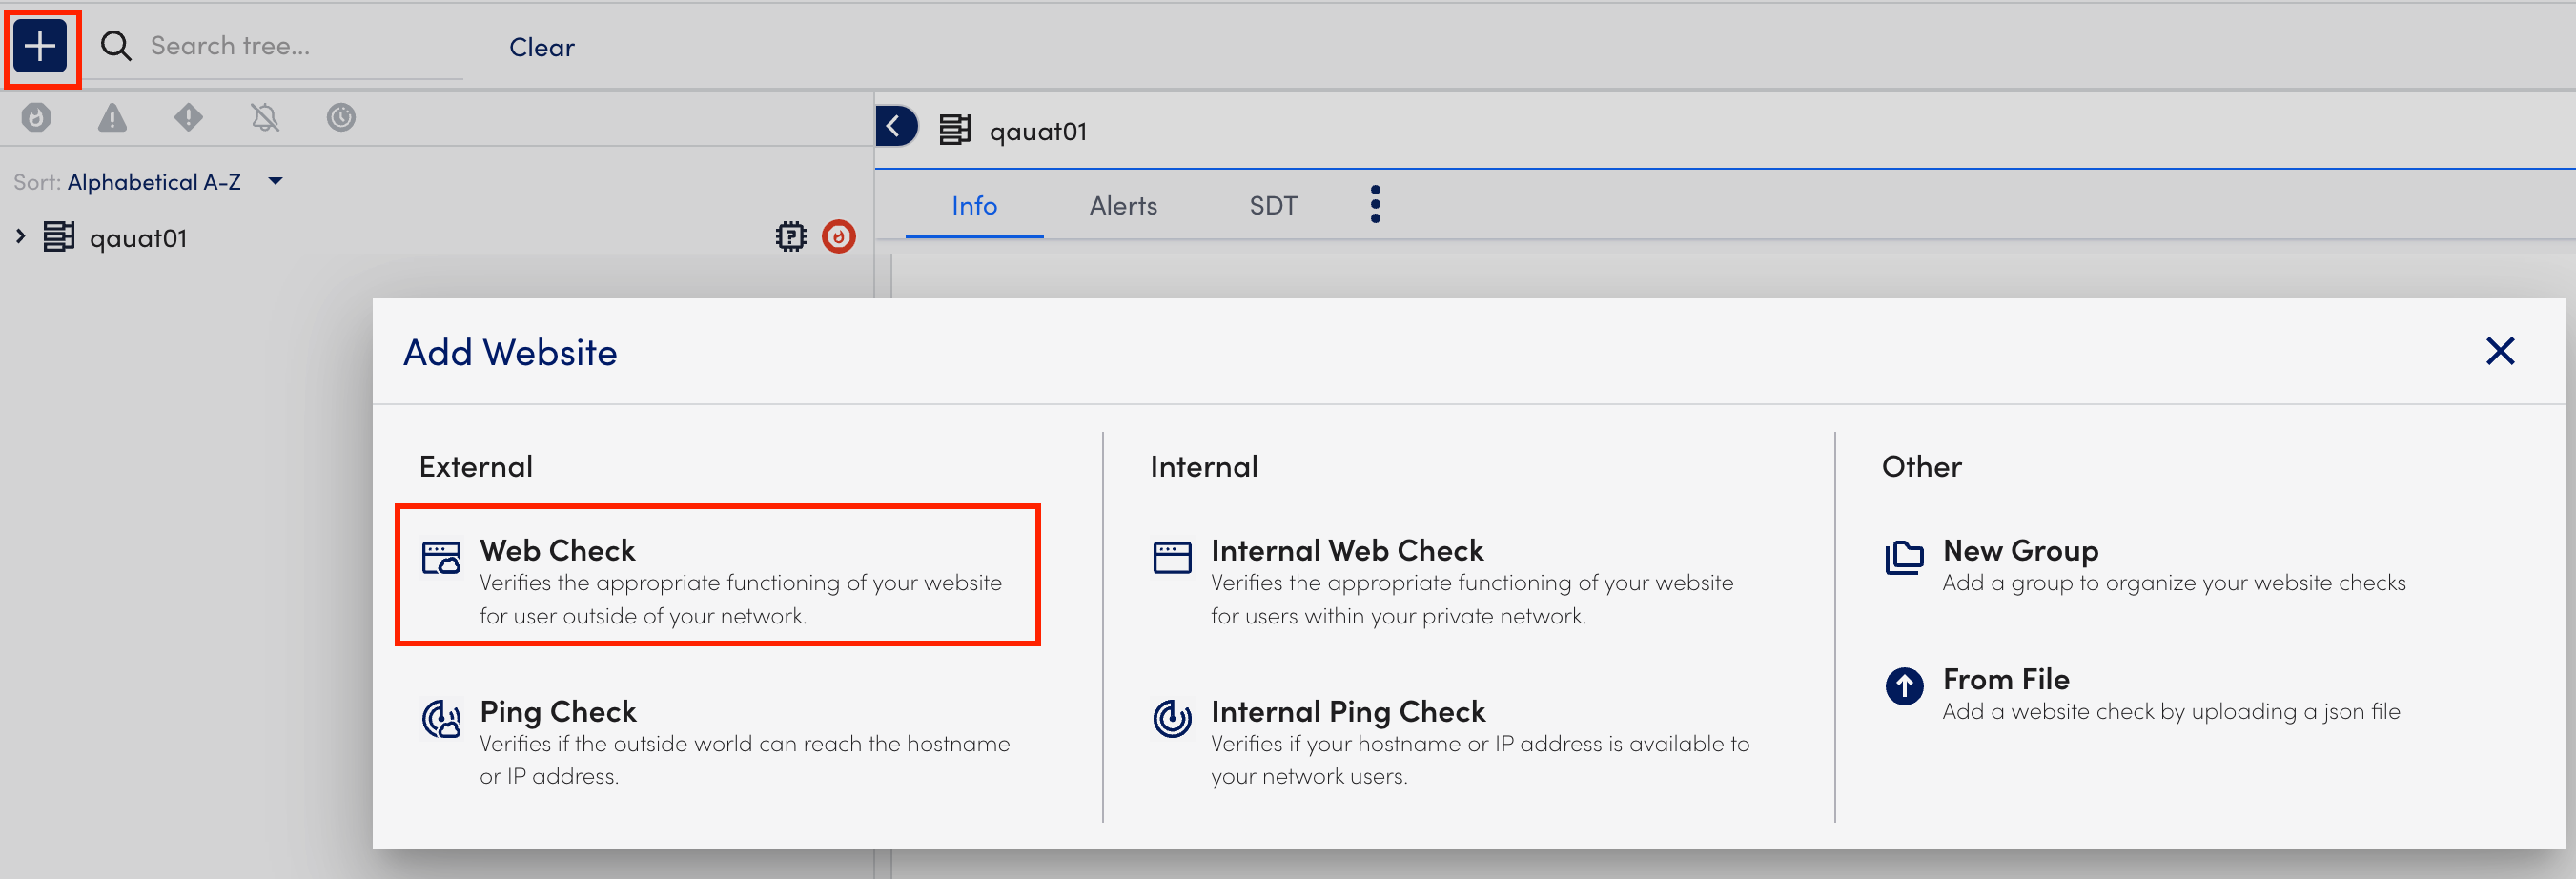
- In LogicMonitor, navigate to Websites > (Add) + > select Web Check.
- At the Basic step of the wizard, do the following:
- In the Name field, enter a name for the Web Check.
- (Optional) In the Description field, describe the scope and purpose of the Web Check.
- Select from the existing group list from the Where should it be placed dropdown menu where the Web Check should belong. By default, the root (top-level) website group is selected.
- In the Properties table, add the relevant properties. For example, add
http.portwith the value80.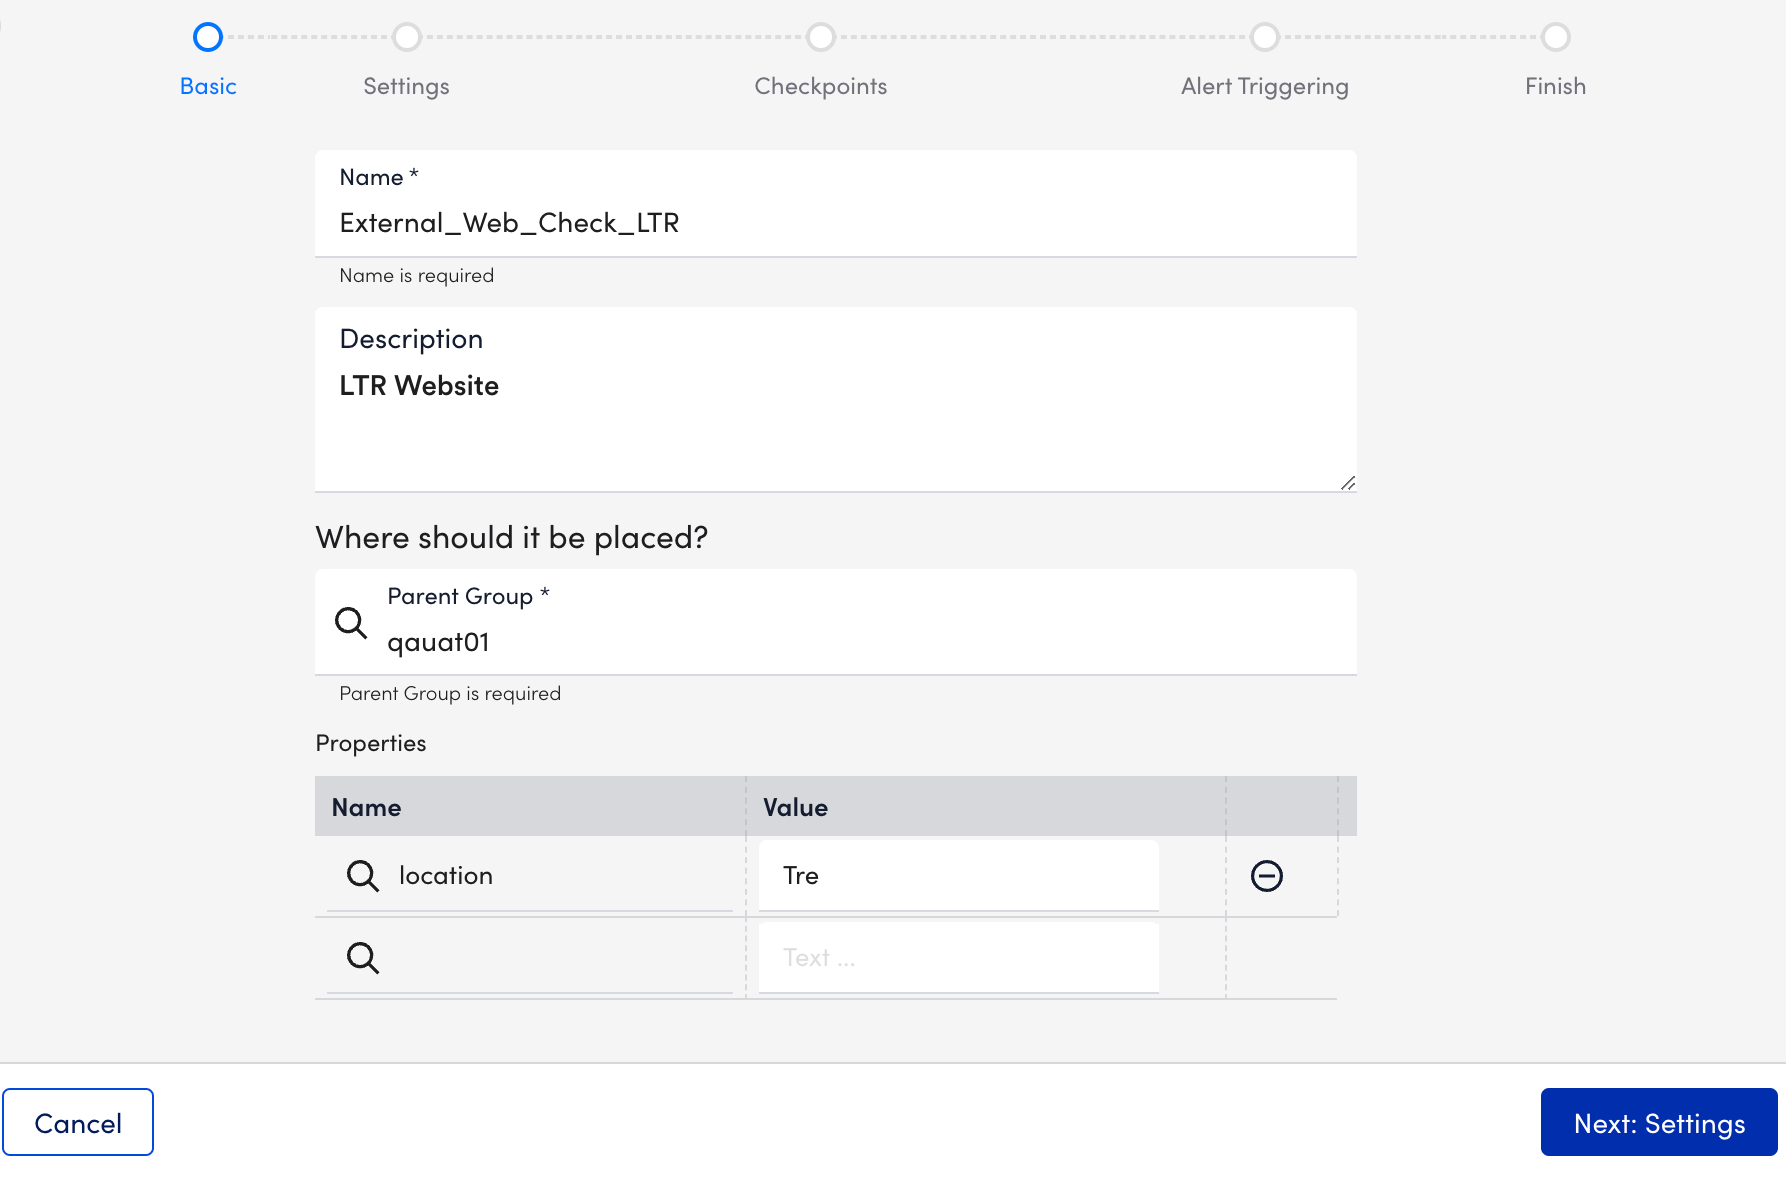
- Select Next: Settings.
- At the Settings step of the wizard, do the following:
Note: External Web Checks only support requests that are built based on pre-defined request settings.- In the Default root URL section, select
http://orhttps://protocol depending on your web server settings, and enter the website domain to which your Web Check request must be sent. - In the Step One URL path field, enter the first path that should be tested for your website. Enter the path relative to the website domain (For example,
/folder/page.htm). - In the HTTP Version field under Request, select the version of HTTP that must be used to make the request. The version you select is based on your website’s settings.
Note: You can determine this setting in the response headers using the Linux or Unix cURL command (For example,curl –head help.logicmonitor.com). - In the Method field under Request, select the HTTP method (GET, HEAD, or POST) that must be used to make the request.
If you select the POST option, additional configurations display that allow you to specify the data to be included in the request payload. In addition, the Formatted Data option allows you to specify how the data must be formatted. - Toggle on the Follow redirect switch to allow the HTTP request to follow any redirects configured for the URL. This toggle is on by default.
- (Optional) Toggle on the Wait for all page elements to load switch to allow the HTTP request to wait for all page elements (For example, headings, paragraphs, images) to load before checking the response.
- (Optional) Toggle on the Authentication required switch for requests that go to a page requiring either HTTP Basic authentication or NT LAN Manager (NTLM) authentication. Additional configurations display that allow you to specify the type of authentication and the authentication credentials that are used in the HTTP request.
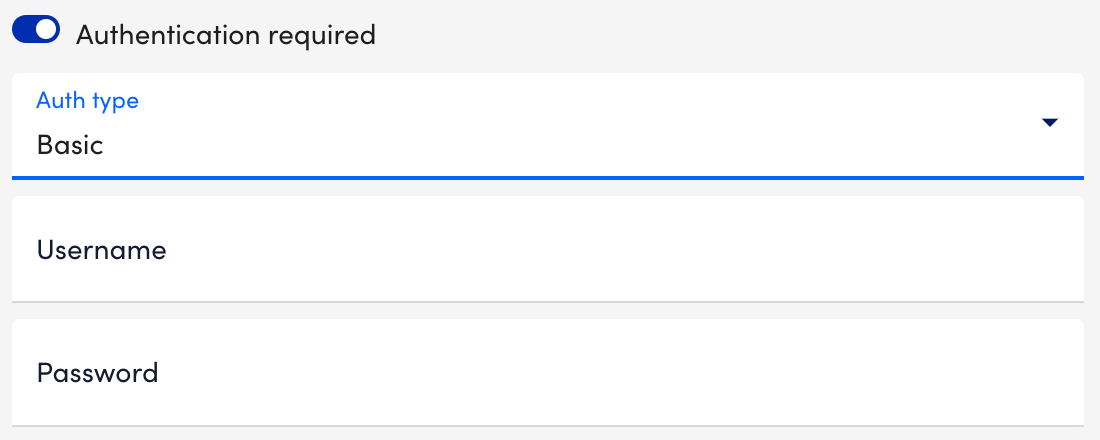
- Select the type of authentication (Basic or NTLM) used by the page from the Auth type dropdown menu.
Basic— HTTP Basic authentication passes the username and password as fields in an HTTP header.
NTML— NT LAN Manager (NTLM) is a suite of Microsoft security protocols that provides authentication, integrity, and confidentiality to users. This authentication type is usually recognizable by a grey dialog that prompts you for a username and password. - In the Username and Password fields, enter your authentication credentials. If using NTLM authorization, you are prompted to enter a domain as well.
- Under the HTTP Header table, add any header key-value pairs that should be included in the HTTP request.
- Select a format for the response to the HTTP request from the HTTP Response Format dropdown menu. Once selected, some of the fields on the page are dynamically updated allowing you to specify format-specific criteria that should be included in (or absent from) the response. If relying on the presence of a string, note that the entry is case-sensitive. Plain text/ string is the default value.
Note: If you select the XML option, additional configuration settings display, and Xpath processing does not support regular expressions. In order to find string matches in the page’s returned XML, you need to use the contains query, as displayed in the following screenshot. This query returns true if the string is present. For more information on a useful tool for testing Xpath queries, see freeformatter.com.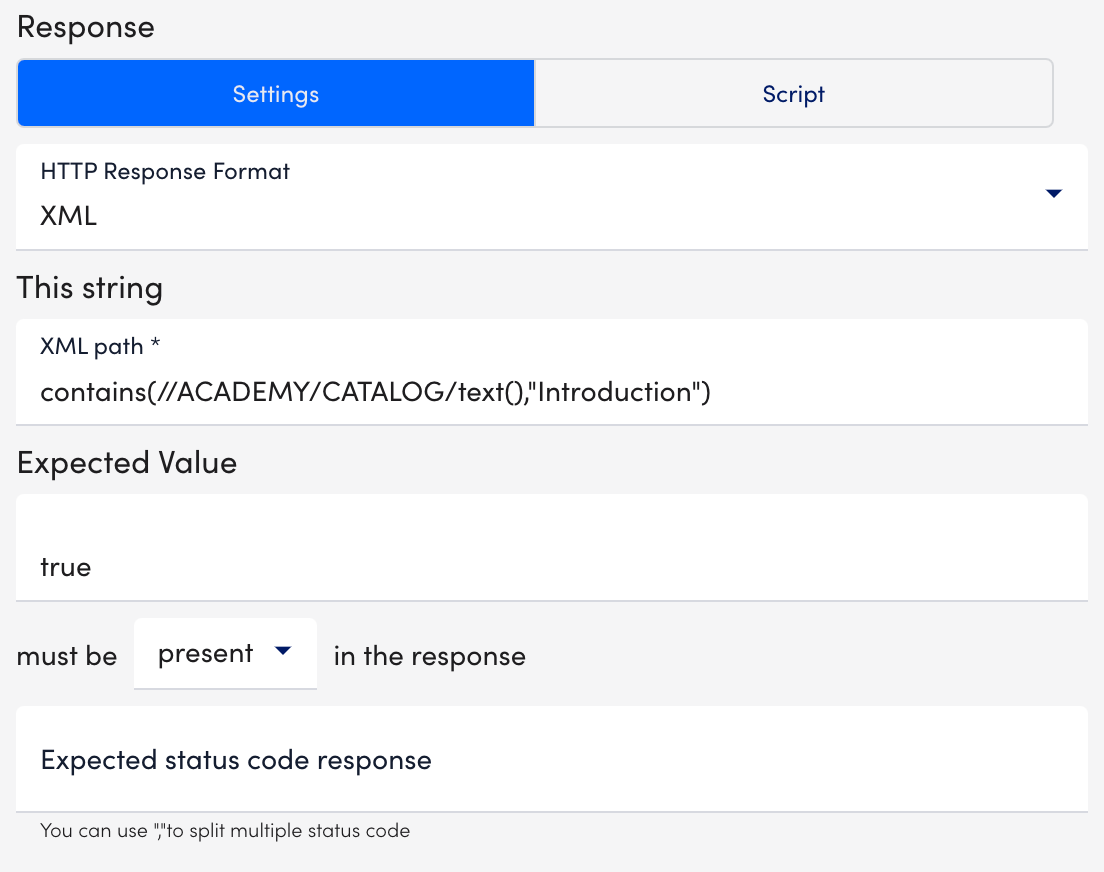
- In the Expected status code response field, enter the expected HTTP status codes that are included in the response. Enter only integers. Commas must separate multiple status codes. If no status is specified, a 200/OK response is expected.
Note: You can execute your web check using Groovy scripts. For more information, see Executing Web Checks using Groovy Scripts.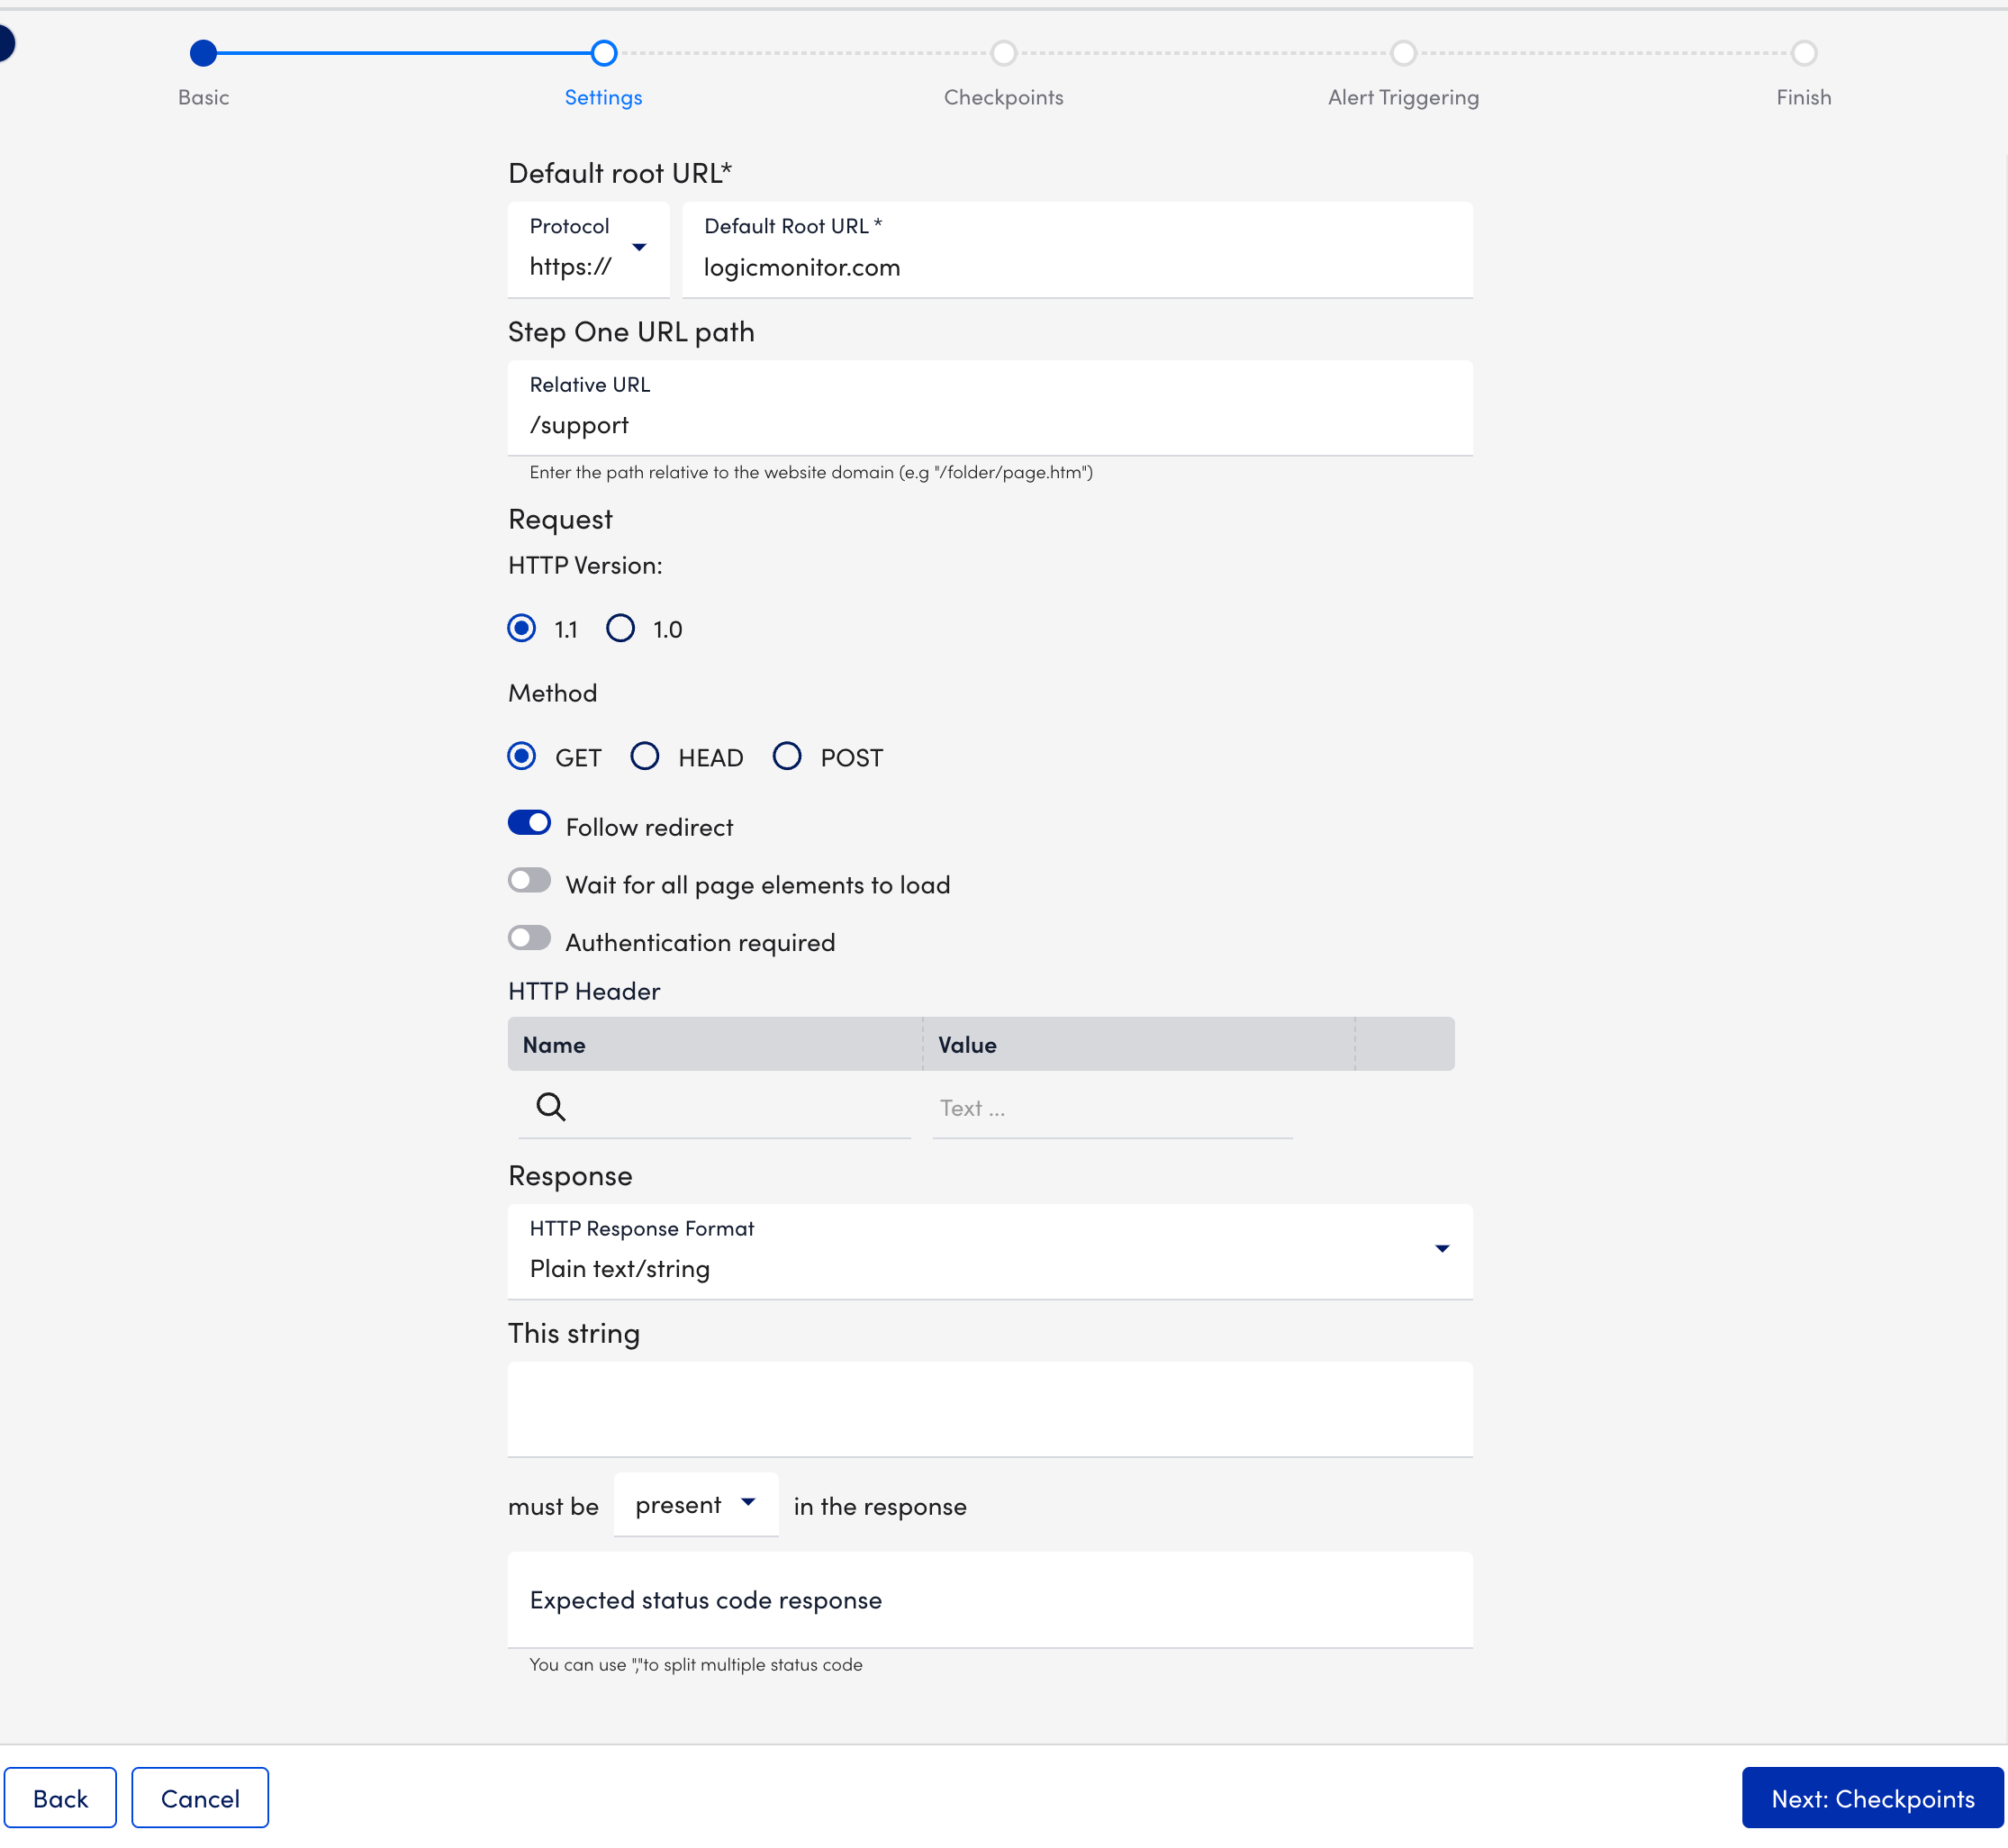
- In the Default root URL section, select
- Select Next: Checkpoints.
- At the Checkpoints step of the wizard, select the checkpoint location.
LogicMonitor hosts five geographically dispersed checkpoints, from which the check can be sent. All the checkpoint locations along with the Use Default Website Settings toggle are selected by default.
Note: If your External Web Check consists of multiple steps, the checkpoints configured here apply to all of these steps.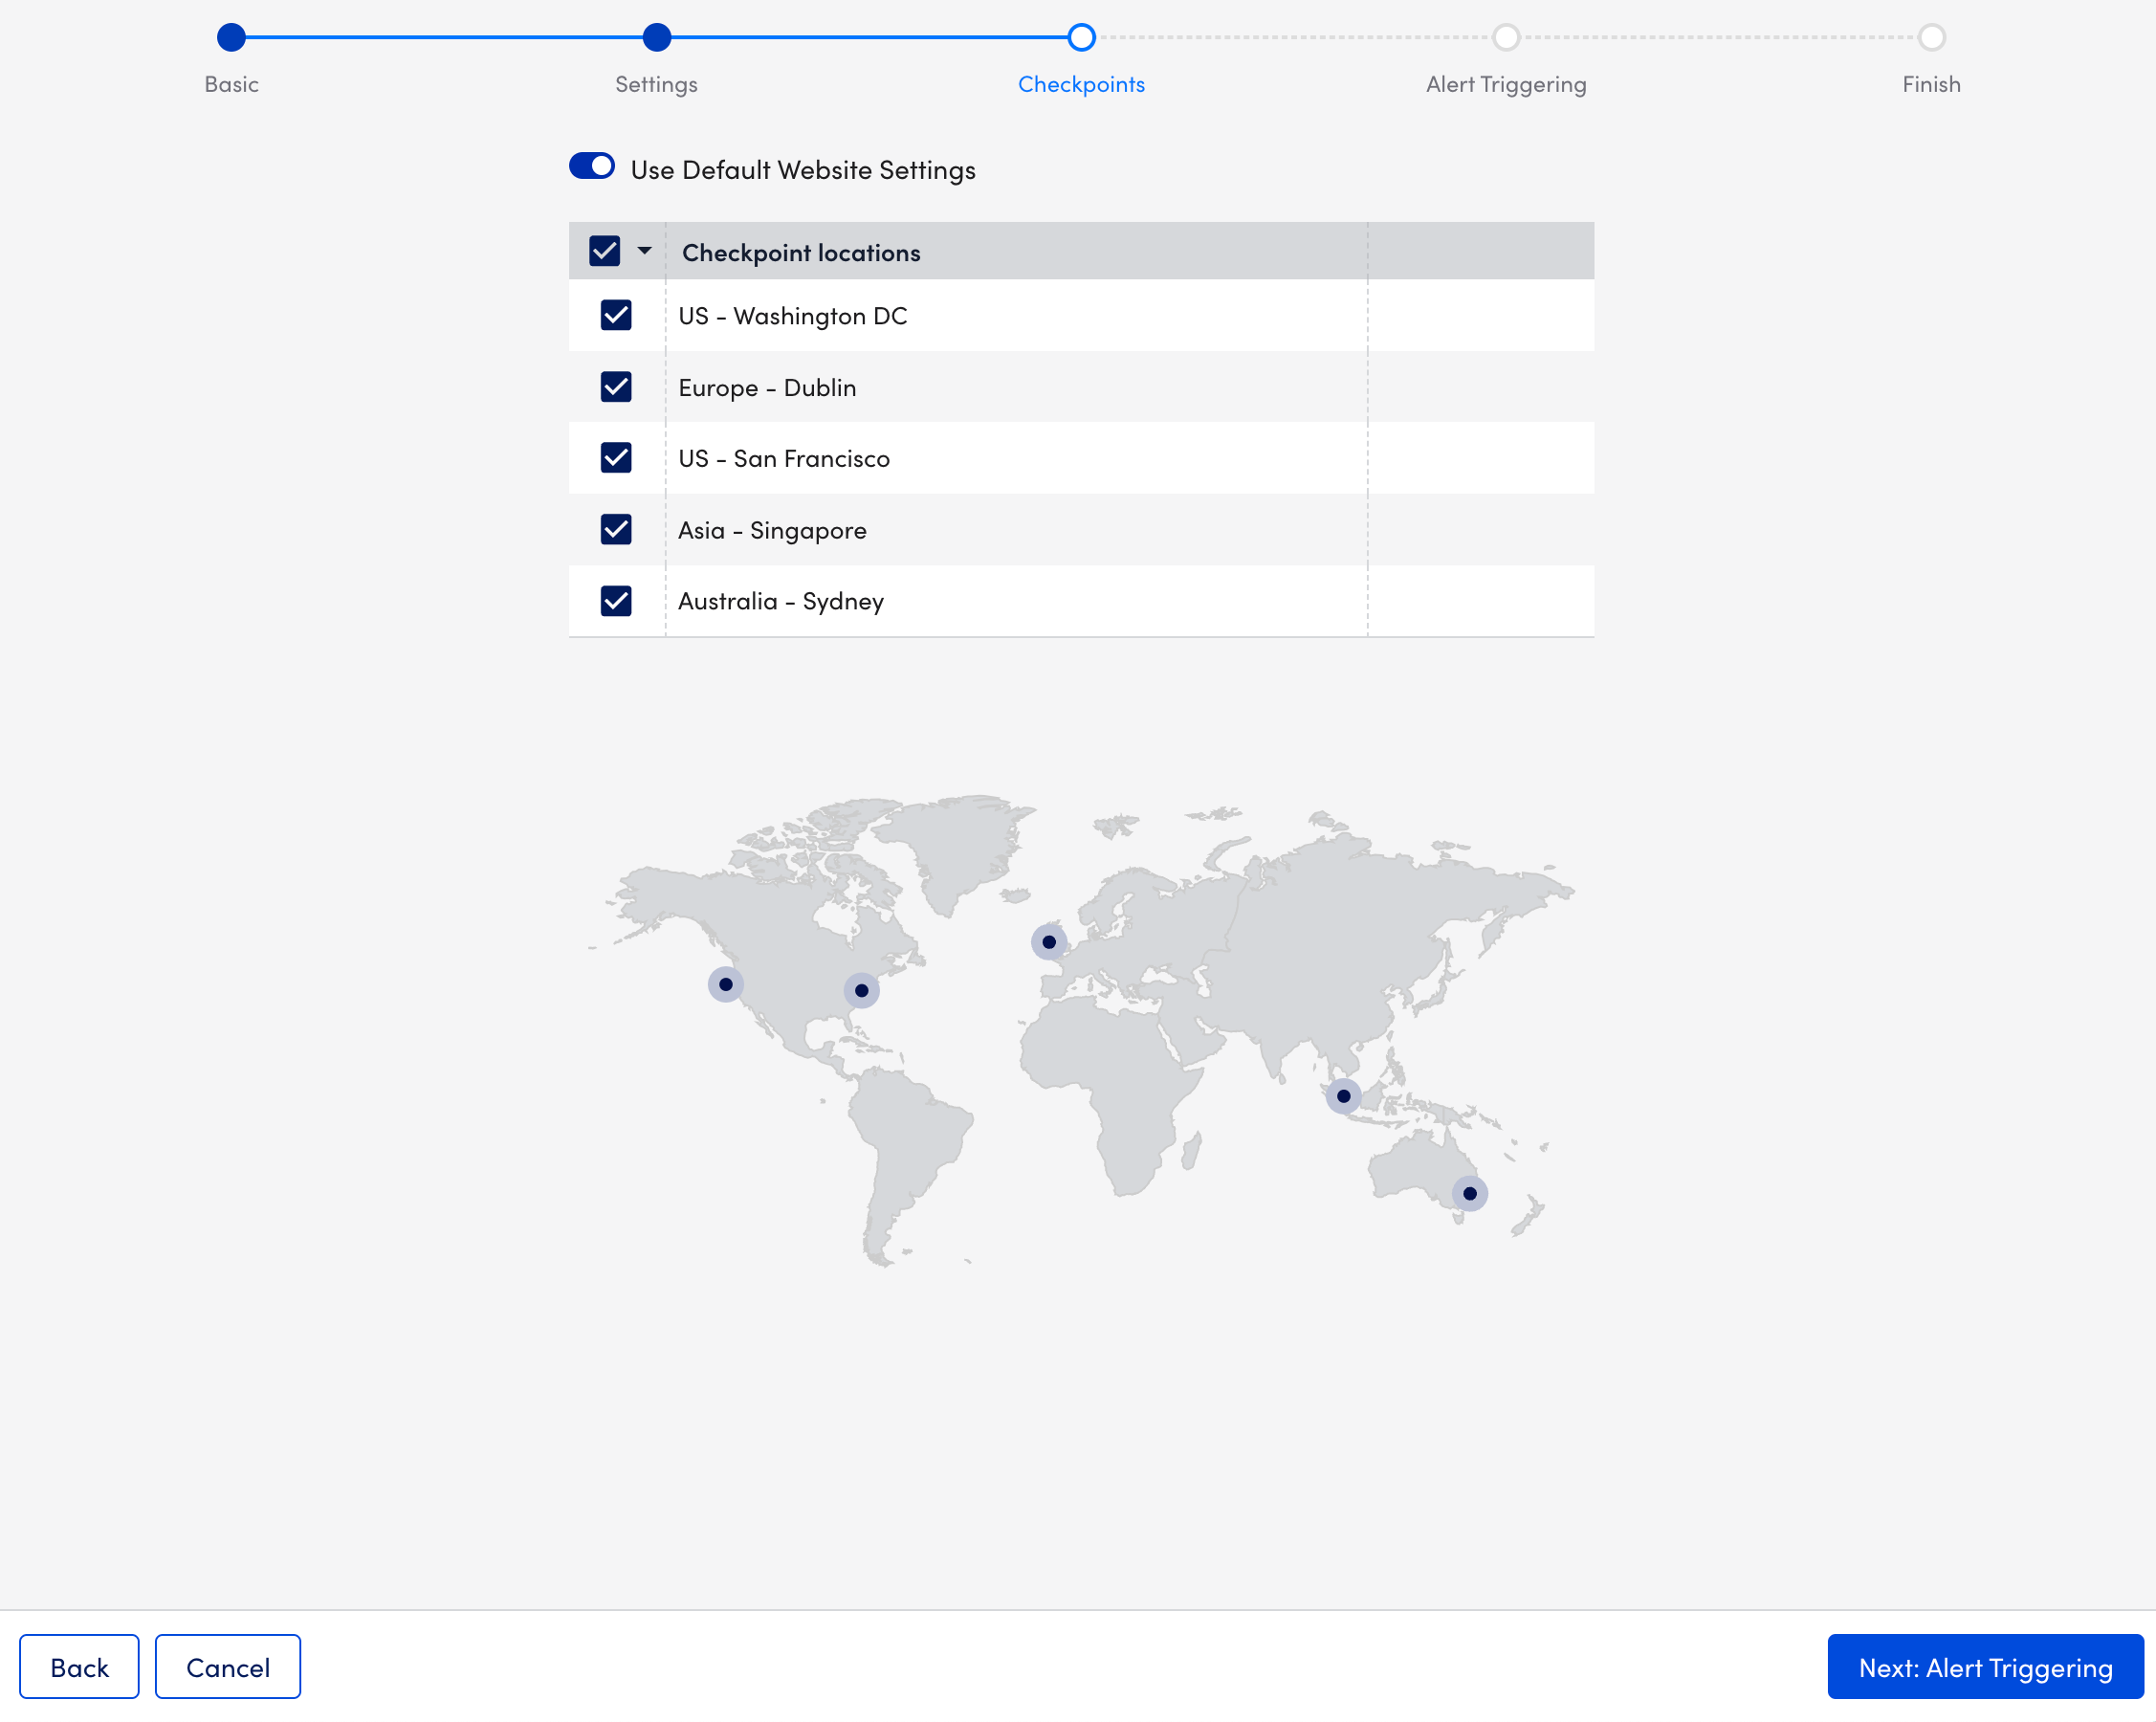
- Select Next: Alert Triggering.
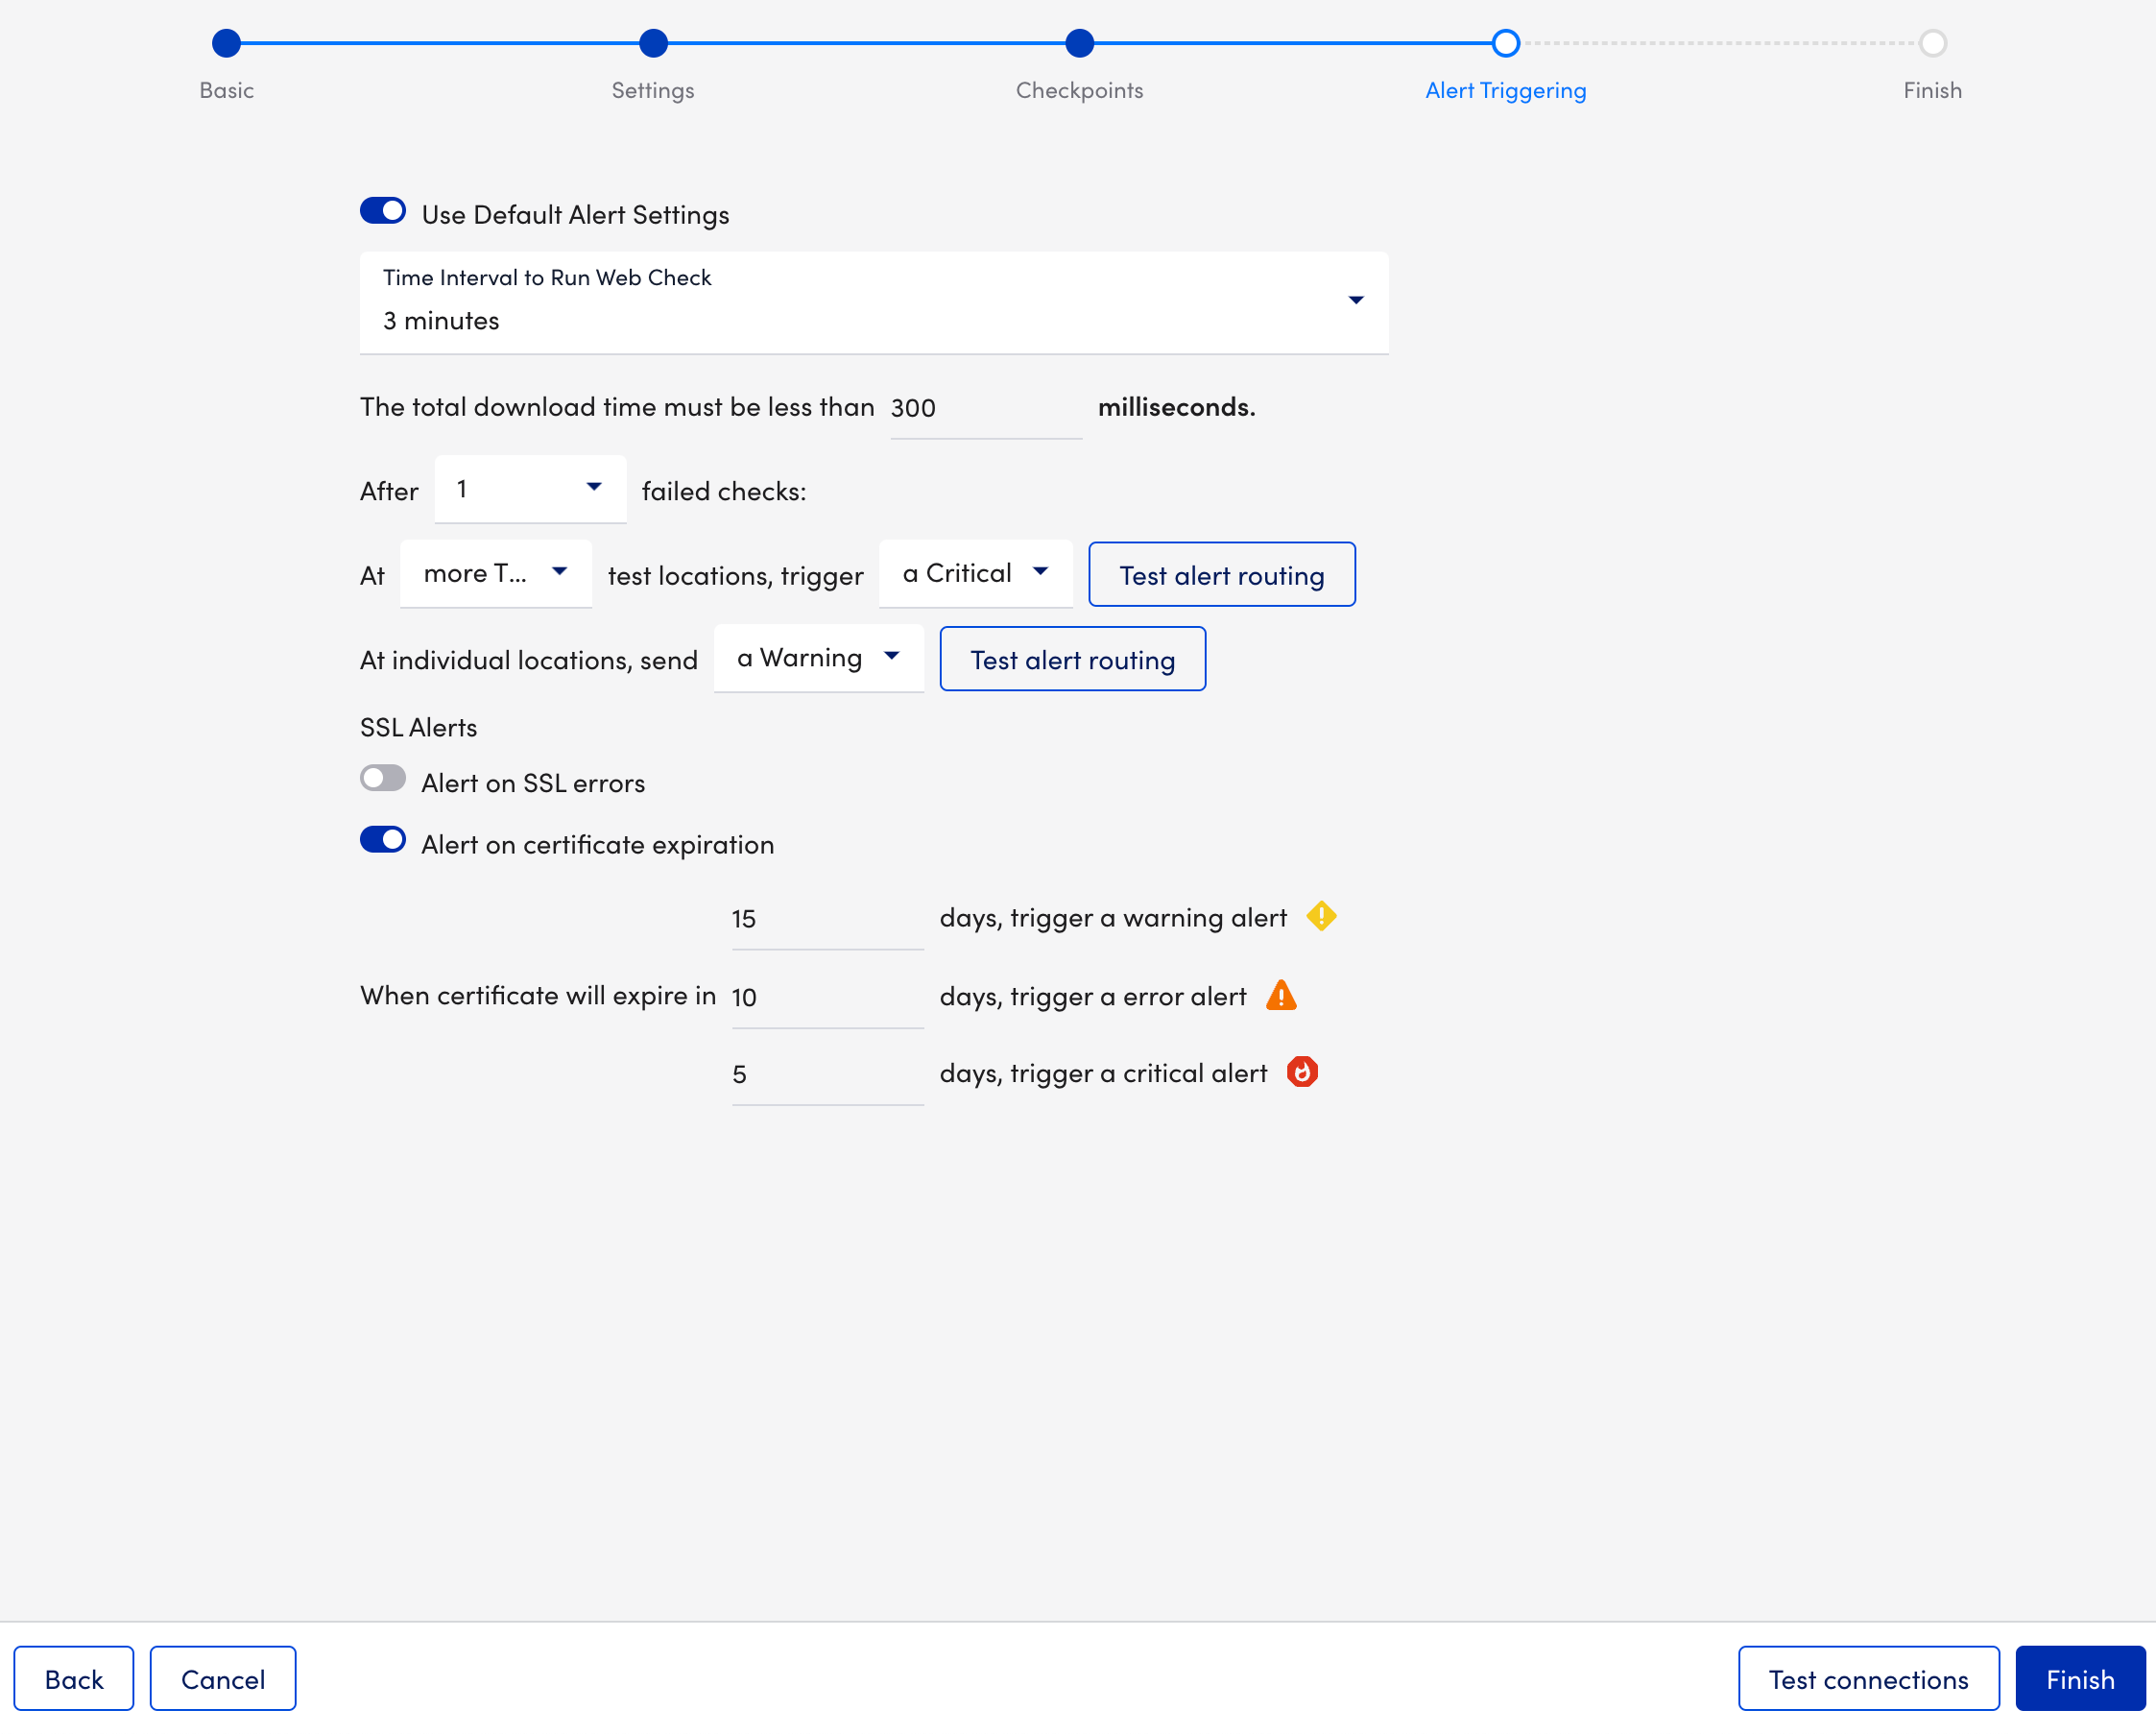
- At the Alert Triggering step of the wizard, do the following:
Note: If your External Web Check consists of multiple steps, the alert triggers configured here apply to all of these steps.- Select how often the designated checkpoints should check the website from the Time Interval to Run Web Check dropdown menu. You can choose from frequencies that range from once every 1 minute to a maximum of 10 minutes.
- In the total download time must be less than X milliseconds field, specify the number of milliseconds in which the website must load.
- Select the number of consecutive checks that must fail in order for an alert to be triggered from the After X failed checks dropdown menu. You can select the location and severity of the alerts.
- (Optional) Select Test alert routing to see what alert rule matches each condition, along with the escalation chain associated with that alert rule.
- Toggle on the Alerts on SSL errors switch to trigger alerts if a certificate experiences issues like unsupported algorithms, an untrusted or incomplete certificate chain, CName and HostName mismatch, or an expired certificate.
- (Optional) Toggle on the Halt on SSL errors switch to stop the Web Check and send an alert accordingly if any issues are encountered.
- Toggle on the Alert on certificate expiration switch and enter the number of days in advance of expiration in which you would like to receive a corresponding alert for each severity level.
- (Optional) Select Test connections to verify that the selected locations can successfully reach your website.
- Select Finish.
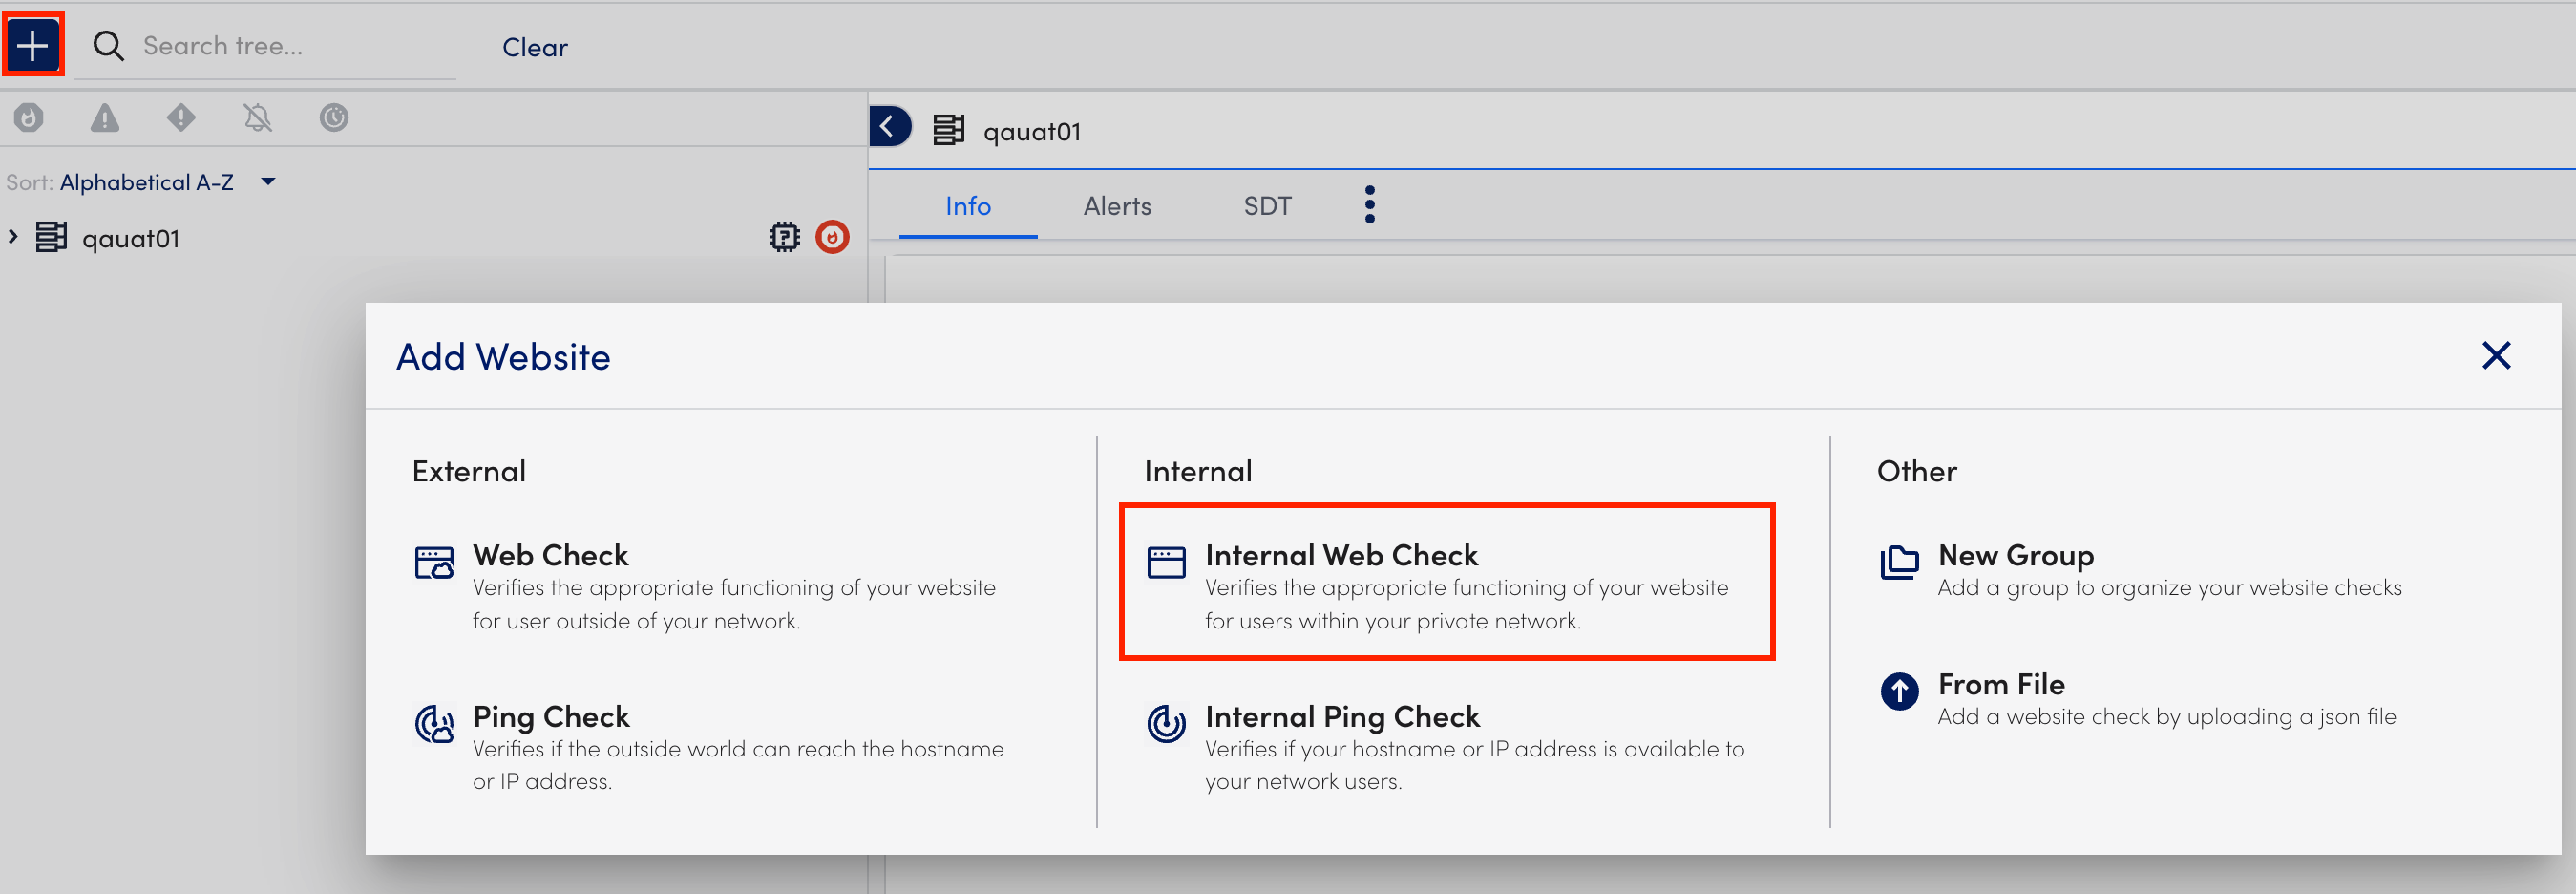
Creating Internal Web Checks
- In LogicMonitor, navigate to Websites > (Add) +> select Internal Web Check.
- At the Basic step of the wizard, do the following:
- In the Name field, enter a name for the Web Check.
- (Optional) In the Description field, describe the scope and purpose of the Web Check.
- Select from the existing group list from the Where should it be placed dropdown menu where the Web Check should belong. By default, the root (top-level) website group is selected.
- In the Properties table, add the relevant properties. For example, add
http.portwith the value80.
- Select Next: Settings.
- At the Settings step of the wizard, do the following:
Note: External Web Checks only support requests that are built based on pre-defined request settings.- In the Default root URL section, select
http://orhttps://protocol depending on your web server settings, and enter the website domain to which your Web Check request must be sent. - In the Step One URL path field, enter the first path that should be tested for your website. Enter the path relative to the website domain (For example,
/folder/page.htm). - In the HTTP Version field under Request, select the version of HTTP that must be used to make the request. The version you select is based on your website’s settings.
Note: You can determine this setting in the response headers using the Linux or Unix cURL command (For example,curl–head help.logicmonitor.com). - In the Method field under Request, select the HTTP method (GET, HEAD, or POST) that must be used to make the request.
If you select the POST option, additional configurations display that allow you to specify the data to be included in the request payload. In addition, the Formatted Data option allows you to specify how the data must be formatted. - Toggle on the Follow redirect switch to allow the HTTP request to follow any redirects configured for the URL. This toggle is on by default.
- (Optional) Toggle on the Wait for all page elements to load switch to allow the HTTP request to wait for all page elements (For example, headings, paragraphs, images) to load before checking the response.
- (Optional) Toggle on the Authentication required switch for requests that go to a page requiring either HTTP Basic authentication or NT LAN Manager (NTLM) authentication. Additional configurations display that allow you to specify the type of authentication and the authentication credentials that are used in the HTTP request.
- Select the type of authentication (Basic or NTLM) used by the page from the Auth type dropdown menu.
Basic— HTTP Basic authentication passes the username and password as fields in an HTTP header.
NTML— NT LAN Manager (NTLM) is a suite of Microsoft security protocols that provides authentication, integrity, and confidentiality to users. This authentication type is usually recognizable by a grey dialog that prompts you for a username and password. - In the Username and Password fields, enter your authentication credentials. If using NTLM authorization, you are prompted to enter a domain as well.
- Under the HTTP Header table, add any header key-value pairs that should be included in the HTTP request.
- Select a format for the response to the HTTP request from the HTTP Response Format dropdown menu. Once selected, some of the fields on the page are dynamically updated allowing you to specify format-specific criteria that should be included in (or absent from) the response. If relying on the presence of a string, note that the entry is case-sensitive. Plain text/ string is the default value.
Note: If you select the XML option, additional configuration settings display, and Xpath processing does not support regular expressions. In order to find string matches in the page’s returned XML, you need to use the contains query, as displayed in the following screenshot. This query returns true if the string is present. For more information on a useful tool for testing Xpath queries, see freeformatter.com. - In the Expected status code response field, enter the expected HTTP status codes that are included in the response. Enter only integers. Commas must separate multiple status codes. If no status is specified, a 200/OK response is expected.
Note: You can execute your web check using Groovy scripts. For more information, see Executing Web Checks using Groovy Scripts.
- In the Default root URL section, select
- Select Next: Checkpoints.
- At the Checkpoints step of the wizard, specify the Collectors that send the checks. The Use Default Website Settings toggle is selected by default.
Note: Your user account must have Collector view permissions to view and select Collectors. For more information, see Roles.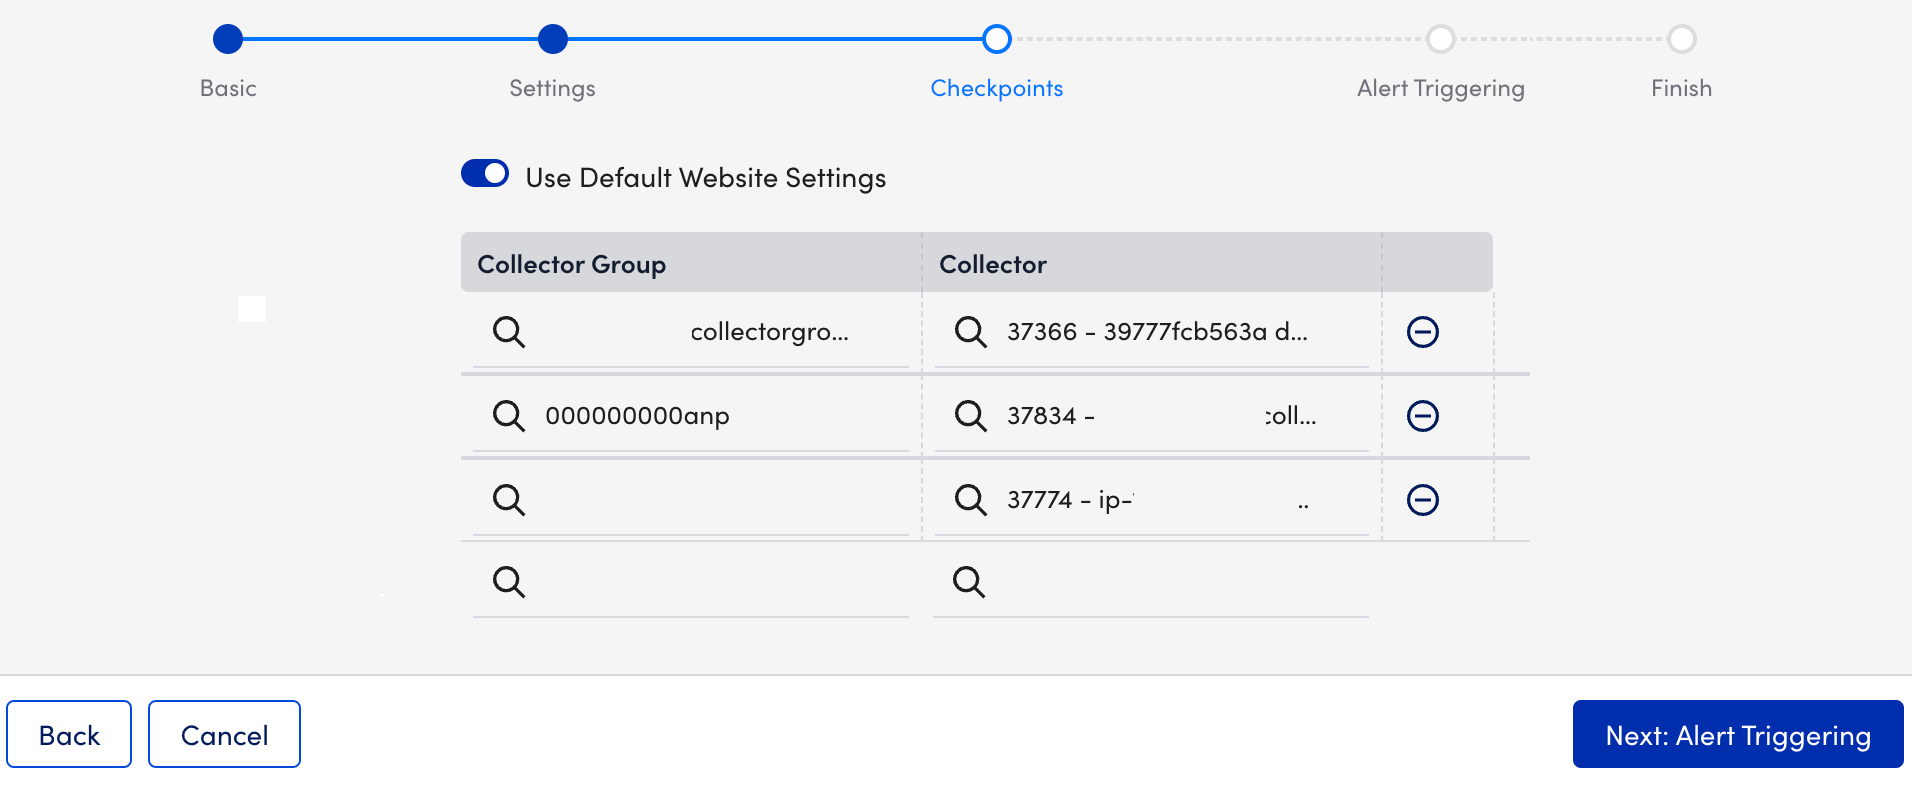
- Select Next: Alert Triggering.
- At the Alert Triggering step of the wizard, do the following:
Note: If your External Web Check consists of multiple steps, the alert triggers configured here apply to all of these steps.- Select how often the designated checkpoints should check the website from the Time Interval to Run Web Check dropdown menu. You can choose from frequencies that range from once every 1 minute to a maximum of 10 minutes.
- In the total download time must be less than X milliseconds field, specify the number of milliseconds in which the website must load.
- Select the number of consecutive checks that must fail in order for an alert to be triggered from the After X failed checks dropdown menu. You can select the location and severity of the alerts.
- (Optional) Select Test alert routing to see what alert rule matches each condition, along with the escalation chain associated with that alert rule.
- Toggle on the Alerts on SSL errors switch to trigger alerts if a certificate experiences issues like unsupported algorithms, an untrusted or incomplete certificate chain, CName and HostName mismatch, or an expired certificate.
- (Optional) Toggle on the Halt on SSL errors switch to stop the Web Check and send an alert accordingly if any issues are encountered.
- Toggle on the Alert on certificate expiration switch and enter the number of days in advance of expiration in which you would like to receive a corresponding alert for each severity level.
- (Optional) Select Test connections to verify that the selected locations can successfully reach your website.
- Select Finish.
