
Alert SLA Report
Last updated – 29 December, 2025
The Alert Service Level Agreement (SLA) report displays the amount of time that a set of resources are in warning, error, or critical alert status over a specified period of time. This report also calculates the total percentage of time that the resources were not in alert status for that same given time period. You can use this report to display the percent of time that a resource datapoint value falls out of the normal range, where normal is defined by alert thresholds.
You can use the Alert SLA report to do the following:
- Monitor your service SLAs, whether that includes resource groups, a single resource, or specific instances and datapoints.
- Communicate to customers that you are meeting the SLAs defined in their contracts. You can configure different thresholds for each customer and use the Alert SLA report to communicate the percent of time the services you provide are available. For more information, see Static Thresholds for Datapoints.
Note: If you want to evaluate how effectively your resources met their SLAs using metrics other than alert thresholds, consider creating an SLA report instead. The SLA report type lets you choose what constitutes an acceptable service level. For more information, see Service Level Agreement Report.
Configuring an Alert SLA Report
- In LogicMonitor, navigate to Reports.
- Select
 > Add Report > select Add for the Alert SLA report.
- In the Name field, enter a name for the report.
Report names cannot include the operators and comparison functions used in LogicMonitor’s datapoint expression syntax. - (Optional) In the Description field, enter a description for the report.
For example, you can enter a description of the specific purpose of the report. - From Report Group, select the report group where your report is stored.
Matching groups display as you type, and you can select the group from the list. - From Format, select the type of format for the output of the report.
You can select HTML, PDF, or CSV.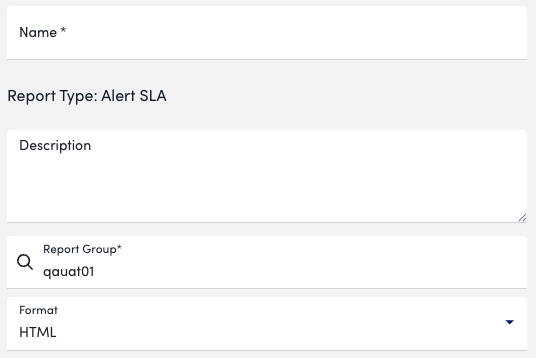
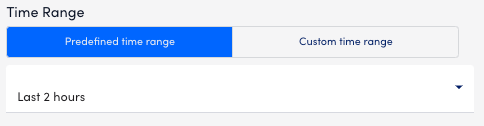
- In the Time Range section, do one of the following to configure the time range that you want the report to display information for:
- To configure a set time range, choose Predefined time range, and then select a time range.
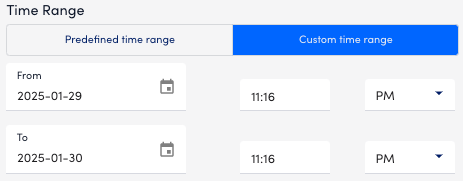
- To configure a custom time range, choose Custom time range, and then configure the following:
- Enter or choose a date in the From field, and then configure the settings to define the time you want the report to start at.
- Enter or choose a date in the To field, and then configure the settings to define the time you want the report to end at.
- To configure a set time range, choose Predefined time range, and then select a time range.
- Do one of the following to base the Alert SLA report on resources or resource groups:
- To add a resource group, select Resource Group and enter the name of a resource group from the Resource Group field.
LogicMonitor attempts to match values as you type.
- To add a resource group, select Resource Group and enter the name of a resource group from the Resource Group field.
Note: You can select a combination of both glob and distinct values to specify your resources or resource groups. For more information, see Using Glob Expressions Throughout the LogicMonitor Portal.
- To add a resource, select Resource and enter the name of a resource from the Resources field. LogicMonitor attempts to match values as you type.
Note: You can select a combination of both glob and distinct values to specify your resources or resource groups. For more information, see Using Glob Expressions Throughout the LogicMonitor Portal.
- In the DataSource Instances field, enter a DataSource instance that has datapoint values you want to evaluate.
LogicMonitor attempts to match values as you type.
You can use a wildcard to include all instances. - In the Datapoints field, enter one or more datapoints to evaluate against the alert thresholds.
You can use an explicit name, a glob expression, or a wild card to include all datapoints. - In the Alert Rule field, specify the alert rule you want to use to evaluate and route alerts.
LogicMonitor attempts to match values as you type. - From the Severity dropdown menu, select the minimum alert status severity you want to use to evaluate the specific resource groups or resources.
- In Report Schedule settings, do the following to configure the report to generate on a schedule:
- Toggle the Generate this report on a schedule switch.
- From Frequency, select how frequent you want the report to generate, and then configure when you want the report to generate.
For example, if you configure the report to generate daily, you can choose the time to generate the report each day. If you configure the report to generate weekly, you can choose the day of the week and time to generate the report for the selected date. If you configure the report to generate monthly, you can configure the day of the month and time to generate the report.
Each frequency option provides you a setting for selecting the time zone. - In Recipients Email, enter the name of the user you want to receive the generated report. You can also add recipient groups.
You can enter as many users as needed.
LogicMonitor attempts to match values as you type.
The recipients you add to the report are emailed a generated report based on the format you configured and the email associated with the username.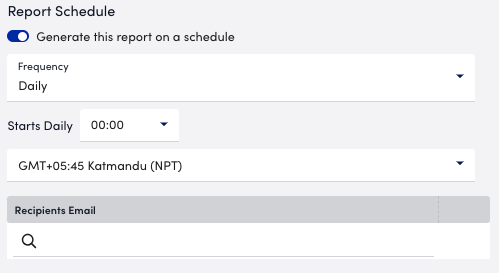
- Do one of the following to save the report:
- Select Save.
The report saves to the Report Group you selected.
If you configured the report to generate on a schedule, the report generates and sends to recipients based on the frequency you configured. - Select Save and Run.
The report saves to the Report Group you selected and generates a report based on the format you configured.
If you configured the report to generate on a schedule, the report generates and sends to recipients based on the frequency you configured.
- Select Save.
