
Disclaimer: This content applies to the legacy UI and is no longer maintained. It will be removed at a future time. For up-to-date content, see Service Level Agreement Report. At the time of removal, you will automatically be redirected to the up-to-date content.
SLA Report
Last updated - 25 July, 2025
Overview
The SLA report calculates the percentage of time in which acceptable service levels were maintained for the resources or websites included in the report. Acceptable service levels are defined in the report’s configurations.
How Is the SLA Report Calculated?
For each individual website or resource included in your SLA report, the baseline calculation is quite simple. It is the amount of time the resource or website actually met its acceptable service levels as compared to the amount of time covered by your SLA.
However, there are times when the individual SLA value for a website or resource is aggregated with the SLA values of other website(s) or resource(s) monitored by the report. This is the case when (a) multiple websites or resources are selected as a single metric or (b) when the SLA report is providing an overall, single SLA summary value for all websites or resources monitored. For these cases, there are potentially two calculation options available to you, depending upon whether you’re measuring performance across websites or resources.
Measuring Performance Across Websites
When running the SLA report for websites, the aggregated SLA value is calculated by averaging the percentage of time in which acceptable service levels were maintained by the individual websites. For example, consider that an SLA report is measuring the availability of the following four websites over a one-day period:
- Website A: Unavailable from 8-9am; 95.83% (23/24 hours)
- Website B: Unavailable from 9-10am; 95.83% (available 23/24 hours);
- Website C: No unavailability; 100% (24/24 hours)
- Website D: Unavailable from 8:30-9:30am; 95.83% (23/24 hours)
The overall aggregated SLA value for websites A, B, C and D is 96.87%, which is the average of their individual availabilities.
Measuring Performance Across Resources
When running the SLA report for resources, there are two calculation methods available for determining the aggregated SLA value. One of the methods is the one described in the previous section (i.e. averaging the percentage of time in which acceptable service levels were maintained by the individual resources).
The other calculation method measures the percentage of time in which all resources concurrently met their individual thresholds for acceptable service levels. For example, consider that an SLA report is measuring performance thresholds for the following four resources over a one-day period:
- Resource A: Fell below defined threshold of acceptable service level from 8-9am
- Resource B: Fell below defined threshold of acceptable service level from 9-10am
- Resource C: Met acceptable service level threshold all day
- Resource D: Fell below defined threshold of acceptable service level from 8:30-9:30am
Based on these metrics, the total window of time in which at least one resource was performing at a subpar level was from 8-10am, which evaluates to an overall SLA value of 91.67%. If these four resources were calculated using the average approach of the other calculation method, the overall SLA value would be 96.87%
Configuring an SLA Report
To configure an SLA report, select Reports | Add | Report | SLA Report. A report dialog appears that allows you to configure various report settings.
Configuring Settings Common to All Report Types
The first four settings that are found in the report dialog (Title, Description, Group, and Format), along with the final setting (Generate this report on a schedule), are universal to all report types. To learn more about these global report settings, see Creating and Managing Reports.
Configuring SLA Report Settings
In the SLA Report Settings area of the report configuration dialog, shown and discussed next, specify settings particular to the SLA report.
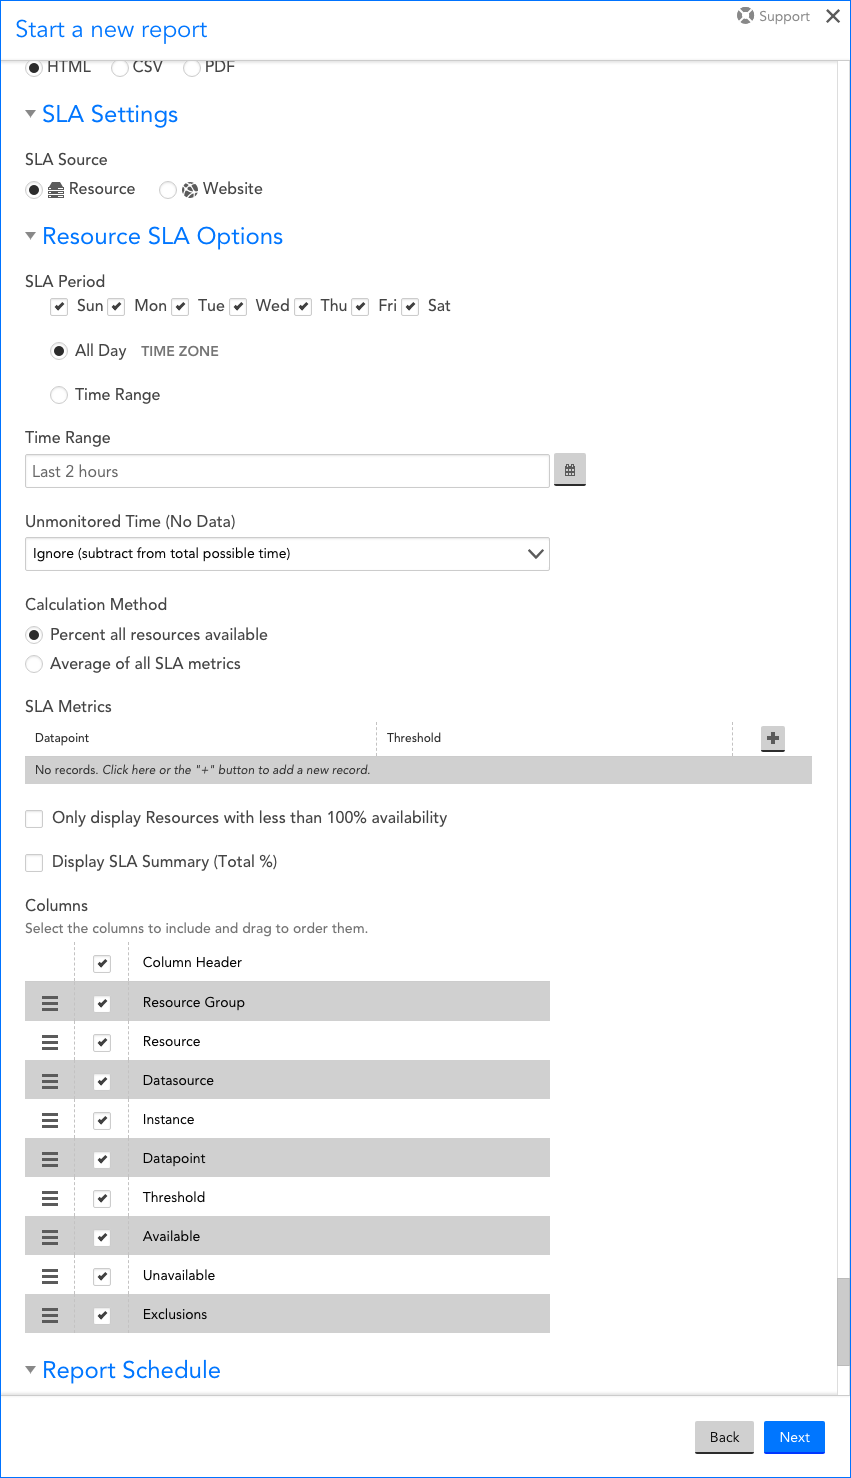
SLA Source
For the SLA Source option, indicate whether the report will monitor SLAs for a set of resources or websites.
SLA Period
Using the configurations under this heading, indicate the period (days and time) in which the SLA is in effect. Select the All Day option if your SLA spans all 24 hours of the selected days. If the SLA does not cover days in their entireties, select the Time Range option to indicate a window of time, down to the quarter hour, within each day that the SLA spans.
Note: This section should reflect the time range of your actual SLA, not the time range of the report. The report’s time range is determined in the next configuration.
Time Range
Click your cursor into the Time Range field to display the options available for setting a predefined or custom duration of time for which data will be pulled for this report.
Unmonitored Time (No Data)
Note: This field is only available if you previously selected “Resource” as the option for the SLA Source field.
The Unmonitored Time (No Data) field allows you to establish what impact, if any, the amount of time in which no data was reported for the resources has on the SLA calculation. There are three options available for selection from this field’s dropdown menu:
- Ignore (subtract from total possible time). This option does not include unmonitored time in its SLA calculations. For example, if your report’s time range spans 100 hours, of which there are five hours of missing data, the report will calculate the SLA value based on a total time range of 95 hours.
- Count as violation (subtract from uptime). This option will consider any unmonitored time as a violation against your SLA. For example, if your report’s time range spans 100 hours, of which 15 of those hours represent performance that doesn’t meet SLA thresholds and five of those hours represent no data received, the report will calculate SLA violation time as 20 hours, which results in an overall SLA value of 80%.
- Count as available (add to uptime). This option will consider any unmonitored time as meeting SLA requirements. For example, if your report’s time range spans 100 hours, of which 15 of those hours represent performance that doesn’t meet SLA thresholds and five of those hours represent no data received, the report will calculate SLA violation time as 15 hours, which results in an SLA value of 85%.
Calculation Method
Note: This field is only available if you previously selected “Resource” as the option for the SLA Source field.
As detailed in the How Is the SLA Report Calculated? section of this support article, there are two calculation methods available when aggregating SLA values among multiple resources. The Percent of all resources available option measures the percentage of time in which resources concurrently met their individual thresholds for acceptable service levels; the Average of all SLA metrics option averages the percentage of time in which acceptable service levels were maintained by the individual resources.
Specifying Resources or Websites Included in the SLA Report
The configurations you see in this area vary depending on whether you selected “Resource” or “Website” for the SLA Resource field.
Specifying Resources and Their Metrics
Click the + icon located at the top right of the Datapoint table to identify the datapoints that will be tracked by this report (along with corresponding SLA thresholds that must be met). From the dialog that expands, configure the following fields and options:
- Use the Group, Resource, DataSource, Instance, and Datapoint fields in combination to add a single metric. Multiple metrics can be added, but they must be configured and saved one at a time.
Note: If a single metric applies to multiple resources, the report will aggregate the SLA value for that metric using the calculation method selected in the Calculation Method field.
- For each datapoint, specify the DataSource SLA Threshold using the dropdown operator menu and field immediately to the right of it. If you’d like to refer to the global thresholds (warning, error, and critical) already established for this datapoint for help in determining the threshold for this report, click the View current Global Thresholds (for reference) hyperlink to display them.
- Check the Exclude SDT periods checkbox to remove scheduled downtime (SDT) from the SLA calculations. SDT exclusion can be set at the resource or group level. If the exclusion is set at the resource level, then only SDT set at the resource level will be excluded from the SLA calculation. Any SDT set at the group level for those resources will NOT be excluded in this case. If the exclusion is set at the group level, then only SDT set at the group level will be excluded from the SLA calculation. For example, consider that you have SDT set for a group from 8-9pm each Wednesday. One of the resources in the group additionally has SDT set for 5-6pm each Thursday. If this option is configured for the resource level, the Thursday 5-6pm SDT will be excluded. If this option is configured for the group level, the Wednesday 8-9pm SDT period will be excluded.
Check the Only display Resources with less than 100% availability option to exclude resources that achieved a 100% SLA value from the report’s display output, allowing you to better focus in on areas of improvement. This option only affects the report’s display, not its calculations.
Check the Display SLA Summary (Total %) if you would like the SLA report’s output to include an overall, single SLA summary value for all websites or resources monitored. This summary value will be calculated using the method selected in the Calculation Method field.
Specifying Websites
Click the + icon located at the top right of the Website table to identify the websites that will be tracked by this report. Use the Group and Website fields in combination to add a website metric. Multiple metrics can be added, but they must be configured and saved one at a time.
Check the Exclude SDT periods checkbox to remove scheduled downtime (SDT) from the SLA calculations.
Columns
Uncheck any columns that you would like to exclude from the report. To reorder columns, grab the icon to the far left of a column name and drag and drop the column into its new position.
