
Open Relevant Alerts and Resources from Topology Maps
Last updated - 12 December, 2023
Topology maps offer convenient methods of portal navigation, allowing you to quickly gather additional context.
Open Relevant Alerts
By default, topology maps identify the alert status of all mapped resources. This is key to troubleshooting alerts and identifying when a series of events are related to the same root cause.
As shown next, if an alert icon is associated with a resource in your topology map, you can select the alert icon to open a complete list of active alerts for that resource.

Note: Not only can you generate a list of relevant alerts from a topology map, but you can also generate a relevant topology map from an individual alert on the Alerts page. For more information, see Managing Alerts from the Alerts Page.
Open Resources
Double-select any vertex on a topology map to navigate directly to the resource it represents. The Resources page will open in a new browser tab with the resource in focus on the Maps tab.
Displaying Header Graph
Requirements for displaying header graph:
You must enable the Header Graph on the Alerts page.
For assistance, contact LogicMonitor Support.
- Select the More Options
 icon located in the upper right corner of the Mapping page and select Header Graph.
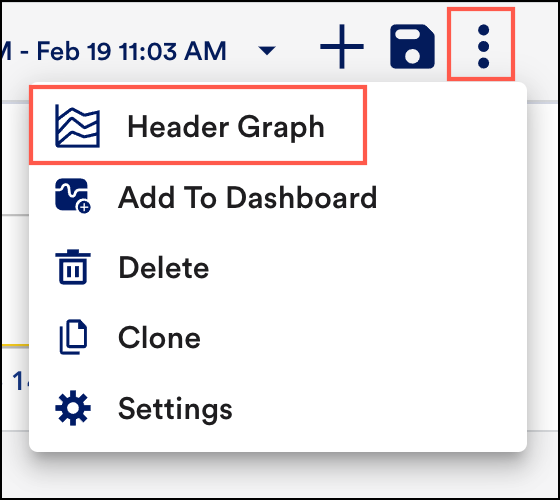
The graph will retain your prior groupings (dimensions) while reflecting the alerts currently listed in the alert table. - Select Header Graph to view visual grouping alerts. The alerts in the alert table can also be viewed as a time-series graph.
The graph is highly interactive, allowing you to:
- Zoom in on a time range by selecting and dragging across the desired timeframe.
- Select a grouping in the legend or in the graph itself to quickly include or exclude that group of alerts.
As you interactively change the graph’s filters, the alert table automatically updates to remain in sync—and vice versa.
