Dashboards Page
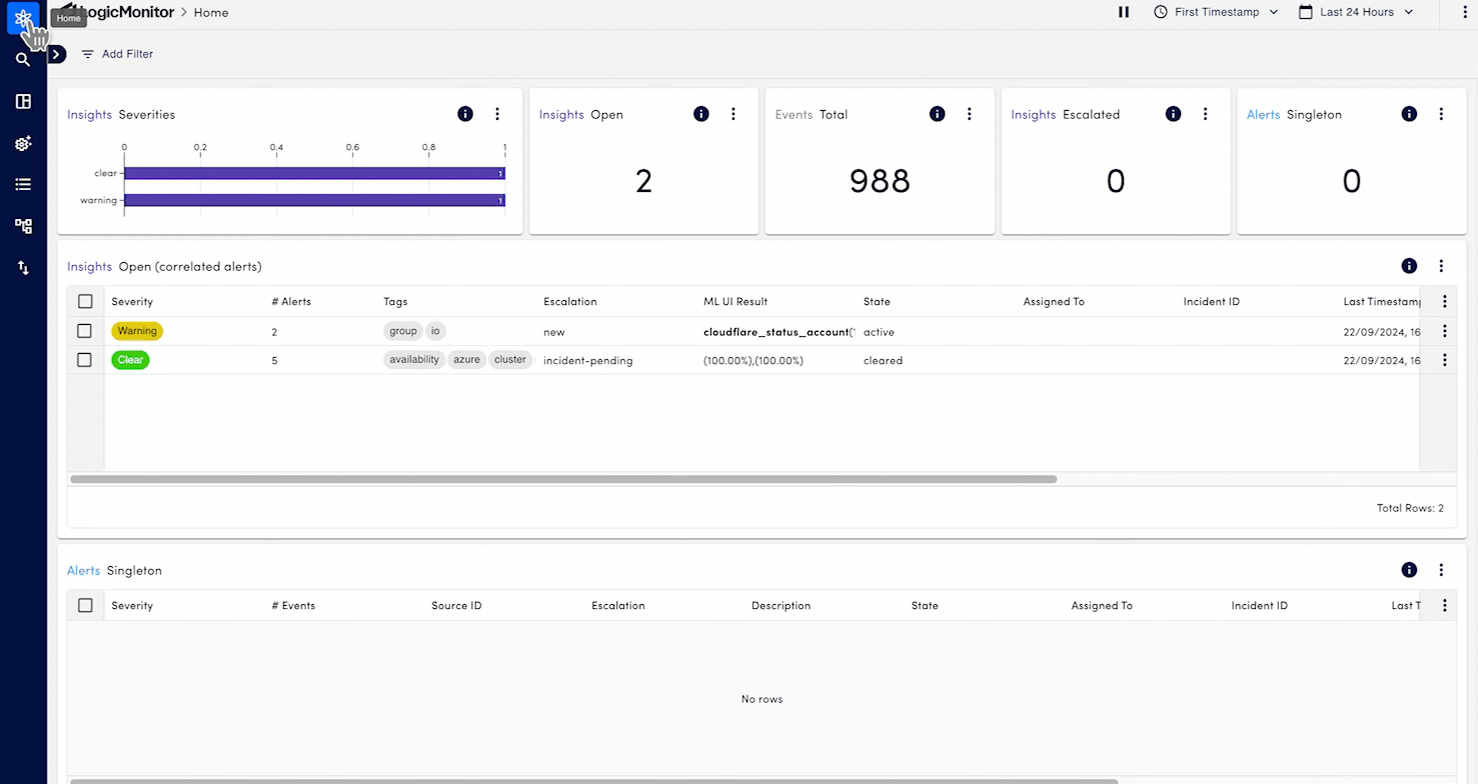
Last updated on 16 October, 2024Dashboards are central in Edwin AI as a starting point from where you can quickly get a situation overview. Dashboards visualize data using charts of different types. Charts get information from the different data records stored in Edwin AI – insights, alerts, and events. You can add filtering to charts to customize the visualization output for specific purposes and user groups.
Before building a dashboard, you will need to understand the types of charts and filters. For information on creating a dashboard, see Creating a Dashboard.
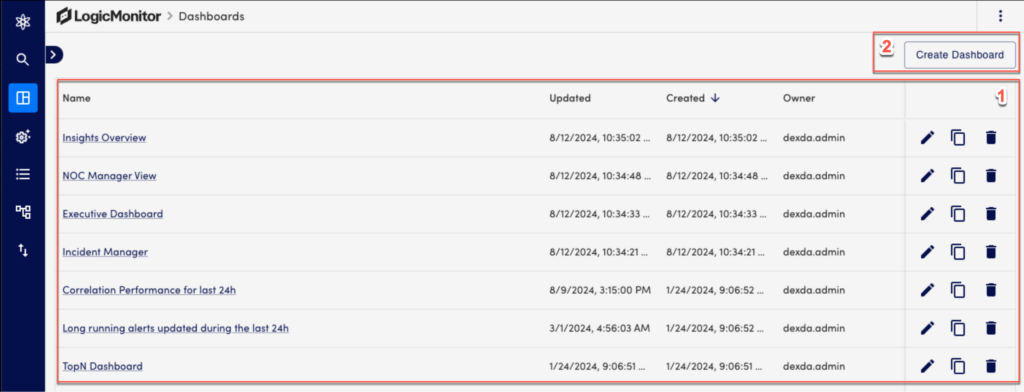
To access dashboards, navigate to Edwin AI > Dashboards.
| Section | Description | Related Links |
| 1 – Dashboards List | You can create more than one dashboard based on the type of insight you wish to supervise. In the end of each dashboard, you have more options to edit, clone, or delete a dashboard. | About Dashboards |
| 2 – Create a Dashboard | Select this to go to the configuration page of a new dashboard. | Create a Dashboard |
| Section | Description | Related Links |
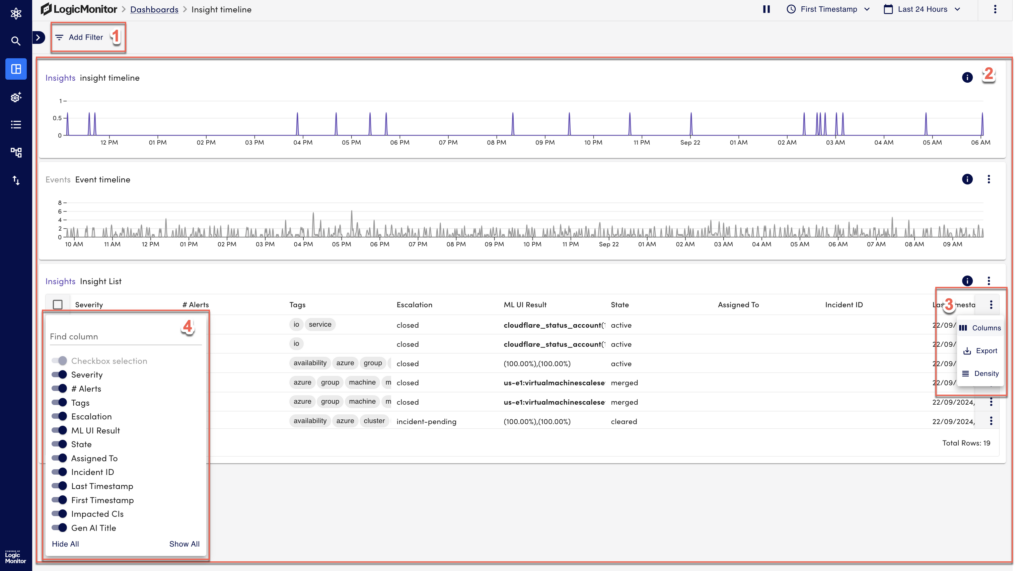
| 1 – Filtering data | You can filter the chart data such as CI, Tenant, Severity, Assigned to, Event, Alert, or Insights. | About Filters |
| 2 – Dashboard Charts | You can add different types of charts to build a dashboard. | Dashboard Charts |
| 3 – Column Filters and More Actions | You can add or remove column data as needed. To take action on any record, select | Edwin AI User Scenario |