Dashboard Charts
Last updated - 24 July, 2025
You can create the following types of charts for the different data source types:
- Grid Chart
- Ticket Chart
- Aggregation Chart
- Time Series Chart
Grid Chart
The grid chart displays source data in a table format, for example, a list of singleton (uncorrelated) alerts.
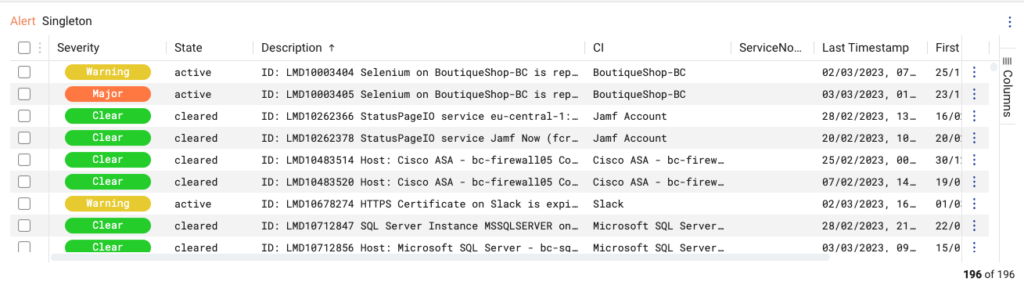
Configuration options for a grid chart include:
- Title: The name of the chart is displayed on the dashboard.
- Filter: Option to add filter expressions to limit the query. If no filter is added, all events, alerts, or insights are displayed. For more information, see Creating Filters.
Ticker Chart
The ticker chart shows aggregations as count values, for example, the total number of open insights or singleton alerts.
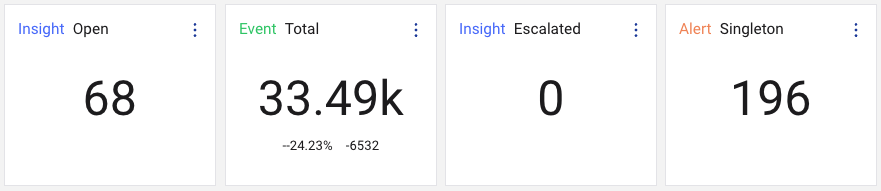
Configuration options for a ticker chart include:
- Title: The name of the chart as displayed on the dashboard.
- Field: The field on which to calculate the aggregation. Select id to count unique records. Fields available for selection vary depending on the record type selected. For more information, see Creating Filters.
- Aggregation: Operators include MIN, MAX, SUM, MEAN, and COUNT.
- Filter: Option to add filter expressions. For more information, see Creating Filters.
Aggregation Chart
The aggregation chart shows a group-based aggregation, for example, a count of insights grouped by their severities
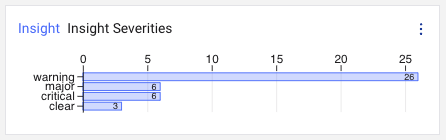
Configuration options for an aggregation chart include:
- Title: The name of the chart as displayed on the dashboard.
- Group: The group with which to calculate the aggregation, for example by resource or tenant ID. Fields available for selection vary depending on the record type selected. For more information, see Creating Filters.
- Field: The field on which to calculate the aggregation. Select id to count unique records. Fields available for selection vary depending on the record type selected. For more information, see Creating Filters.
- Aggregation: Operators include MIN, MAX, SUM, MEAN, and COUNT.
- Filter: Option to add filter expressions. For more information, see Creating Filters.
Time Series Chart
The time series chart shows an aggregation computed by time bucket. For example, the number of events received during a specific time range, in five-minute buckets. When displaying a time series chart on a dashboard, the time range is determined by the dashboard timespan. The time bucket granularity is automatically optimized and set based on the length of the dashboard timespan.
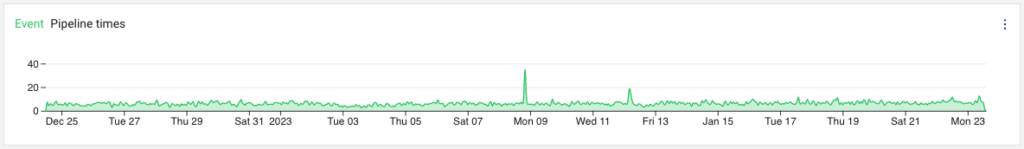
Configuration options for a time series chart include:
- Title: The name of the chart as displayed on the dashboard.
- Group: The group with which to calculate the aggregation. Fields available for selection vary depending on the record type selected. For more information, see Creating Filters. Note that Time Series charts only permits grouping (bucketing) by a time-based field.
- Field: The field on which to calculate the aggregation. Select id to count unique records. Fields available for selection vary depending on the record type selected. For more information, see Creating Filters.
- Aggregation: Operators include MIN, MAX, SUM, MEAN, and COUNT.
- Filter: Option to add filter expressions. For more information, see Creating Filters.
Note: Time Series charts only permits grouping (bucketing) by a time-based field.
