Mapping Page
Last updated - 09 January, 2026
FEATURE AVAILABILITY: LogicMonitor Pro and Enterprise
The Mapping page is the heart of LogicMonitor’s topology mapping capabilities. From this page, topology maps are created, managed, and added to dashboards as Topology Map widgets. Topology maps provide visual context for monitoring operations and have the following abilities:
- Visualize and navigate resources based on topology relationships
- Troubleshoot alerts within your infrastructure on a topology map
- Discover and map relationships between resources
- Save relevant and frequently-used topology maps for monitoring continuity
- Generate topology maps based on alerts to streamline your troubleshooting workflow
For more information, see Topology Mapping Overview.
Note: In addition to rendering topology maps on the Mapping page, you can render maps from the Resources page. These maps are more limited in scope, reflecting the relationships that the currently selected resource has with other elements in your network. For more information on the Maps tab, see Maps Tab.
Creating Topology Maps
1. In LogicMonitor, navigate to Mapping > Saved Maps > Add and select “New Map”.
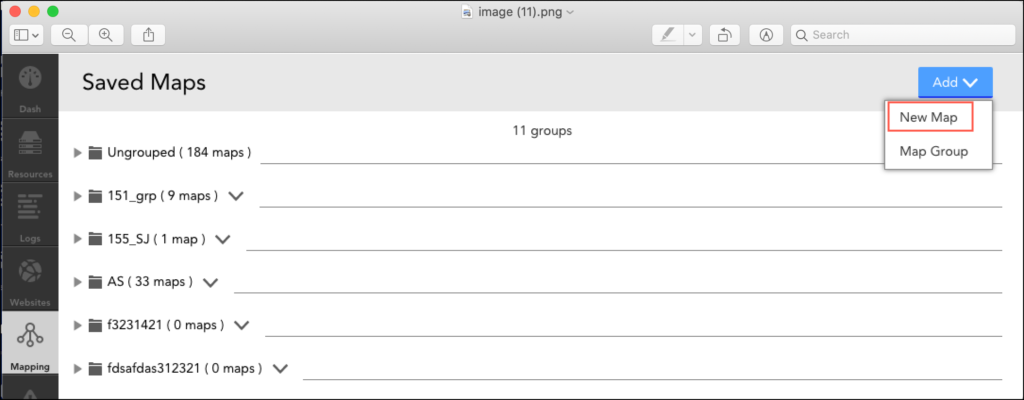
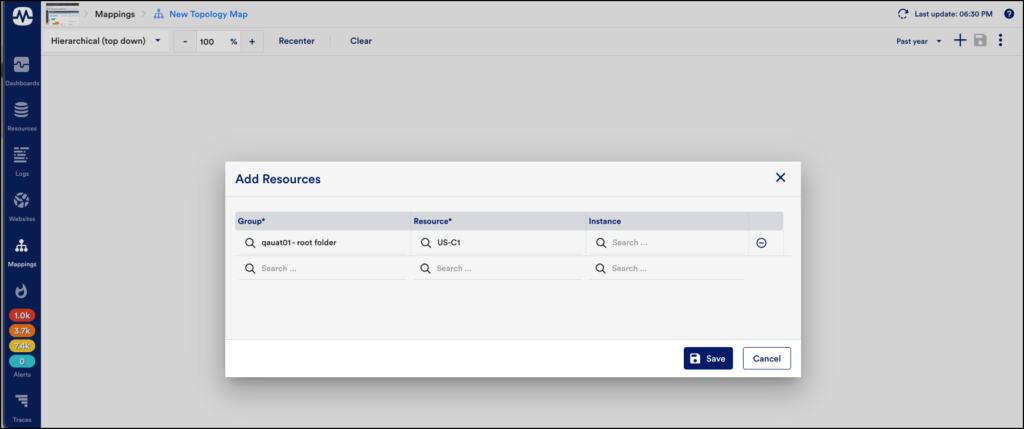
On the Mapping page, an Add Resources dialog box is displayed.
2. In the Add Resources dialog box, select the “Group” and the “Resource name” to add the required resource. You can also add multiple resources.
Note: You can only add the resources that are assigned with external resource IDs (ERIs). To verify if the resource has an ERI, check if the resource has the value for the host property predef.externalResourceID.
Note: If the resources are inaccurately displayed on your topology map, see the troubleshooting section of the Topology Mapping Overview.
3. (Optional) Enter the instance name to add instances.
4. Select Save.
5. Select on the newly-added resource. An Action drop-down menu is displayed.
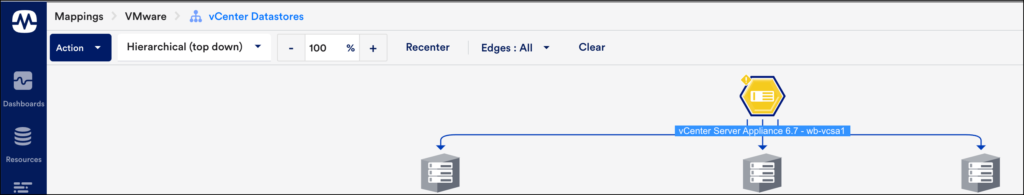
6. Select Connections to filter relationships between resources.
Each added relationship consists of a second vertex, connected to the first vertex by an connection.
7. From the Actions drop-down menu, select “Unpin” to remove the selected resources.
Note: You can expand any vertex whenever required. In addition, you can traverse relationships across your network environment indefinitely.
8. (Optional) From the Actions drop-down menu, select “Connections” to view the incoming or outgoing relationships between resources.
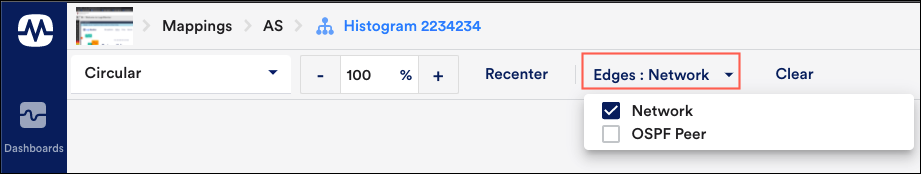
9. From the Layout field drop-down menu, select an organizing structure for the topology map’s layout from the following options:
- Hierarchical (top-down): This is the default layout. In this layout, vertices are organized in a top-down tree-like structure.
- Hierarchical (left to right): The horizontal layout is the hierarchical layout rotated ninety degrees counter-clockwise. Relationships flow left to right.
- Dynamic: This is a force-directed layout algorithm. Vertices repulse each other and connections act as “springs” to pull them together.
- Radial: The radial layout positions vertices in a circle that originates from a starting center vertex.
- Circular: The circular layout positions the groups related subsets of the nodes into circular patterns.
10. Select Recenter to set the map in the center.
11. Select – or + on the percentage zoom setting to zoom in gradual increments.
12. Select Clear to clear the canvas when viewing existing topology maps or building new ones. It does not permanently delete a saved map.
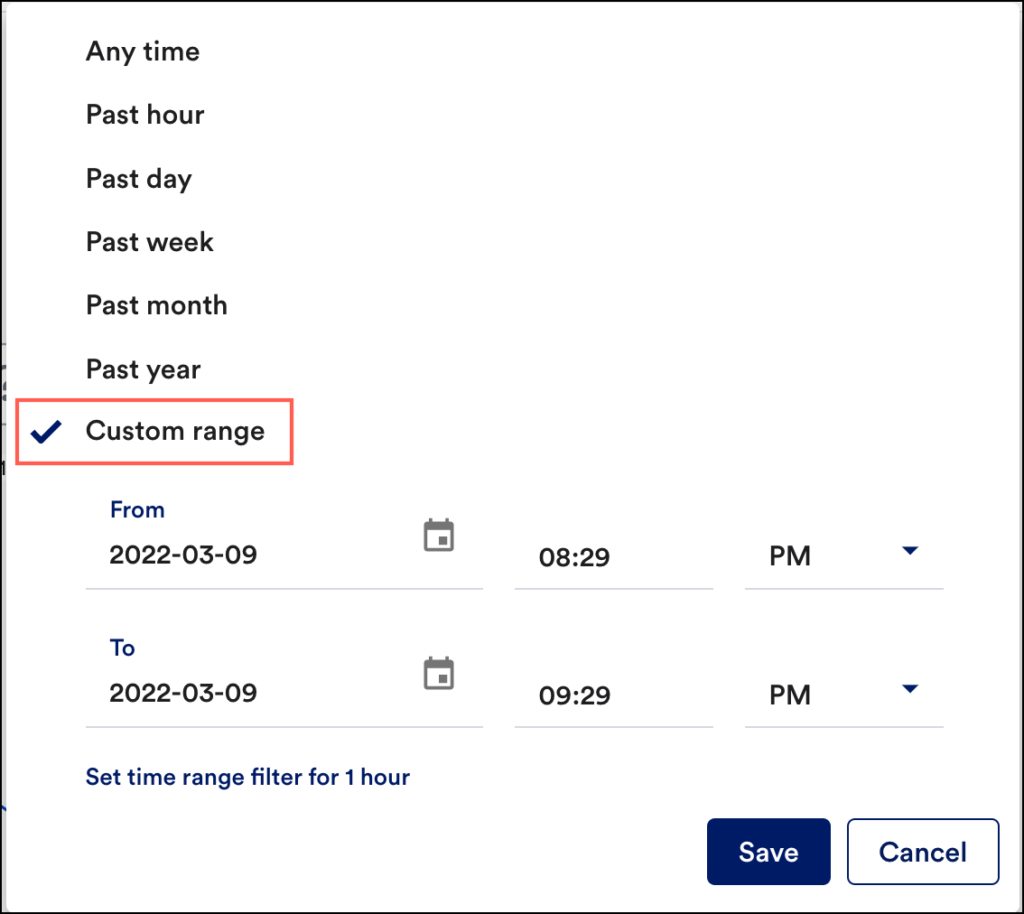
13. Select the Time Series drop-down, to select the time range for which you want to check the status of the monitored resources.
Note: The Time series filter is applied only to the alerts present on all nodes within the map.
14. (Optional) From the Time Series option, select Custom range to customize the time range. After entering the required time range, select Save.
15. Select Save.
There are several configurations that must be completed upon first save. For more information, see Saving Topology Maps.
Saving Topology Maps
To repeatedly access a topology map or add it to a dashboard as a widget, select the Save button at any point while creating the map to save the map.
Note: Upon first save, there are several configurations to complete. Once these configurations are established, LogicMonitor returns you to the map canvas so that you can continue creating the topology map.
1. Select the Save icon located in the upper-right corner of the Mapping page and select Settings.
A Topology Properties dialog box is displayed.
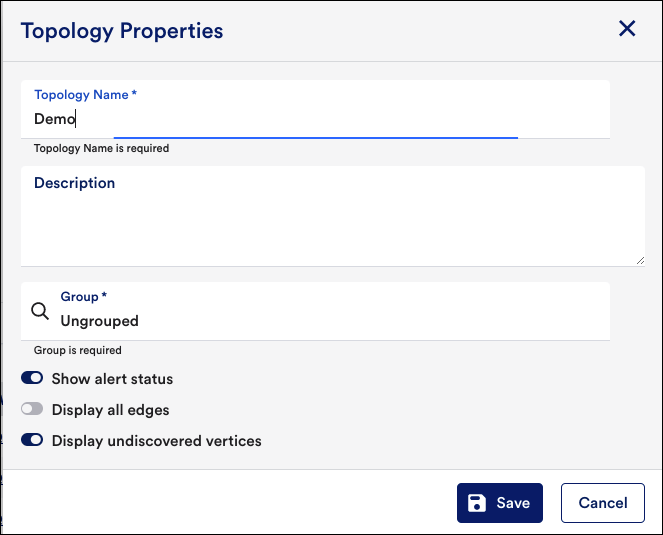
2. Enter the name and description in the Topology Name and the Description fields.
3. In the Group field, enter the name of the group in which your topology map will be organized.
Note: LogicMonitor only allows you to select a group previously created; if you do not select a group, your topology map will be assigned to the default “Ungrouped” group.
4. To display alert status, toggle the Show alert status switch.
5. To display all the connections in the map, toggle the Display all connections switch.
6. Select Save.
Once saved, a topology map can be cloned (available in the More options).
Adding Topology Maps to Dashboards
You can add the saved topology maps to dashboards as Topology Map widgets. You can navigate to click the Add to dashboard ( ) icon from More Options
on the top-right corner of the Mapping page. For more information on Topology Map widgets, see Topology Map Widget.
Open Relevant Alerts and Resources from Topology Maps
Topology maps offer convenient methods of portal navigation, enabling you to gather additional context.
Open Relevant Alerts
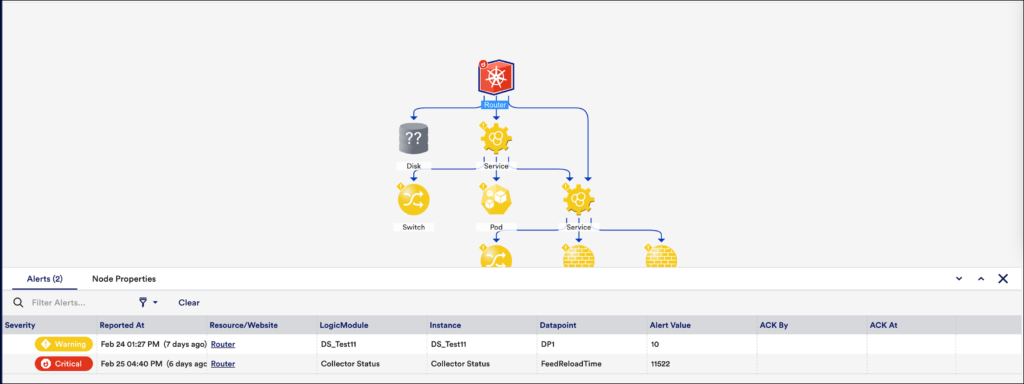
By default, topology maps identify the alert status of all mapped resources. This is key to troubleshooting alerts and identifying when a series of events are related to the same root cause.
If an alert icon is associated with a resource in your topology map, you can click the alert icon to open a complete list of active alerts for that resource.
Note: Not only can you generate a list of relevant alerts from a topology map, but you can also generate a relevant topology map from an individual alert on the Alerts page. For more information, see Managing Alerts from the Alerts Page.
Open Resources
Double-click any vertex on a topology map to navigate directly to the resource it represents. The Resources page opens in a new browser tab with the resource in focus on the Maps tab.
Displaying Header Graph
Requirements
To display the Header Graph, you must enable the Header Graph option on the Alerts page.
For assistance, contact LogicMonitor Support.
- Select
 More Options and then select Header Graph.
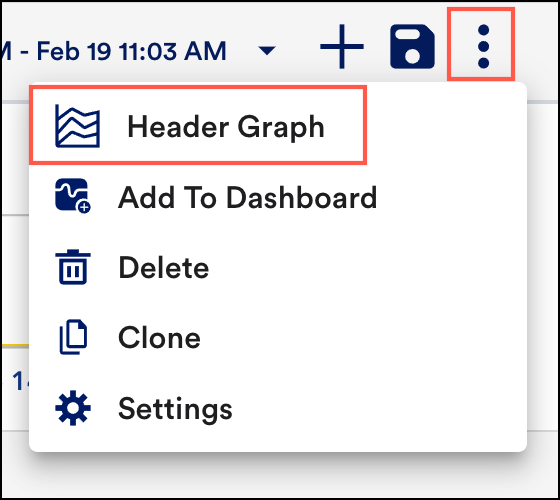
The graph retains your prior groupings (dimensions) while reflecting the alerts currently listed in the Alert table. - Select Header Graph to view visual grouping alerts.
- The alerts in the alert table can also be viewed as a time-series graph.
Note: Header graph filters are not retained after the map is saved or when node grouping is applied to a saved map.
- You can do the following with the graph:
- Zoom in on a time range by selecting and dragging across the desired timeframe.
- Select a grouping in the legend or in the graph to include or exclude that group of alerts.
As you interactively change the graph’s filters, the Alert table automatically updates to remain in sync.
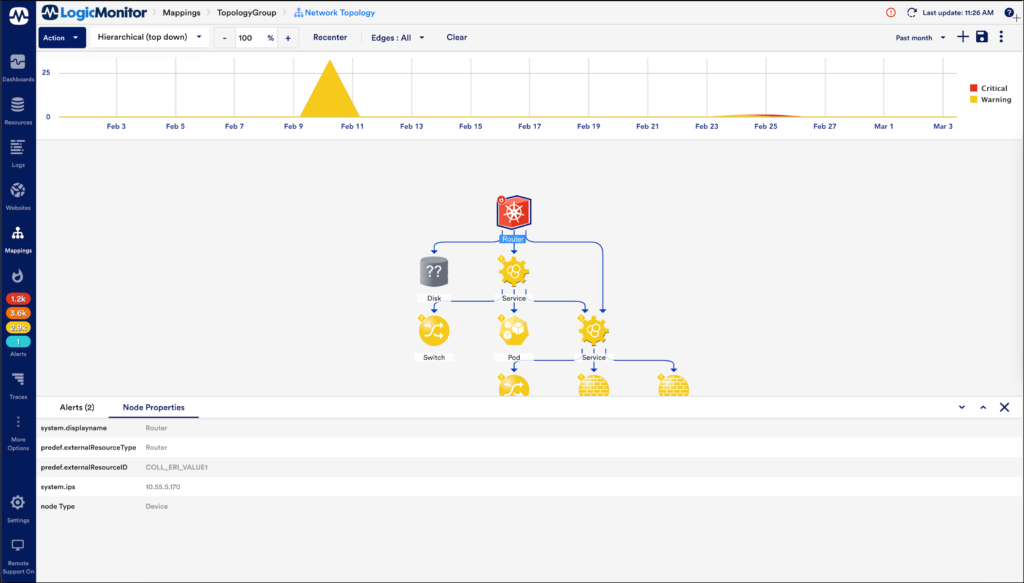
Topology Node Properties
The Node Properties panel provides details regarding the resources in the topology map. When you click on the nodes in the topology map, a panel containing details about the alerts and node properties is displayed.
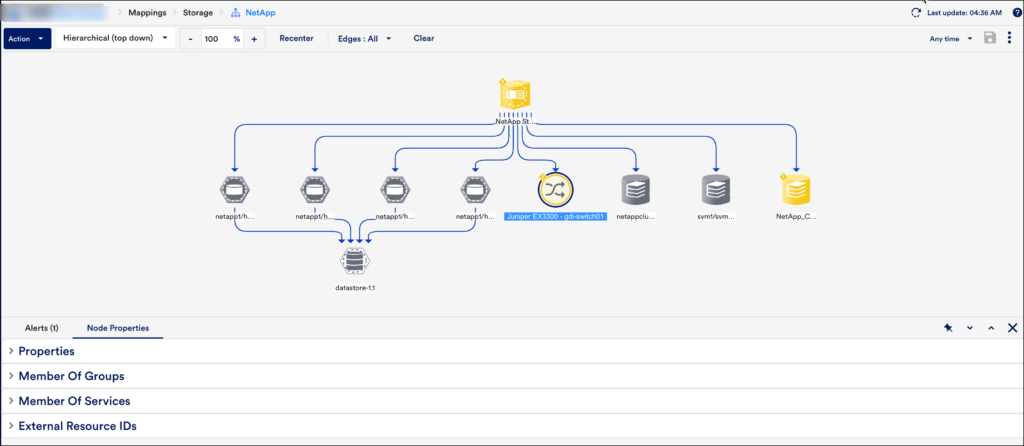
The following information is displayed in the Node Properties section:
- Properties: Properties are used to store device credentials, system information, collector details, and custom property information that can be accessed in device communication, reports, and alert messages.
- Member of Groups: Devices can be members of multiple groups. Displays the list of the groups in which the device is added.
- Member of Services: Displays the list of services that are added to the device.
- External Resource IDs (ERIs): ERIs are properties set on devices, instances, and services (collectively referred to as resources on the LogicMonitor platform) that allow resources to be recognized for inclusion in topology maps.
Note: You can also view the node properties information in the Info tab on the Resources page.
In addition, you can view maps and node properties details on different pages in LogicMonitor. For example, on the Alerts Page and Resource page. For more information, see Explore Maps.
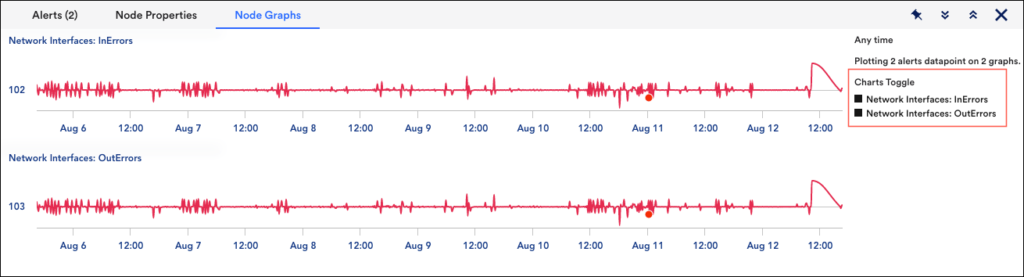
Node Graphs
You can view the alert graphs for the alerted resources in the Node Graphs tab and based on the alerts you can troubleshoot and resolve the issues.
Note: The various graphs displayed are defined in the DataSource definition. For more information, see DataSource Graphs.
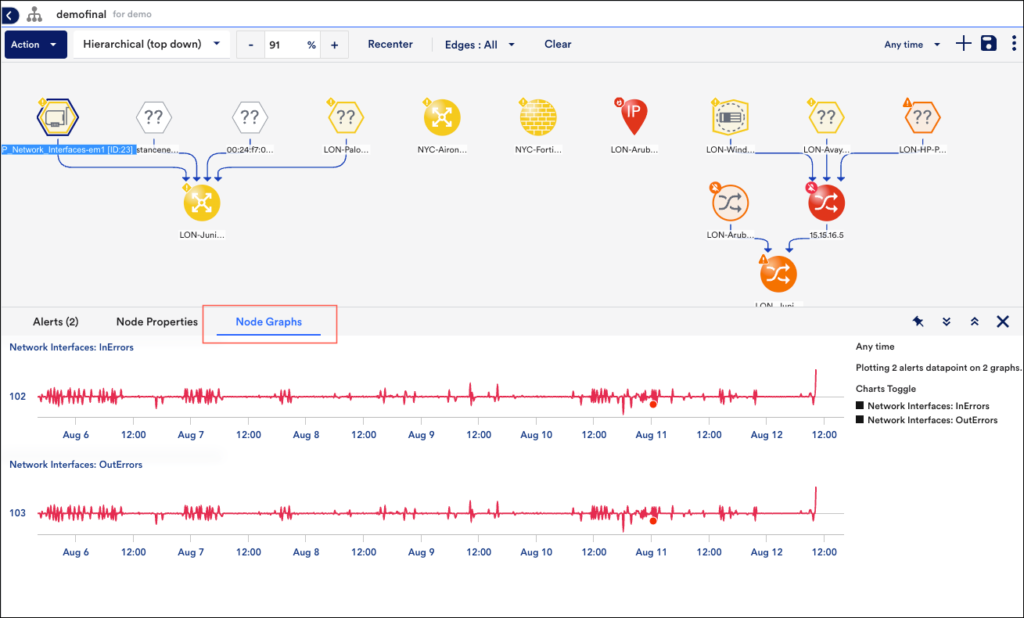
In addition, you can filter the graphs from the Chart Toggle section.
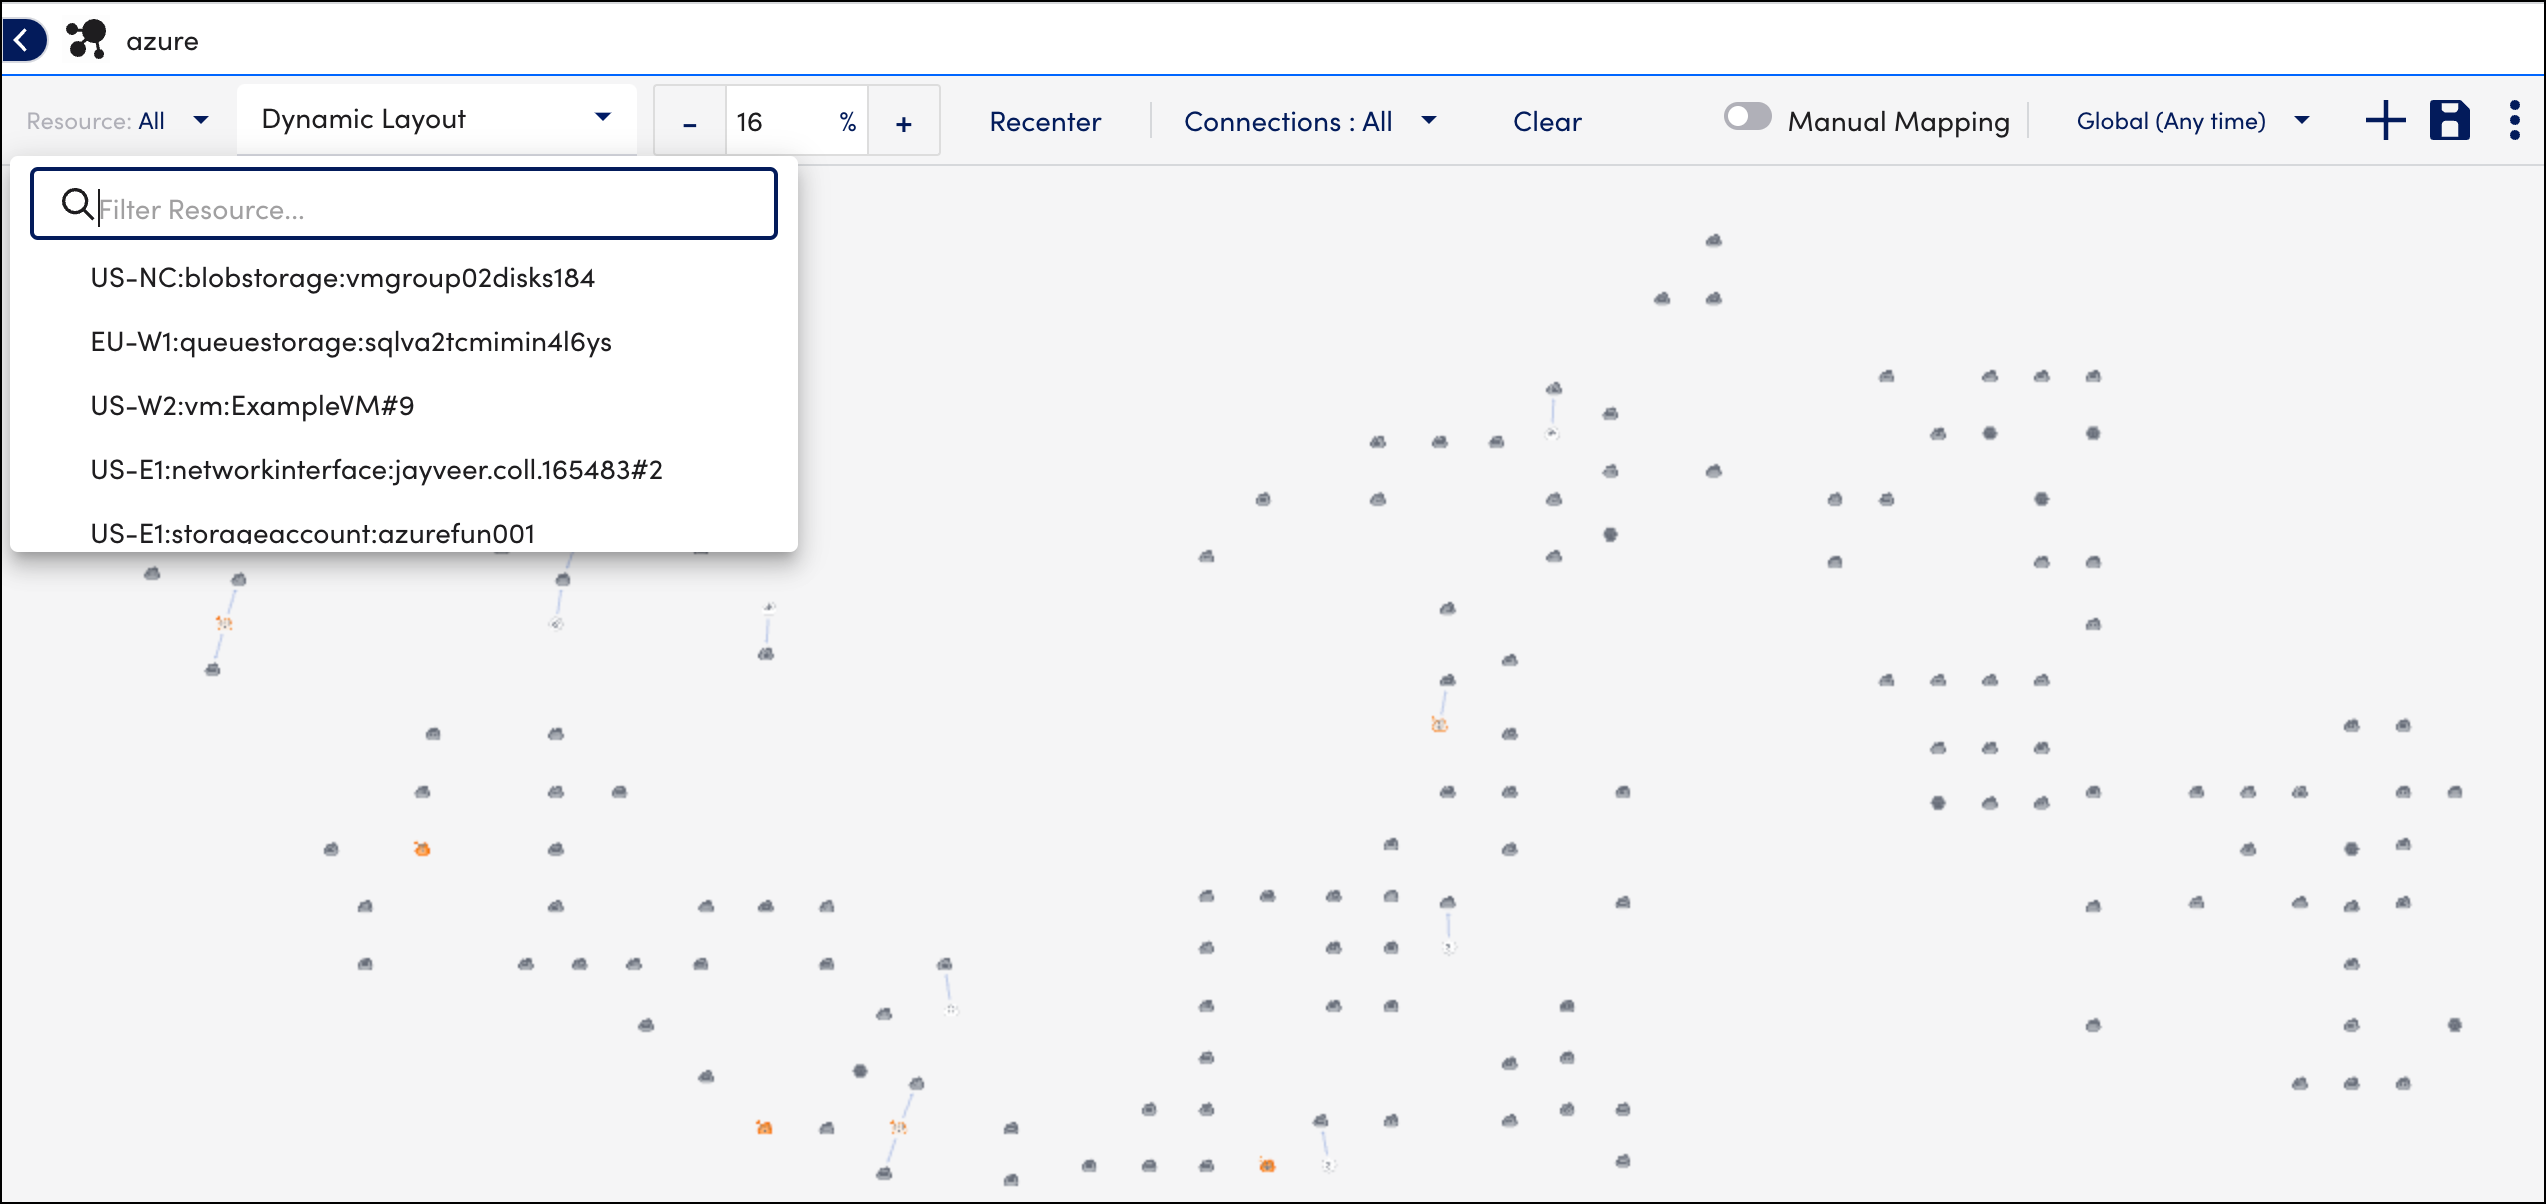
Searching for Nodes
You can easily search for nodes with the label names in the maps. This is very useful in case of large maps.
- In LogicMonitor, navigate to Mappings.
- On the Mappings page, select the Resources All drop-down option and select the required node.
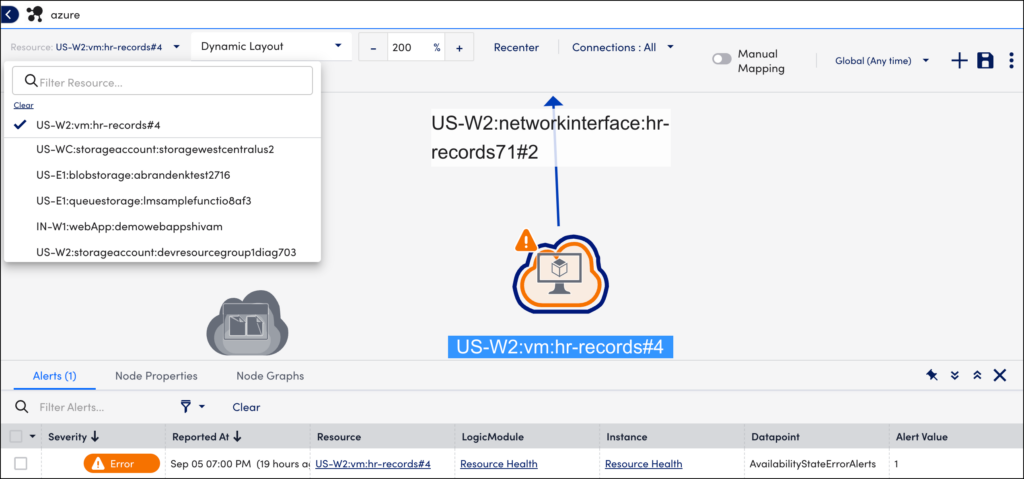
Note: You can only select one node at a time.
Once you select the node, the node is highlighted and the Node Properties section is displayed. You can view the details of the selected node.
Appendix
Display Tools
As you build your topology map, the following features are available for customized viewing and display:
- Hover for additional details: You can hover over a vertex to display the vertex name at the forefront (helpful on crowded maps with overlapping display names). Similarly, you can hover over a connection to display the connection type (For example, the name of the connection type).
- Drag vertices or entire map: You can drag and drop any vertex to a new location on your topology map. The entire topology map can be repositioned on the canvas by grabbing and dragging any point of white space.
Note: You can drag vertices only when the map is in the Dynamic layout.
- Right-click connections: When multiple connections connect two vertices, the default behavior is to collapse those connections into a single connection for cleaner viewing. However, you can right-click on a collapsed connection to show all connections between two vertices. (There is also the option to override this default behavior from a map’s settings using the Display All Connections option.)
When you create a topology map, it reflects up-to-date relationship information. Refreshes occur with each Collection interval, as specified in the TopologySource. If a Collector contributing to the topology map goes offline, the relationships are cached until the Collector comes back online. The relationships are updated if any changes occurred while the Collector was offline.
For more information, see Topology Mapping Overview.
Icons in the Topology Map
Each vertex on your topology map is designated with an icon. This icon denotes its type, which is determined by the external resource type (ERT) assigned to the resource. Vertex icons are organized by resource type categories. For more information, see External Resource Types.
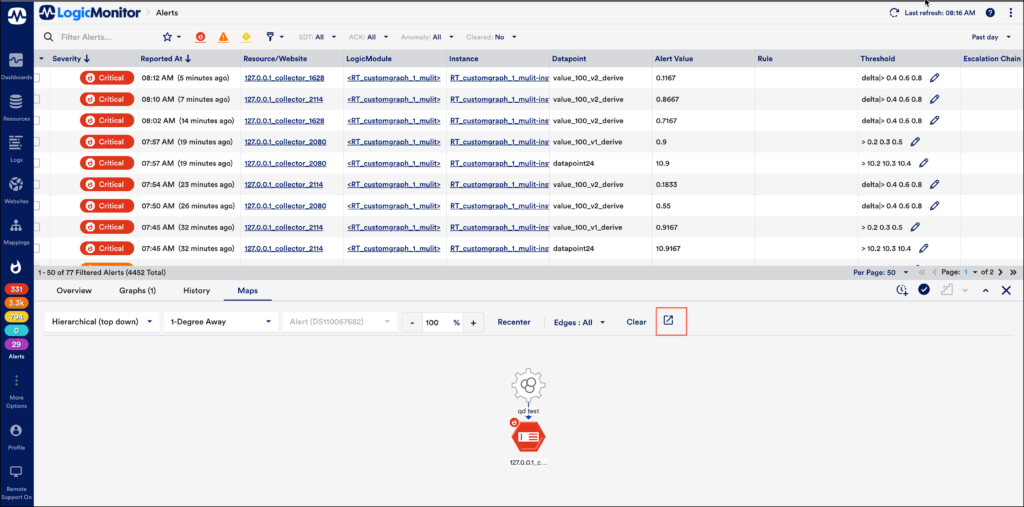
Explore Maps
You can view maps on different pages in LogicMonitor. For example, on the Alerts Page and Resource page.
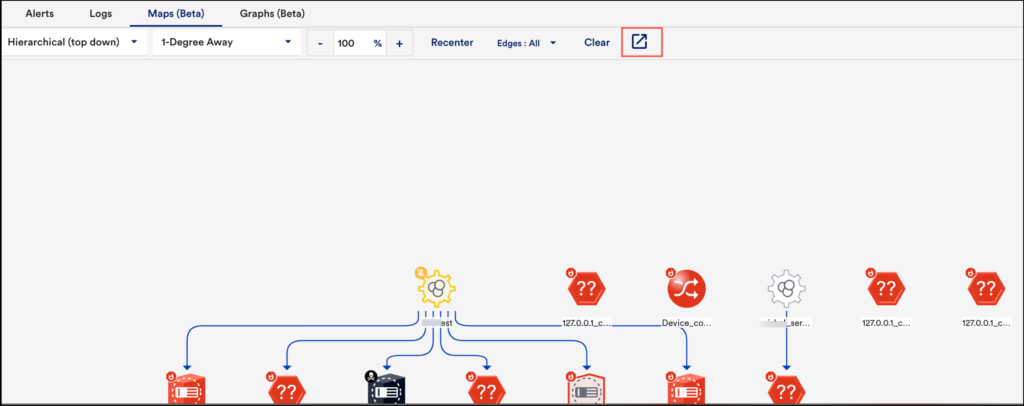
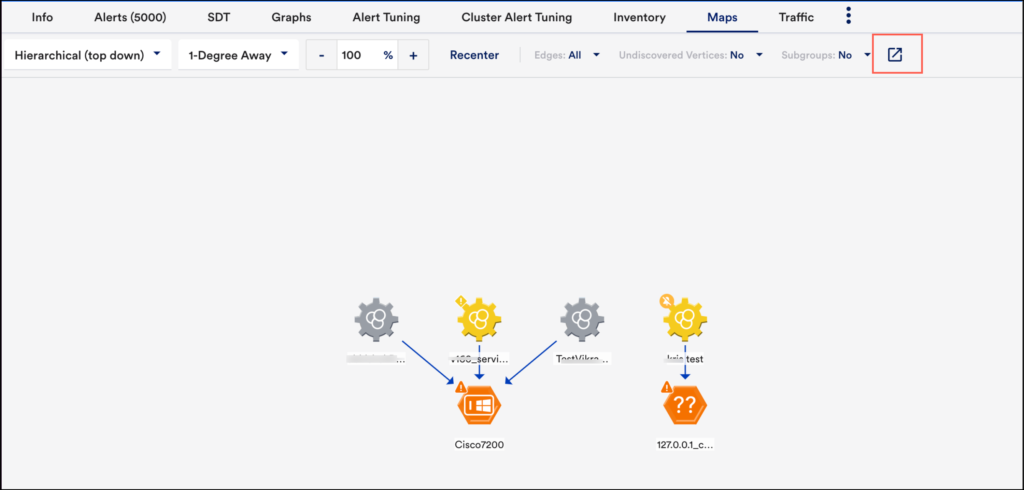
The Maps tab displays all incoming and outgoing relationships with one degree of separation from the selected resource.
Note: If you want to add or edit the map, click the Explore Maps icon. You are navigated to the Mapping page, where you can filter connections, edit the map, and add devices.
Alert Page
On the Alert page, click the required alert, a table is displayed with the alert details. You can click Maps, to view the topology map.
Resource Page
On the Resource Page, you can click the required Device group or a Device. Click Maps, to view the topology map.
Resource group information page
Resource information page