Viewing Graphs from a Mobile Device
Last updated – 23 July, 2025
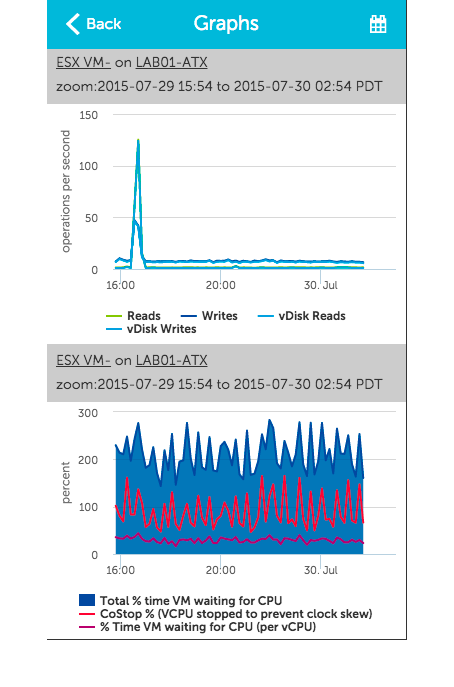
From the Alert Detail page for a particular alert, click ‘See Graphs’ to see the graphs for the datasource instance that triggered the alert as they would appear in your account
You may need to scroll down to see all of the graphs. The graph headers display the instance name and datasource name in the following format: datasource on instance. The zoom field indicates the current time range specified for the graph data.
Adjusting the graph time range
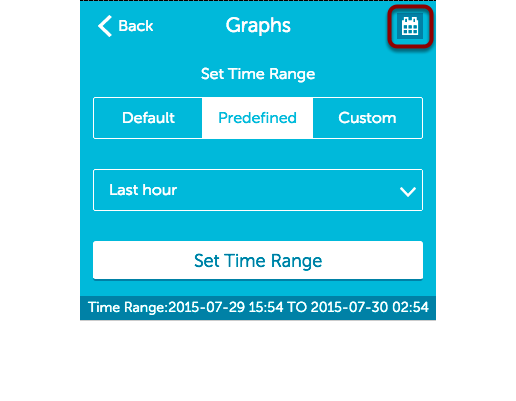
To adjust the time range for the displayed graphs, select the calendar icon in the upper right hand corner and select the default time range (typically last 24 hours), choose a predefined time range, or specify a custom time range: