
Monitoring Azure Databricks
Last updated on 26 April, 2023To monitor Azure Databricks with LogicMonitor: Build a monitoring library, create an Azure Log Analytics workspace, update an init script, and configure the Databricks cluster.
Requirements
- Install or update the LogicModules for Azure Databricks.
- A Databricks cluster. If you need to create one, see Create a cluster.
- Version (Databricks Runtime Version) of the cluster.
- An active Azure Databricks workspace. For more information, see Create an Azure Databricks workspace.
- Databricks CLI. For more information, see Databricks CLI.
- A Java IDE.
Building the Monitoring Library
To build the library, the Databricks Runtime Version for the Databricks cluster is needed. To view, go to the Databricks console and navigate to Compute > Select Cluster > Databricks Runtime Version. For more information, see Create a cluster.
- Clone the following GitHub repository: https://github.com/mspnp/spark-monitoring.git
Note: This library can be used for Databricks versions prior to 11.0. Monitoring for versions 11.0 and higher is not supported at this time.
- Select the Maven profile that corresponds with your Databricks runtime version.
- Runtime 5.5 (Scala 2.11, Spark 2.4.3)
- Runtime 6.4 (Scala 2.11, Spark 2.4.5)
- Runtime 7.3 – 7.6 (Scala 2.12, Spark 3.0.1)
- Runtime 8.0 – 8.3 (Scala 2.12, Spark 3.1.1)
- Runtime 8.4 – 9.1 (Scala 2.12, Spark 3.1.2)
- Execute the Maven package to extract two JAR files:
spark-listeners_<Spark Version>_<Scala Version>-<Version>.jarspark-listeners-loganalytics_<Spark Version>_<Scala Version>-<Version>.jar
Creating an Azure Log Analytics Workspace
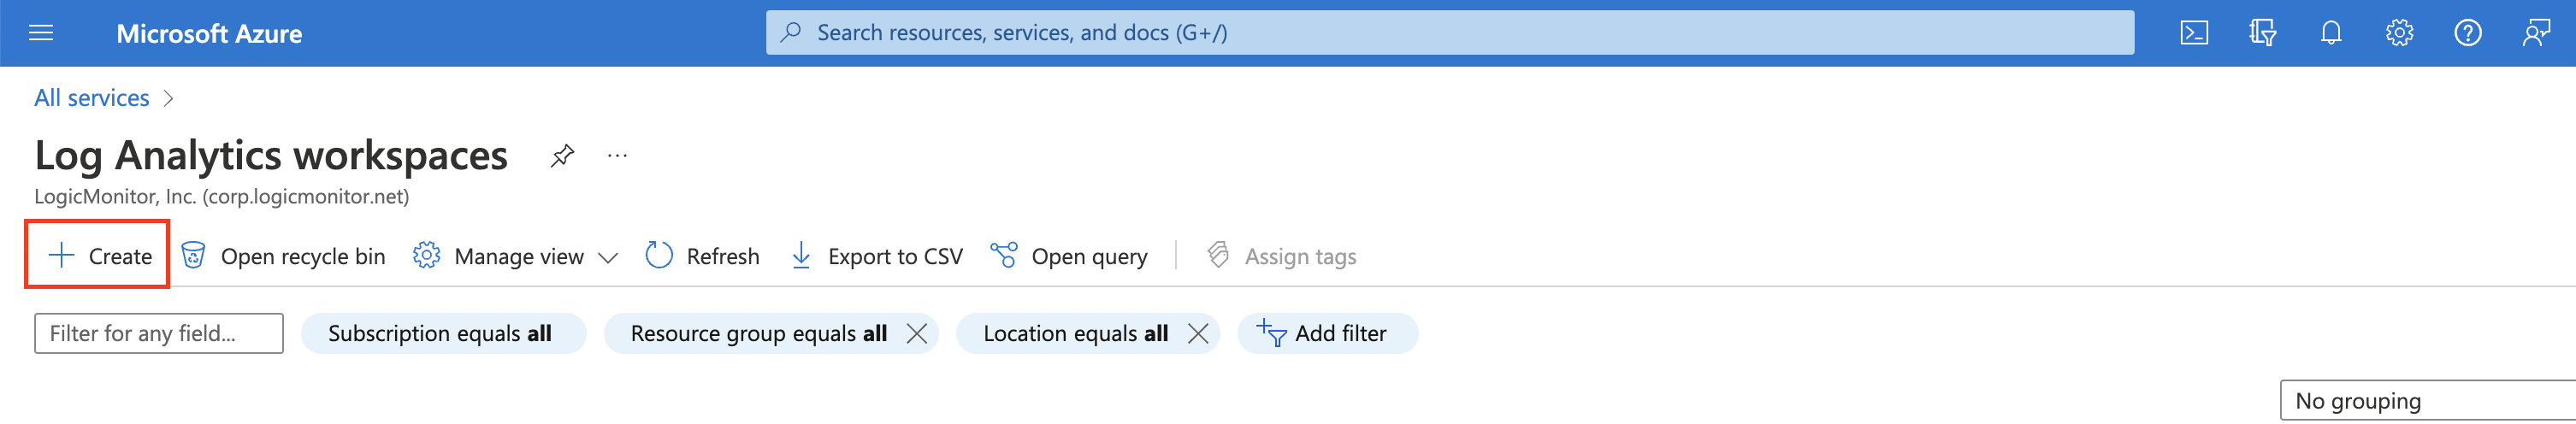
- In Microsoft Azure, go to Azure Services > Log Analytics workspaces and click Create. For more information, see Create a Log Analytics workspace.
- Select the new workspace that you created and click Agents management.
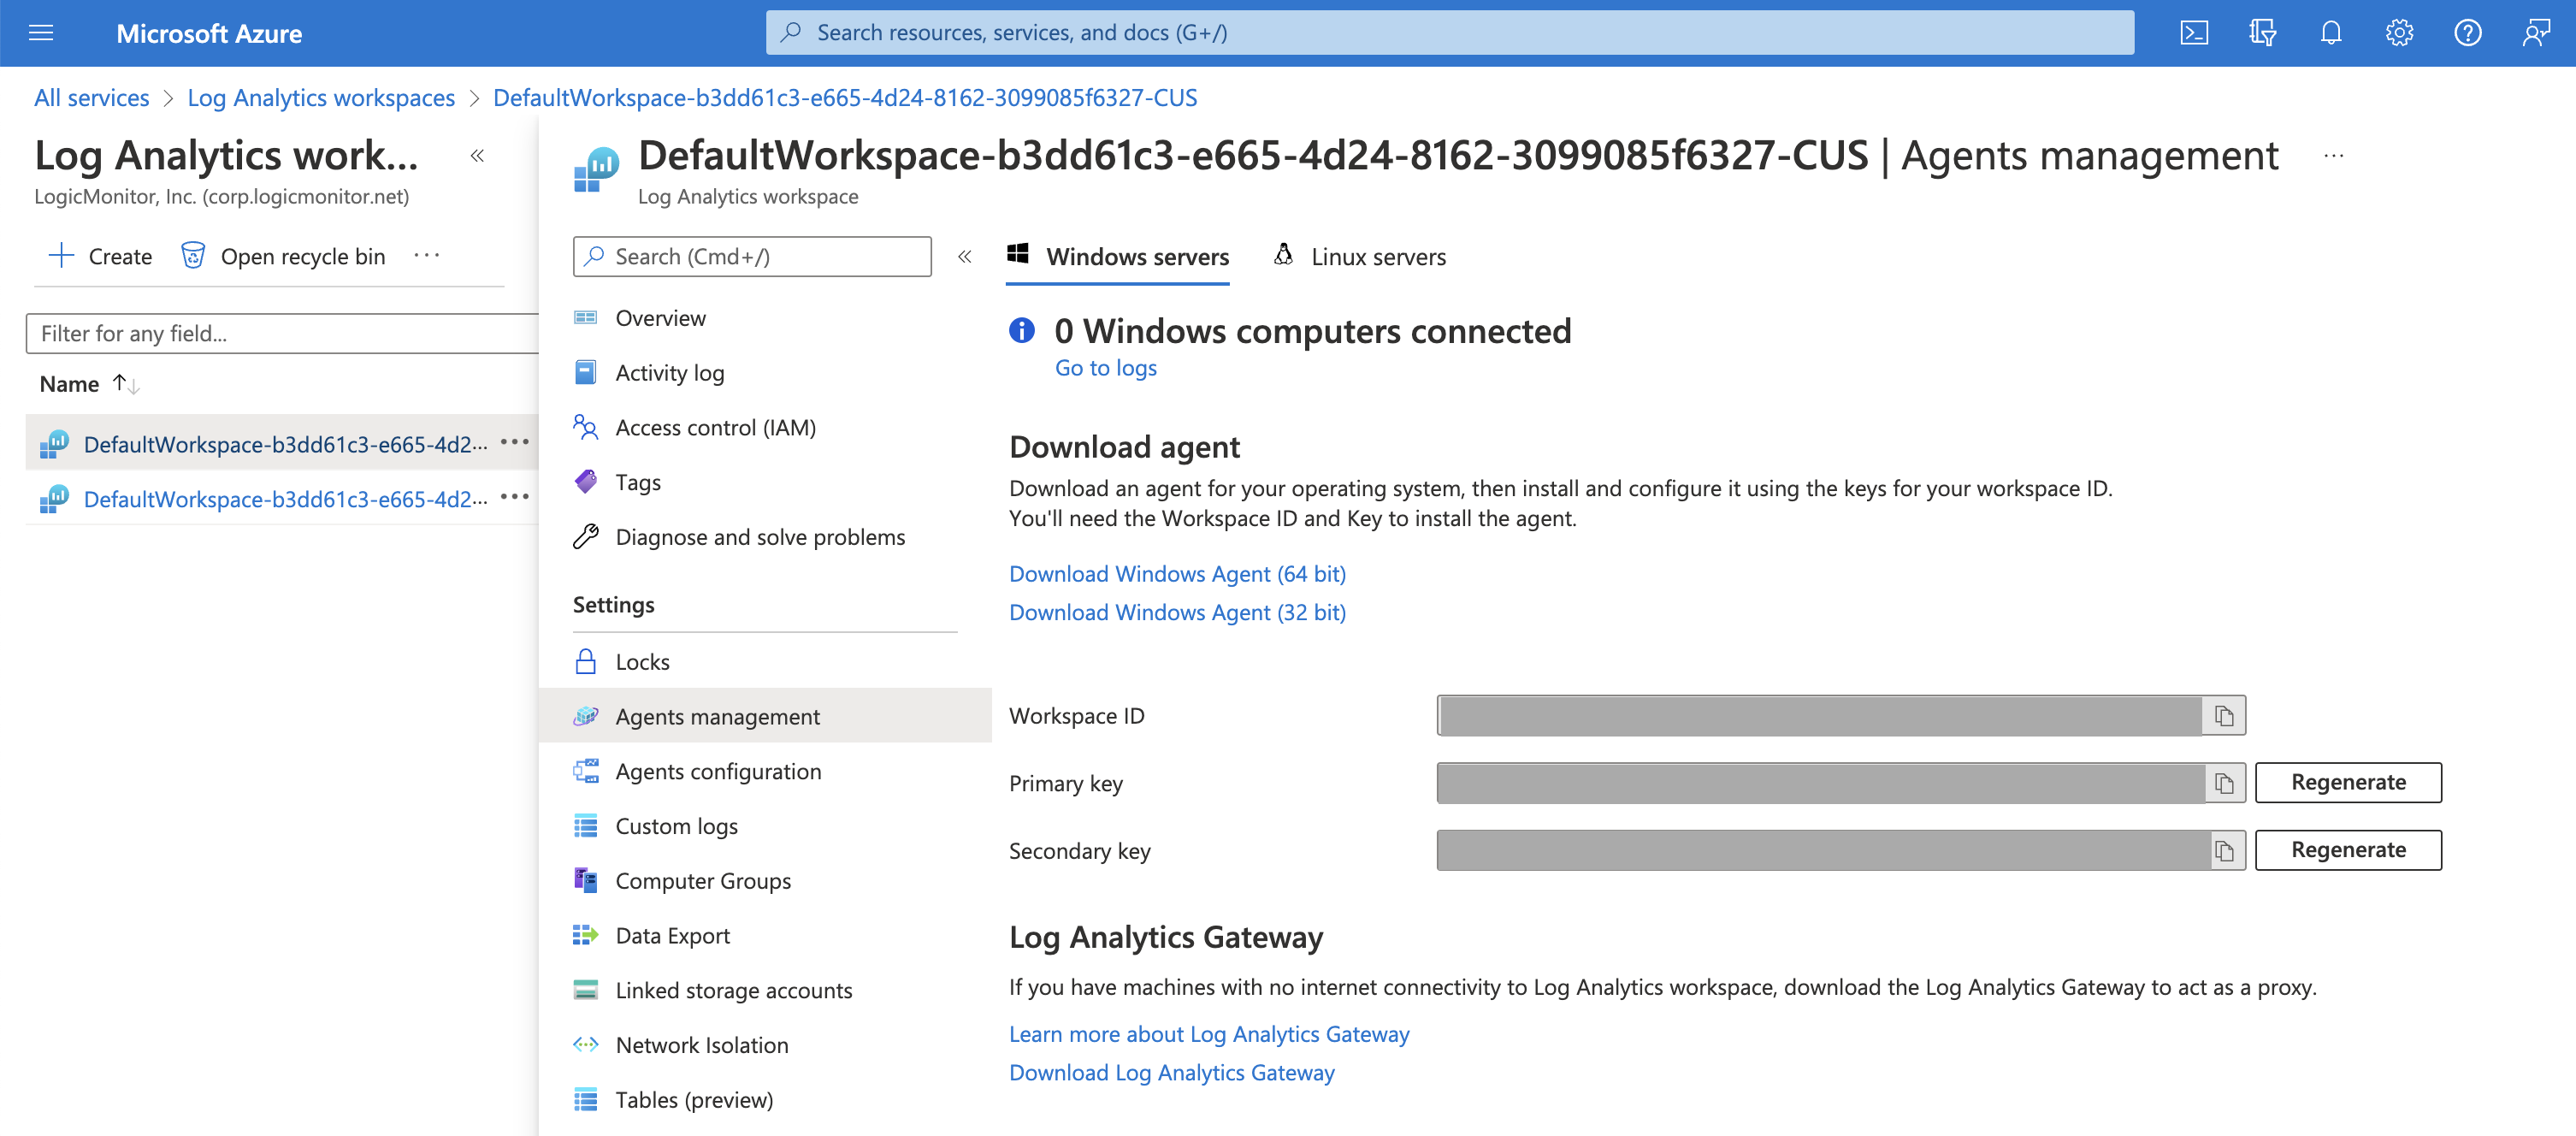
Note: The Workspace ID and Primary key are displayed. You will need this information to update the init script.
Updating the Init Script
Using the Workspace ID and Primary Key from your Azure Log Analytics Workspace, update the script:
[path to spark-monitoring]/src/spark-listeners/scripts/spark-monitoring.shLOG_ANALYTICS_WORKSPACE_IDLOG_ANALYTICS_WORKSPACE_KEY
#!/bin/bash

set -e
set -o pipefail

# These environment variables would normally be set by Spark scripts
# However, for a Databricks init script, they have not been set yet.
# We will keep the names the same here, but not export them.
# These must be changed if the associated Spark environment variables
# are changed.
DB_HOME=/databricks
SPARK_HOME=$DB_HOME/spark
SPARK_CONF_DIR=$SPARK_HOME/conf

# Add your Log Analytics Workspace information below so all clusters use the same
# Log Analytics Workspace
# Also if it is available use AZ_* variables to include x-ms-AzureResourceId
# header as part of the request
tee -a "$SPARK_CONF_DIR/spark-env.sh" << EOF
export DB_CLUSTER_ID=$DB_CLUSTER_ID
export DB_CLUSTER_NAME=$DB_CLUSTER_NAME
export LOG_ANALYTICS_WORKSPACE_ID=
export LOG_ANALYTICS_WORKSPACE_KEY=
export AZ_SUBSCRIPTION_ID=
export AZ_RSRC_GRP_NAME=
export AZ_RSRC_PROV_NAMESPACE=
export AZ_RSRC_TYPE=
export AZ_RSRC_NAME=

# Note: All REGEX filters below are implemented with java.lang.String.matches(...).  This implementation essentially appends ^...$ around
# the regular expression, so the entire string must match the regex.  If you need to allow for other values you should include .* before and/or
# after your expression.

# Add a quoted regex value to filter the events for SparkListenerEvent_CL, the log will only include events where Event_s matches the regex.
# Commented example below will only log events for SparkListenerJobStart, SparkListenerJobEnd, or where "org.apache.spark.sql.execution.ui."
# is is the start of the event name.
# export LA_SPARKLISTENEREVENT_REGEX="SparkListenerJobStart|SparkListenerJobEnd|org\.apache\.spark\.sql\.execution\.ui\..*"

# Add a quoted regex value to filter the events for SparkMetric_CL, the log will only include events where name_s matches the regex.
# Commented example below will only log metrics where the name begins with app and ends in .jvmCpuTime or .heap.max.
# export LA_SPARKMETRIC_REGEX="app.*\.jvmCpuTime|app.*\.heap.max"

# Add a quoted regex value to filter the events for SparkLoggingEvent_CL, the log will only include events where logger_name_s matches the name regex
# or where the Message matches the message regex.  If both are specified, then both must be matched for the log to be sent.
# Commented examples below will only log messages where the logger name is com.microsoft.pnp.samplejob.StreamingQueryListenerSampleJob or begins with
# org.apache.spark.util.Utils, or where the Message ends with the string 'StreamingQueryListenerSampleJob' or begins with the string 'FS_CONF_COMPAT'.
# export LA_SPARKLOGGINGEVENT_NAME_REGEX="com\.microsoft\.pnp\.samplejob\.StreamingQueryListenerSampleJob|org\.apache\.spark\.util\.Utils.*"
# export LA_SPARKLOGGINGEVENT_MESSAGE_REGEX=".*StreamingQueryListenerSampleJob|FS_CONF_COMPAT.*"

# Uncomment the following line to enable local logging to stderr of buffer contents when an exception is hit when sending a buffer to Log Analytics
# export LA_LOGFAILEDBUFFERSEND=TRUE
EOF

STAGE_DIR=/dbfs/databricks/spark-monitoring
SPARK_LISTENERS_VERSION=${SPARK_LISTENERS_VERSION:-1.0.0}
SPARK_LISTENERS_LOG_ANALYTICS_VERSION=${SPARK_LISTENERS_LOG_ANALYTICS_VERSION:-1.0.0}
SPARK_VERSION=$(cat /databricks/spark/VERSION 2> /dev/null || echo "")
SPARK_VERSION=${SPARK_VERSION:-3.2.1}
SPARK_SCALA_VERSION=$(ls /databricks/spark/assembly/target | cut -d '-' -f2 2> /dev/null || echo "")
SPARK_SCALA_VERSION=${SPARK_SCALA_VERSION:-2.12}

# This variable configures the spark-monitoring library metrics sink.
# Any valid Spark metric.properties entry can be added here as well.
# It will get merged with the metrics.properties on the cluster.
METRICS_PROPERTIES=$(cat << EOF
# This will enable the sink for all of the instances.
*.sink.loganalytics.class=org.apache.spark.metrics.sink.loganalytics.LogAnalyticsMetricsSink
*.sink.loganalytics.period=5
*.sink.loganalytics.unit=seconds

# Enable application status metrics
spark.metrics.appStatusSource.enabled=true

# Enable JvmSource for instance master, worker, driver and executor
master.source.jvm.class=org.apache.spark.metrics.source.JvmSource

worker.source.jvm.class=org.apache.spark.metrics.source.JvmSource

driver.source.jvm.class=org.apache.spark.metrics.source.JvmSource

executor.source.jvm.class=org.apache.spark.metrics.source.JvmSource

EOF
)

echo "Copying Spark Monitoring jars"
JAR_FILENAME="spark-listeners_${SPARK_VERSION}_${SPARK_SCALA_VERSION}-${SPARK_LISTENERS_VERSION}.jar"
echo "Copying $JAR_FILENAME"
cp -f "$STAGE_DIR/$JAR_FILENAME" /mnt/driver-daemon/jars
JAR_FILENAME="spark-listeners-loganalytics_${SPARK_VERSION}_${SPARK_SCALA_VERSION}-${SPARK_LISTENERS_LOG_ANALYTICS_VERSION}.jar"
echo "Copying $JAR_FILENAME"
cp -f "$STAGE_DIR/$JAR_FILENAME" /mnt/driver-daemon/jars
echo "Copied Spark Monitoring jars successfully"

echo "Merging metrics.properties"
echo "$(echo "$METRICS_PROPERTIES"; cat "$SPARK_CONF_DIR/metrics.properties")" > "$SPARK_CONF_DIR/metrics.properties" || { echo "Error writing metrics.properties"; exit 1; }
echo "Merged metrics.properties successfully"

# This will enable master/worker metrics
cat << EOF >> "$SPARK_CONF_DIR/spark-defaults.conf"
spark.metrics.conf ${SPARK_CONF_DIR}/metrics.properties
EOF

log4jDirectories=( "executor" "driver" "master-worker" )
for log4jDirectory in "${log4jDirectories[@]}"
do

LOG4J_CONFIG_FILE="$SPARK_HOME/dbconf/log4j/$log4jDirectory/log4j.properties"
echo "BEGIN: Updating $LOG4J_CONFIG_FILE with Log Analytics appender"
sed -i 's/log4j.rootCategory=.*/&, logAnalyticsAppender/g' ${LOG4J_CONFIG_FILE}
tee -a ${LOG4J_CONFIG_FILE} << EOF
# logAnalytics
log4j.appender.logAnalyticsAppender=com.microsoft.pnp.logging.loganalytics.LogAnalyticsAppender
log4j.appender.logAnalyticsAppender.filter.spark=com.microsoft.pnp.logging.SparkPropertyEnricher
# Commented line below shows how to set the threshhold for logging to only capture events that are
# level ERROR or more severe.
# log4j.appender.logAnalyticsAppender.Threshold=ERROR
EOF

echo "END: Updating $LOG4J_CONFIG_FILE with Log Analytics appender"

done

# The spark.extraListeners property has an entry from Databricks by default.
# We have to readd it here because we did not find a way to get this setting when the init script is running.
# If Databricks changes the default value of this property, it needs to be changed here.
cat << EOF > "$DB_HOME/driver/conf/00-custom-spark-driver-defaults.conf"
[driver] {
    "spark.extraListeners" = "com.databricks.backend.daemon.driver.DBCEventLoggingListener,org.apache.spark.listeners.UnifiedSparkListener"
    "spark.unifiedListener.sink" = "org.apache.spark.listeners.sink.loganalytics.LogAnalyticsListenerSink"
}
EOFConfiguring the Databricks Cluster
- Using the Databricks CLI, create a directory using the following command:
dbfs mkdirs dbfs:/databricks/spark-monitoring - Add the two JAR files:
cd [path to spark-monitoring]dbfs cp --overwrite src/spark-listeners/scripts/spark-monitoring.shdbfs:/databricks/spark-monitoring/spark-monitoring.shdbfs cp --overwrite --recursive src/target/ dbfs:/databricks/spark-monitoring/ - In Microsoft Azure, go to Azure Services > Azure Databricks and select the Azure Databricks workspace. If you need to create one, see Create an Azure Databricks workspace.
- On the Azure Databricks Service page, click Launch Service. The Databricks console opens in a new window.
- From the Databricks console, click Compute.
- Select the cluster that you want to configure and then click Edit.
- Go to Advanced Options > Init Scripts.
- Provide the Destination and Init Script Path for the init script that you updated and then click Add.
LogicModules for Azure Databricks
Install or update the following LogicModules. For more information, see Installing and Updating Modules.
| Module | Type | Description |
| Microsoft_Azure_Databrick_App | DataSource | Displays metrics at a cluster application level. This includes the metrics of the application driver node for a particular cluster application. |
| Microsoft_Azure_Databrick_AppExecutor | DataSource | Displays metrics at a cluster application executor level. This includes the metrics of the application executor nodes for a particular cluster application. |
| Microsoft_Azure_Databrick_Cluster | DataSource | Displays metrics at a cluster level. This includes the metrics of the cluster node itself, plus any workers, executors, and drivers that are related to the cluster. |
| Microsoft_Azure_DatabrickAppStatus | DataSource | Discover a resource such as: clusterName applicationName |