
Uptime Resource Overview Report
Last updated - 05 December, 2025
The Uptime Resource Overview report displays the percent time available, time not available, and alert information per checkpoint across one or more external Web Checks and Ping Checks. This report returns a table with the option to include a graph for each checkpoint, enabling you to review and compare availability metrics across LM Uptime resources.
Configuring an Uptime Resource Overview Report
- In LogicMonitor, navigate to Reports.
- Select
 Add Report, select Add for the Uptime Resource Overview report.
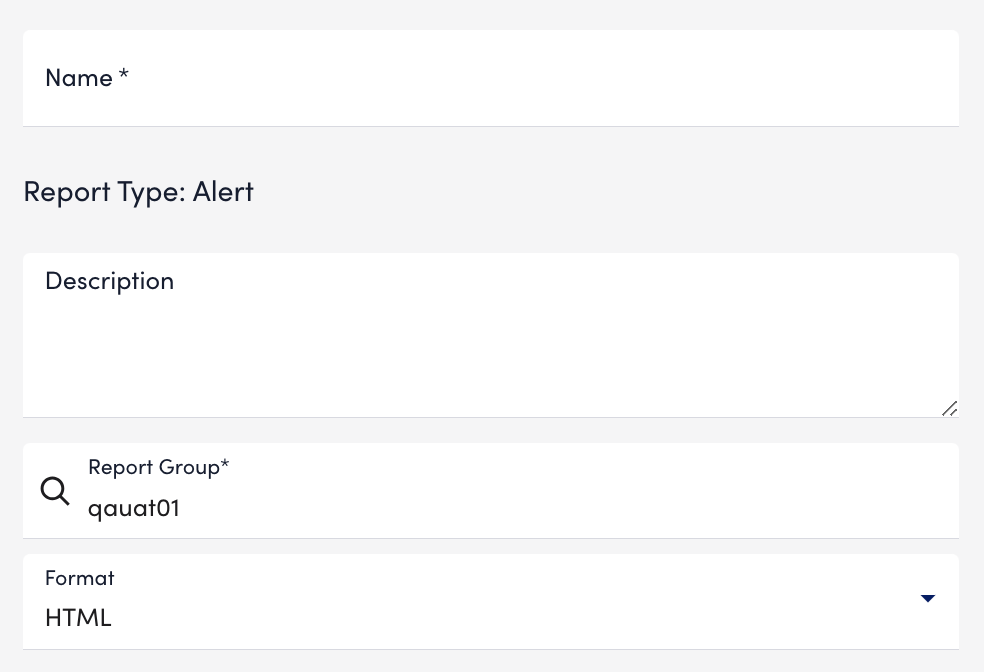
- In the Name field, enter a name for the report.
Report names cannot include the operators and comparison functions used in the LogicMonitor datapoint expression syntax. - (Optional) In the Description field, enter a description for the report.
For example, you can enter a description of the specific purpose of the report. - From Report Group, select the report group where your report is stored.
Matching groups display as you type, and you can select the group from the list. - From Format, select the type of format (for example, HTML, PDF, or CSV) for the output of the report
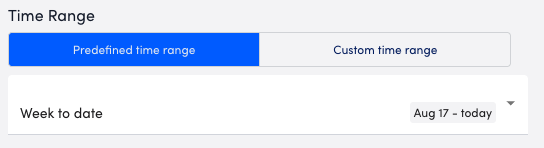
- In Time Range settings, configure the time range you want to base the report on by doing one of the following:
- To configure a predefined time range, select Predefined time range, and then select on of the time range options.
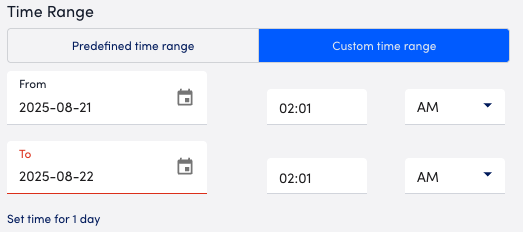
- To configure a custom time range, select Custom time range, and then configure the date and time.
- To configure a predefined time range, select Predefined time range, and then select on of the time range options.
Note: For time ranges of two months or less, you can include a maximum of 10,000 resource instances in your report. For time ranges greater than two months, you can include a maximum of 5,000 instances.
- Add Uptime resources to the report by doing one of the following:
- To add a resource group, select Resource Group and then enter the name of a resource group you want to include in the report.
LogicMonitor attempts to match values as you type.
You can add as many resource groups as needed. - To add individual resources, select Resources and then enter the name of the Uptime resource you want to include in the report.
LogicMonitor attempts to match values as you type.
You can add as many Uptime resources as needed.
- To add a resource group, select Resource Group and then enter the name of a resource group you want to include in the report.
- From Locations to Display, select whether the report should display your data in an overall view or as individual instances using the following options:
- To display a combined view of all instances, select “Overall”.
This provides a combined view of all instances. - To display details for each instance separately, select “Overall and Individual”.
- To display a combined view of all instances, select “Overall”.
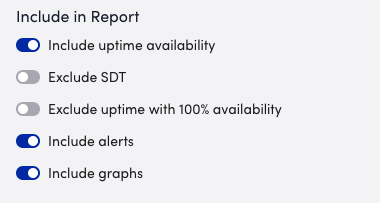
- In the Include in Report settings, configure any of the following that you want to include or exclude in the report:
- To include availability information in the report, toggle the Include uptime availability switch.
This option enables you to exclude the following data from uptime availability:- To exclude scheduled downtime (SDT) from the availability calculation, toggle the Exclude SDT switch.
- To exclude all datasource instances (checkpoints) that have 100% availability, toggle the Exclude uptime with 100% availability switch.
The report does not include records that were always available and never experienced downtime.
- To include alert details in the report, toggle the Include alerts switch.
- To include a graphical representations in the report, toggle the Include graphs switch.
- To include availability information in the report, toggle the Include uptime availability switch.
- In Report Schedule settings, do the following to configure the report to generate on a schedule:
- Toggle the Generate this report on a schedule switch.
- From the Frequency dropdown menu, select how frequent you want the report to generate, and then configure when you want the report to generate.
For example, if you configure the report to generate daily, you can choose the time to generate the report each day. If you configure the report to generate weekly, you can choose the day of the week and time to generate the report for the selected date. If you configure the report to generate monthly, you can configure the day of the month and time to generate the report.
Each frequency option provides you a setting for selecting the time zone. - In Recipients Email, enter the name of the user you want to receive the generated report. You can also add recipient groups.
You can enter as many users as needed.
LogicMonitor attempts to match values as you type.
The recipients you add to the report are emailed a generated report based on the format you configured and the email associated with the username.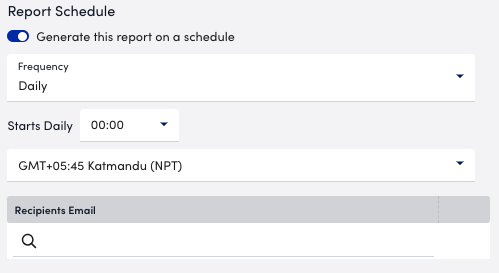
Note: When configuring a delivery schedule, your report is generated and emailed immediately if it has not been generated within the last 24 hours. After that, emailed delivery only occurs according to the schedule.
- To save the report, do one of the following:
- Select Save.
The report saves to the Report Group you selected.
If you configured the report to generate on a schedule, the report generates and sends to recipients based on the frequency you configured. - Select Save and Run.
The report saves to the Report Group you selected and generates a report based on the format you configured.
If you configured the report to generate on a schedule, the report generates and sends to recipients based on the frequency you configured.
- Select Save.
