
Usage Reporting for Dynamic Service Insights
Last updated - 17 March, 2026
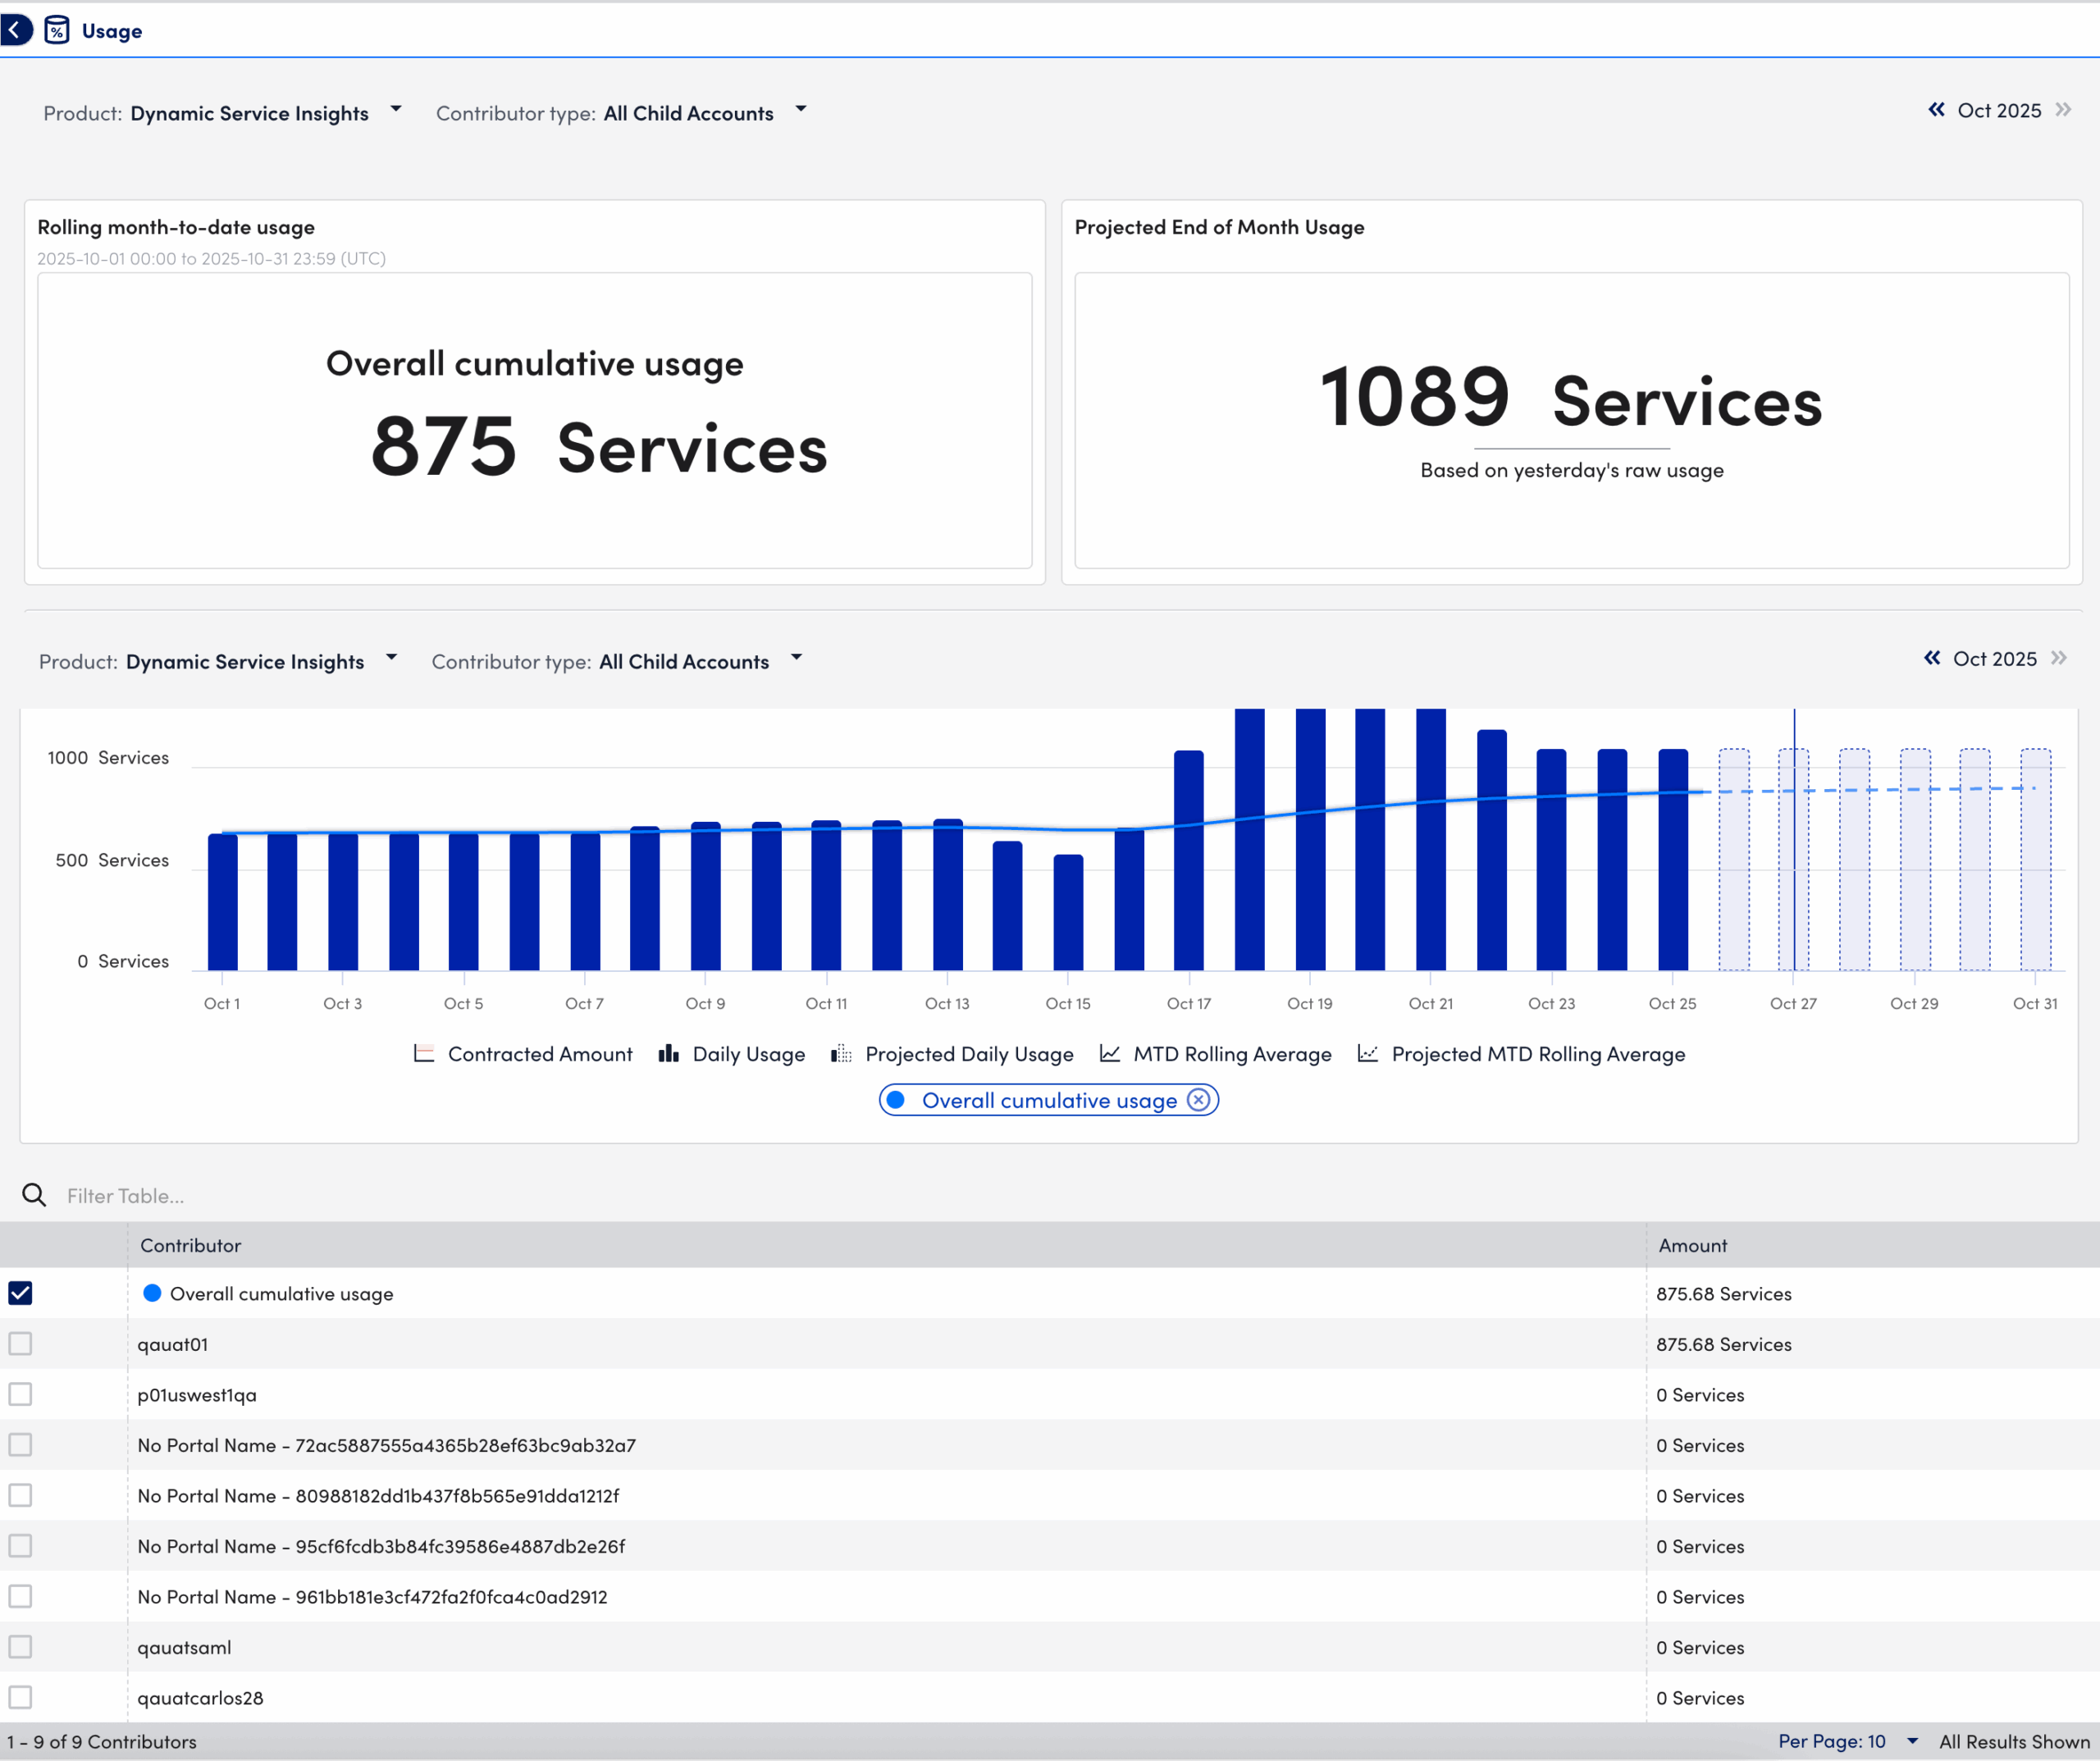
You can use Usage Reporting to view the usage metrics for Dynamic Service Insights (DSI) in your LogicMonitor portal. The usage metrics display the monthly average count of your monitored services.
These metrics enable you to track the number of monitored services associated with your DSI licensing.
Usage Reporting helps you do the following:
- View and compare Dynamic Service Insight counts across your monitored services
- Understand total usage across all contributors (aggregate monthly average)
- Track DSI service growth and ensure usage remains within your licensed allocation
- Analyze daily and projected usage trends to anticipate changes in consumption
LogicMonitor provides licensing for Dynamic Service Insights as a distinct SaaS product within LM Envision. Dynamic Service Insights enable you to monitor IT services holistically by aggregating datapoints across related resources.
Billing and Usage Calculation for Dynamic Service Insights
The following table summarizes how Dynamic Service Insights (DSI) licensing, usage measurement, and billing are calculated in LogicMonitor. These rules determine how your monitored services contribute to monthly consumption and how units are applied against your subscription.
| Category | Details |
| Licensing Model | Dynamic Service Insights are licensed in units. Each unit includes up to 25 Dynamic Service Insights, measured as a monthly average. Billing is determined by the average number of DSI services monitored throughout the month, not by total or peak usage. |
| Usage Calculation | Usage is measured as the monthly average count of monitored DSI services. This is calculated from daily recorded service counts and includes all monitored services, regardless of contributor or status. |
| Billing Formula | Units Consumed = (Monthly average DSI services) ÷ 25 |
| Billing Considerations | Temporary spikes do not immediately affect billing unless they raise the monthly average. If the monthly average exceeds your licensed allocation, additional usage may incur charges according to your licensing agreement. |
Requirements for Viewing Usage Data for Dynamic Service Insights
To view usage data for DSI in Usage Reporting, you need the following:
- An account with a license for DSI
- A user with the manage permissions for “Usage” settings
For more information, see Users and Roles.
Viewing Usage Data for Dynamic Service Insights
- In LogicMonitor, navigate to Settings > Usage.
- Select “Dynamic Service Insights” from the Product dropdown menu.
- To interact with the Usage Contributors table, select “All Child Accounts” from Contributor Type dropdown menu.
- Select the month you want to view usage for.
- Hover over the date in the bar graph to view the daily rolling average and cumulative count.
- Select
 to select or unselect the following options:
- Daily Usage—Displays actual recorded usage data for each day within the selected month.
- Projected Daily Usage—Estimates expected daily usage based on current activity and historical averages.
- MTD Rolling Average—Displays the month-to-date rolling average of usage across all selected days.
- Projected MTD Rolling Average—Provides a forecasted month-to-date usage average calculated from current usage trends.
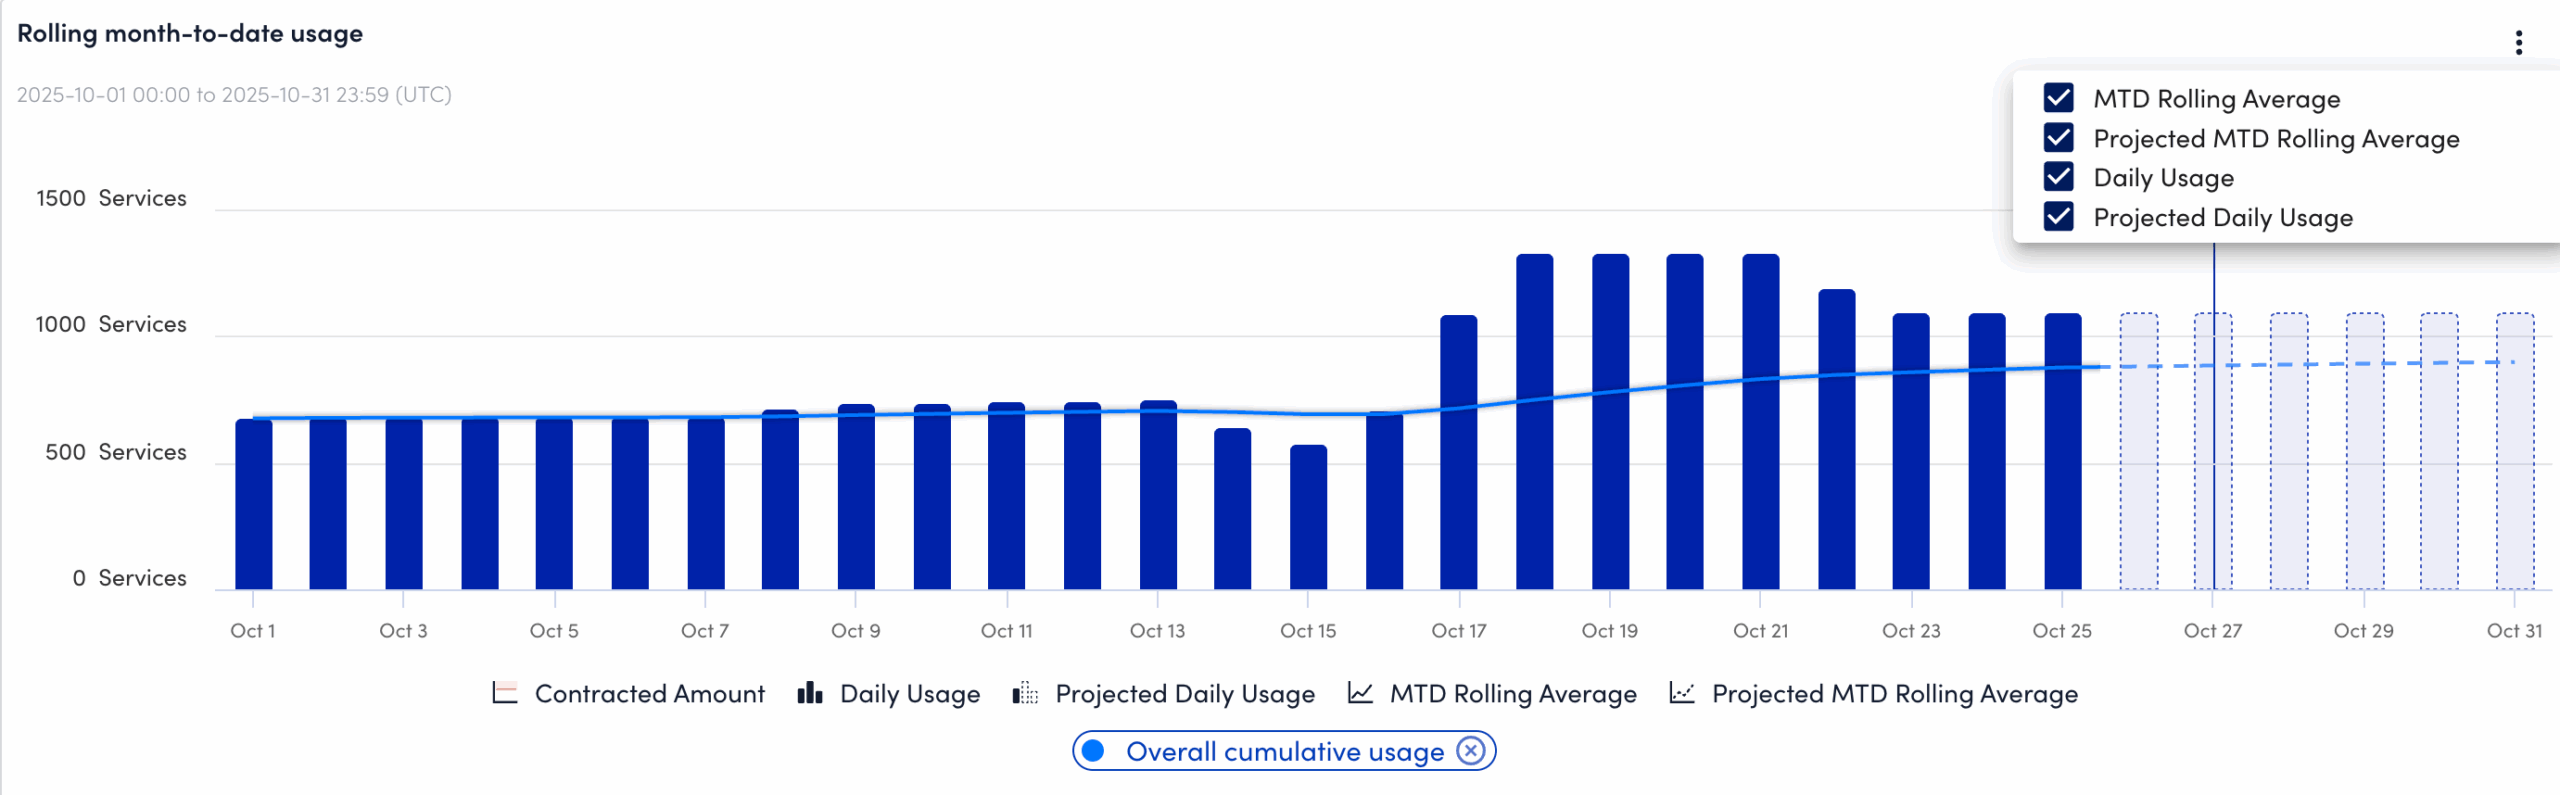
Note: If “All Child Accounts” is selected from Contributor Type, you must select a contributor from the Contributor Type table to display data in the Cumulative Usage graph.
