
Log Query Library
Last updated - 31 March, 2026
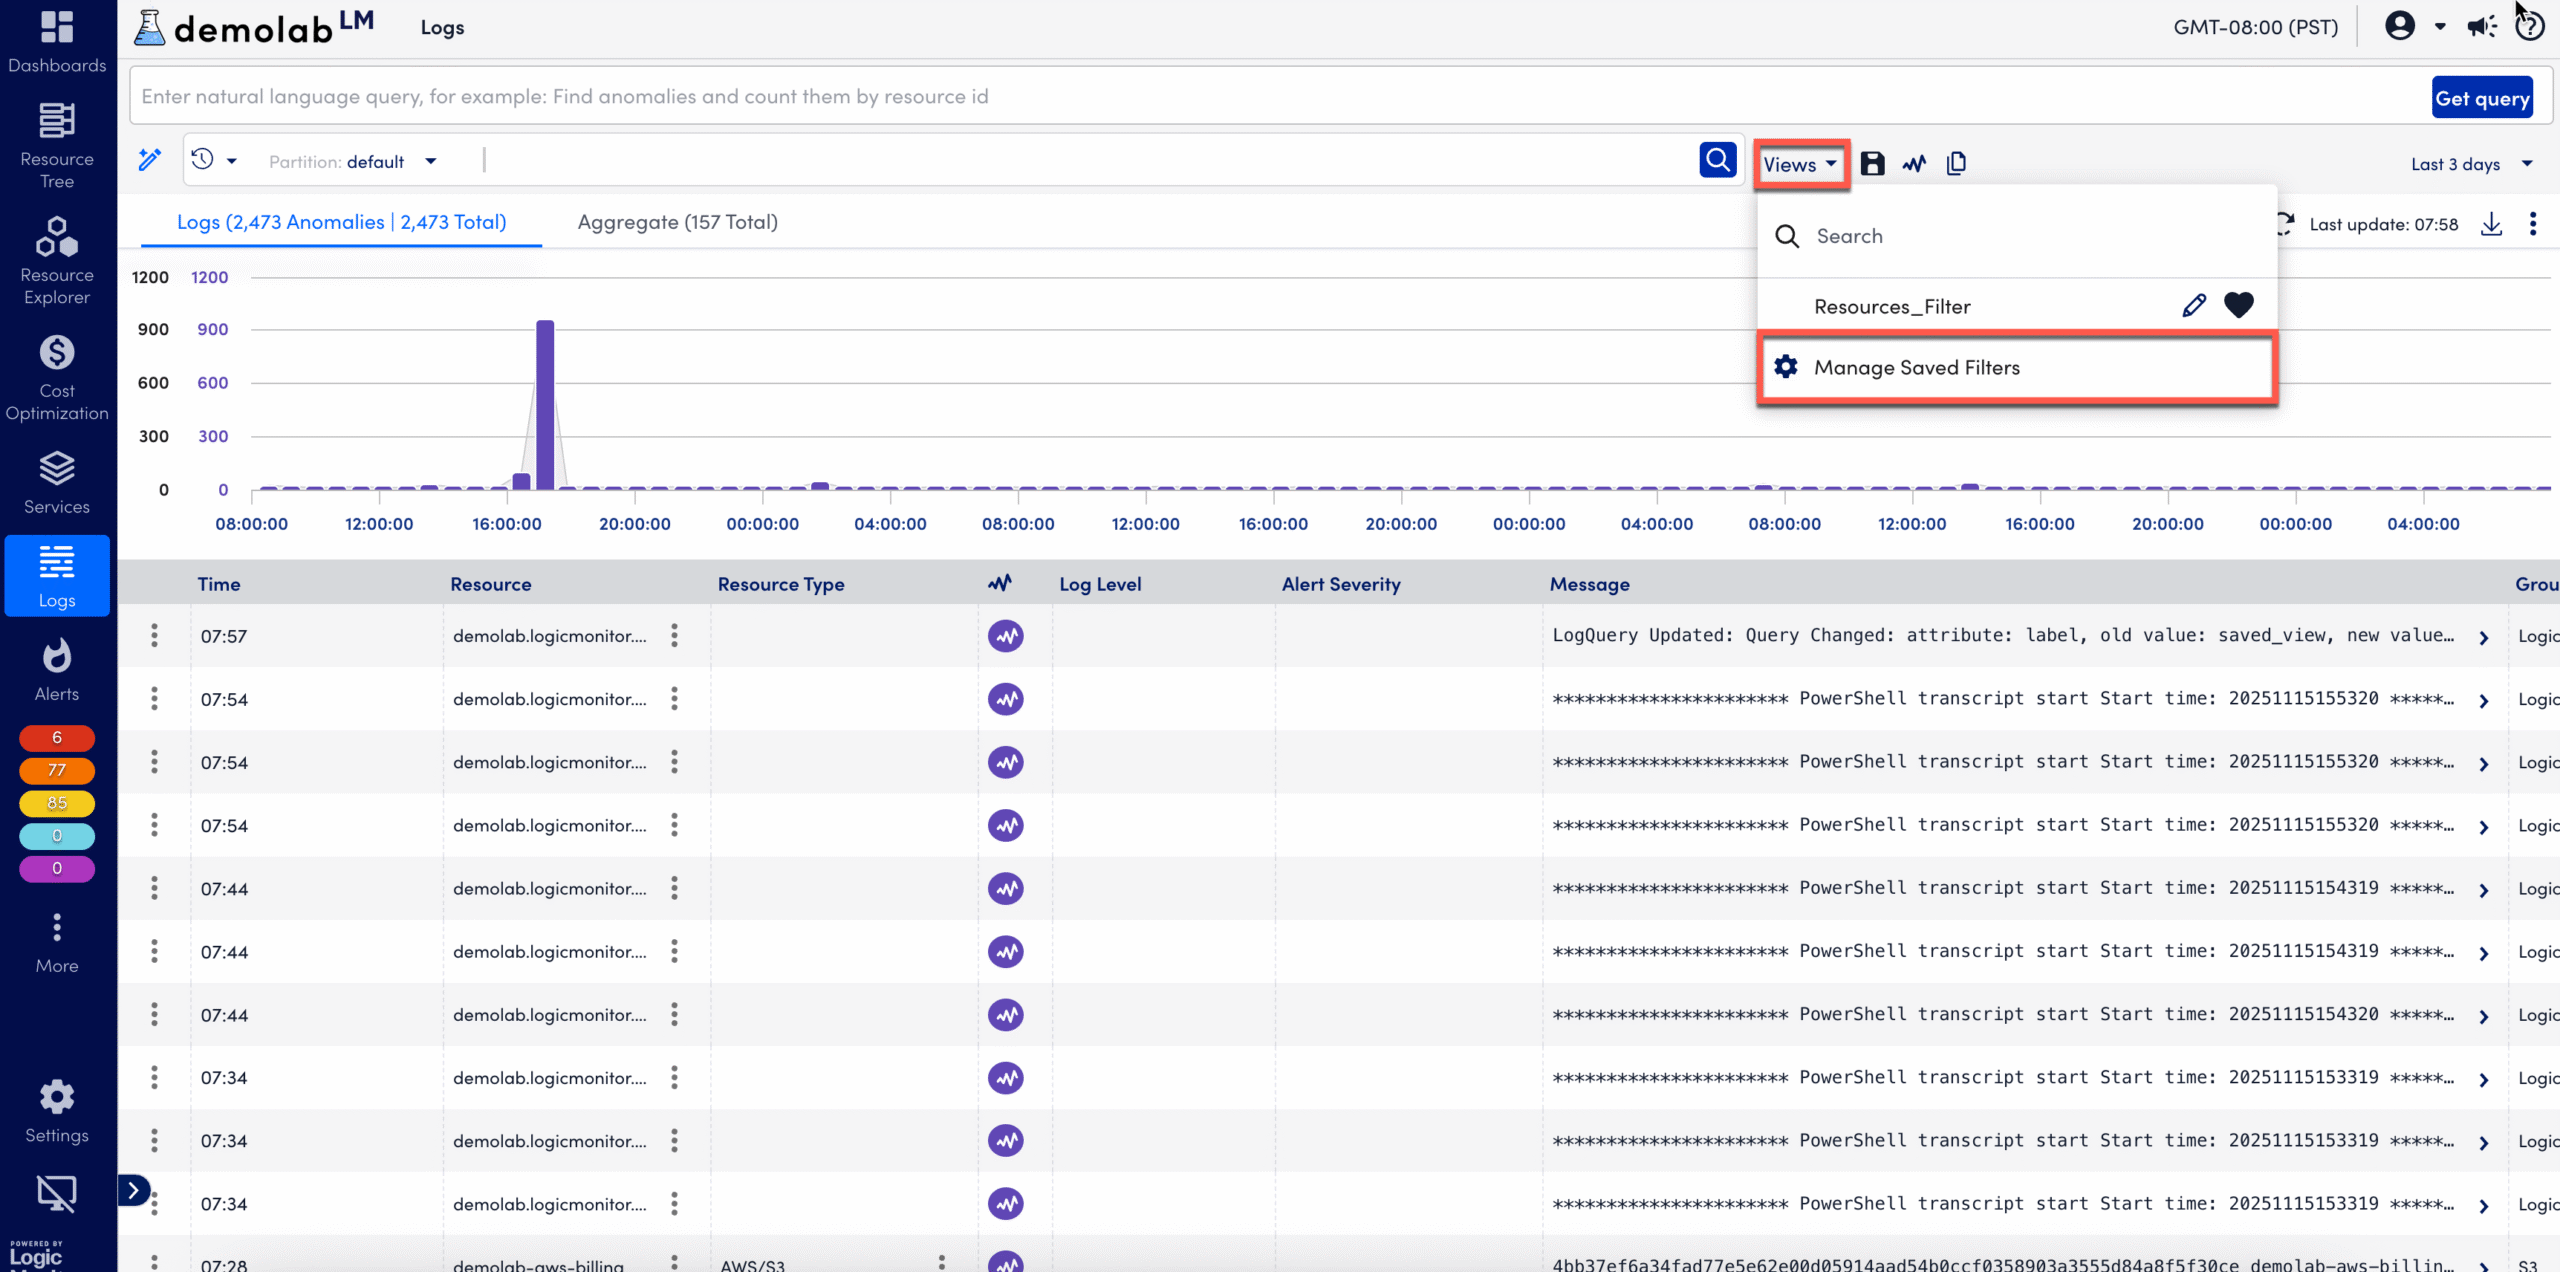
The Log Query Library enables you to save, organize, and manage your log queries for quick access. When you run a query, you can save its filters, time range, and display preferences as a Saved View, which enables you to return to the same log context later. All saved queries are displayed in the Manage Saved Filters panel, organized by Group Type.
For more information on managing the saved queries, see Log Query Library Management in the product documentation.
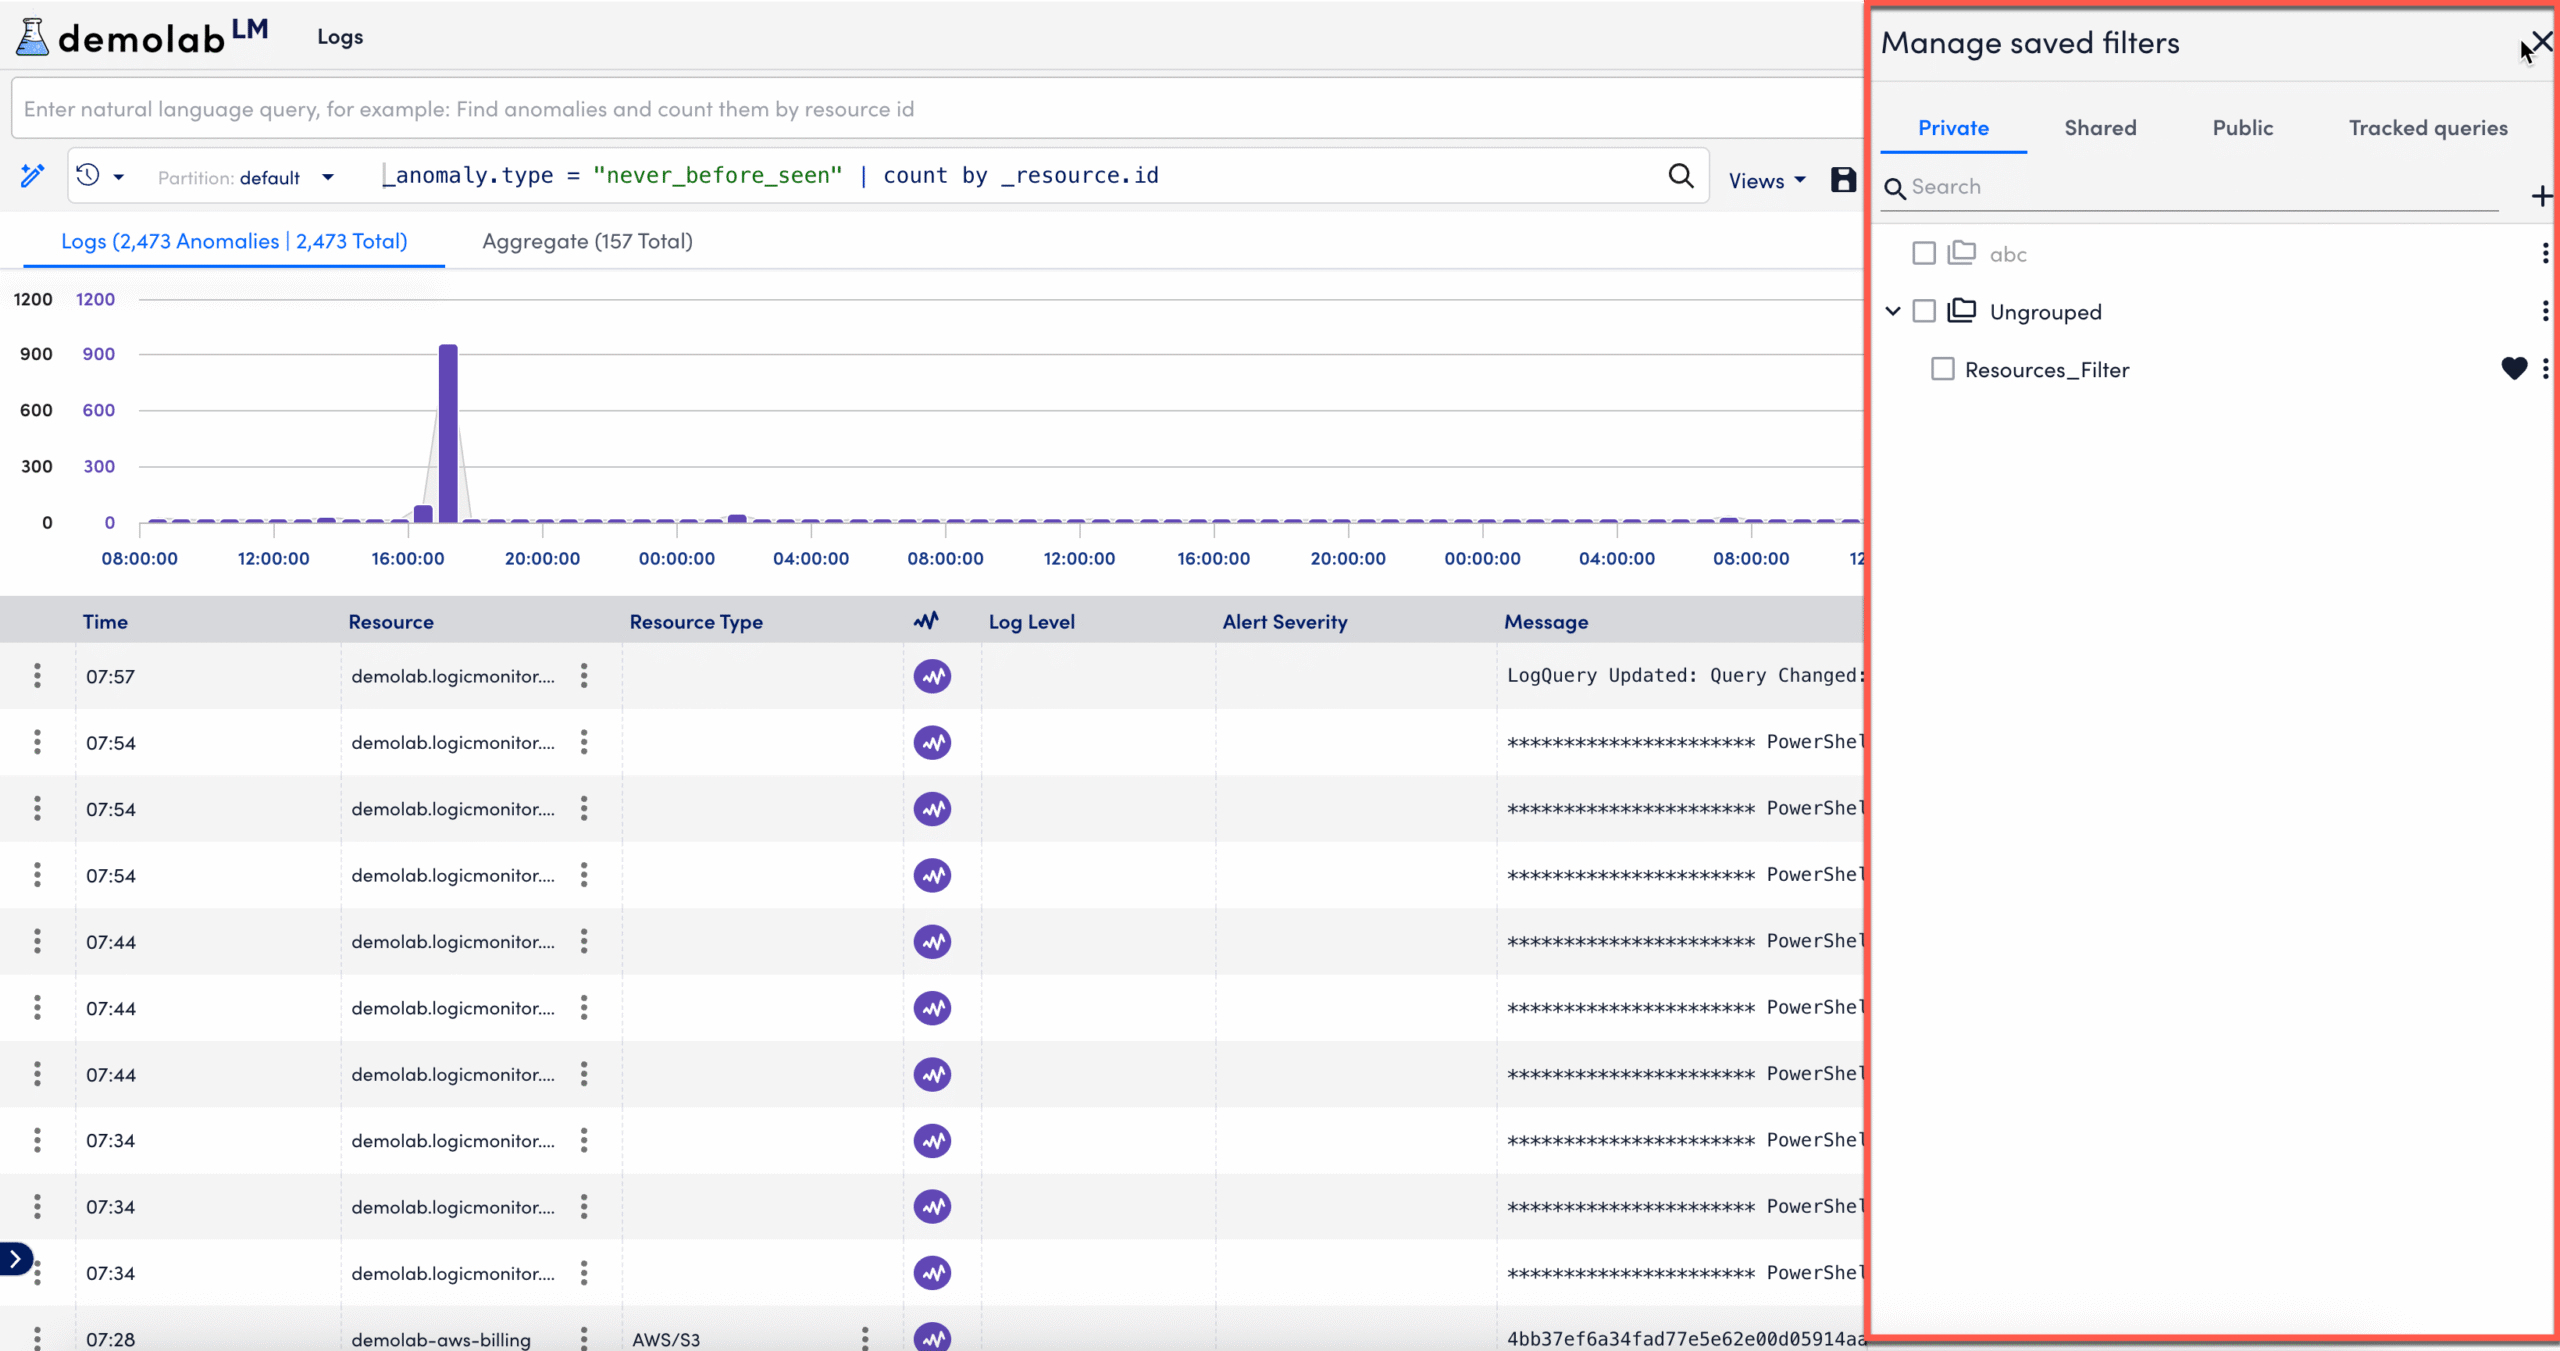
The Log Query Library helps you organize and access saved queries using the following folders:
- Private folder stores all your personal queries, visible only to you.
- Shared folders contain queries shared with users who have the same role or scope, making collaboration easier across your team.
- Public folders store queries accessible to all LM Logs users in your portal. These can be published by LogicMonitor or by customer admins.
- Tracked queries store queries you have marked for tracking from your Private folder, helping you monitor specific searches over time.
For more information on query tracking management, see Logs Query Tracking in the product documentation.
Note: Role-Based Access Control (RBAC) settings determine how users interact with Shared and Public queries in the Log Query Library.
Users with Manage permission for a Shared or Public Query Group can create, edit, or delete queries within that group.
Users without Manage permission can view and run queries but cannot modify or remove them.
RBAC configurations ensure that only authorized roles can publish or update queries visible across multiple teams or the entire organization.
These Log Query Groups act as folders or categories for related saved views. These groups help streamline access across teams, whether you are organizing by environment (for example, “Production vs. Dev”), by use case (for example, “Security Events”, “App Errors”), or by system type (for example, “Windows”, “Firewall”, “Cloud”).
Requirements for Creating a Log Query as a Saved View
To create, save, or manage log query filters, you need the following:
- Your account includes an LM Logs license.
- A valid log query using correct syntax. If your log query results in an error and does not execute, you cannot save it as a saved view.
Creating and Saving a Log Query
- In LogicMonitor, navigate to Logs.
- To create a log query, you can do one of the following:
- To leverage LogPilot using the natural language query bar:
- Enter a natural language query.
- Select Get Query.
- To enter a formal query using the Log query bar:
- Enter a formal query using field names and operators in the Query bar.
For more information on using the query bar, see Writing a Log Query in the product documentation.
- Enter a formal query using field names and operators in the Query bar.
- To leverage LogPilot using the natural language query bar:
- Select Run Query.
- When the results display, select
 Save view.
 - In the Save View modal, enter the following:
- In the Name field, enter an appropriate name for the view.
- Select the Group Type to determine the visibility level of the saved view. You can choose among Private, Public, or Shared.
- Specify the Group Name, which identifies the query group where the view is stored.
- Select Save as new view.
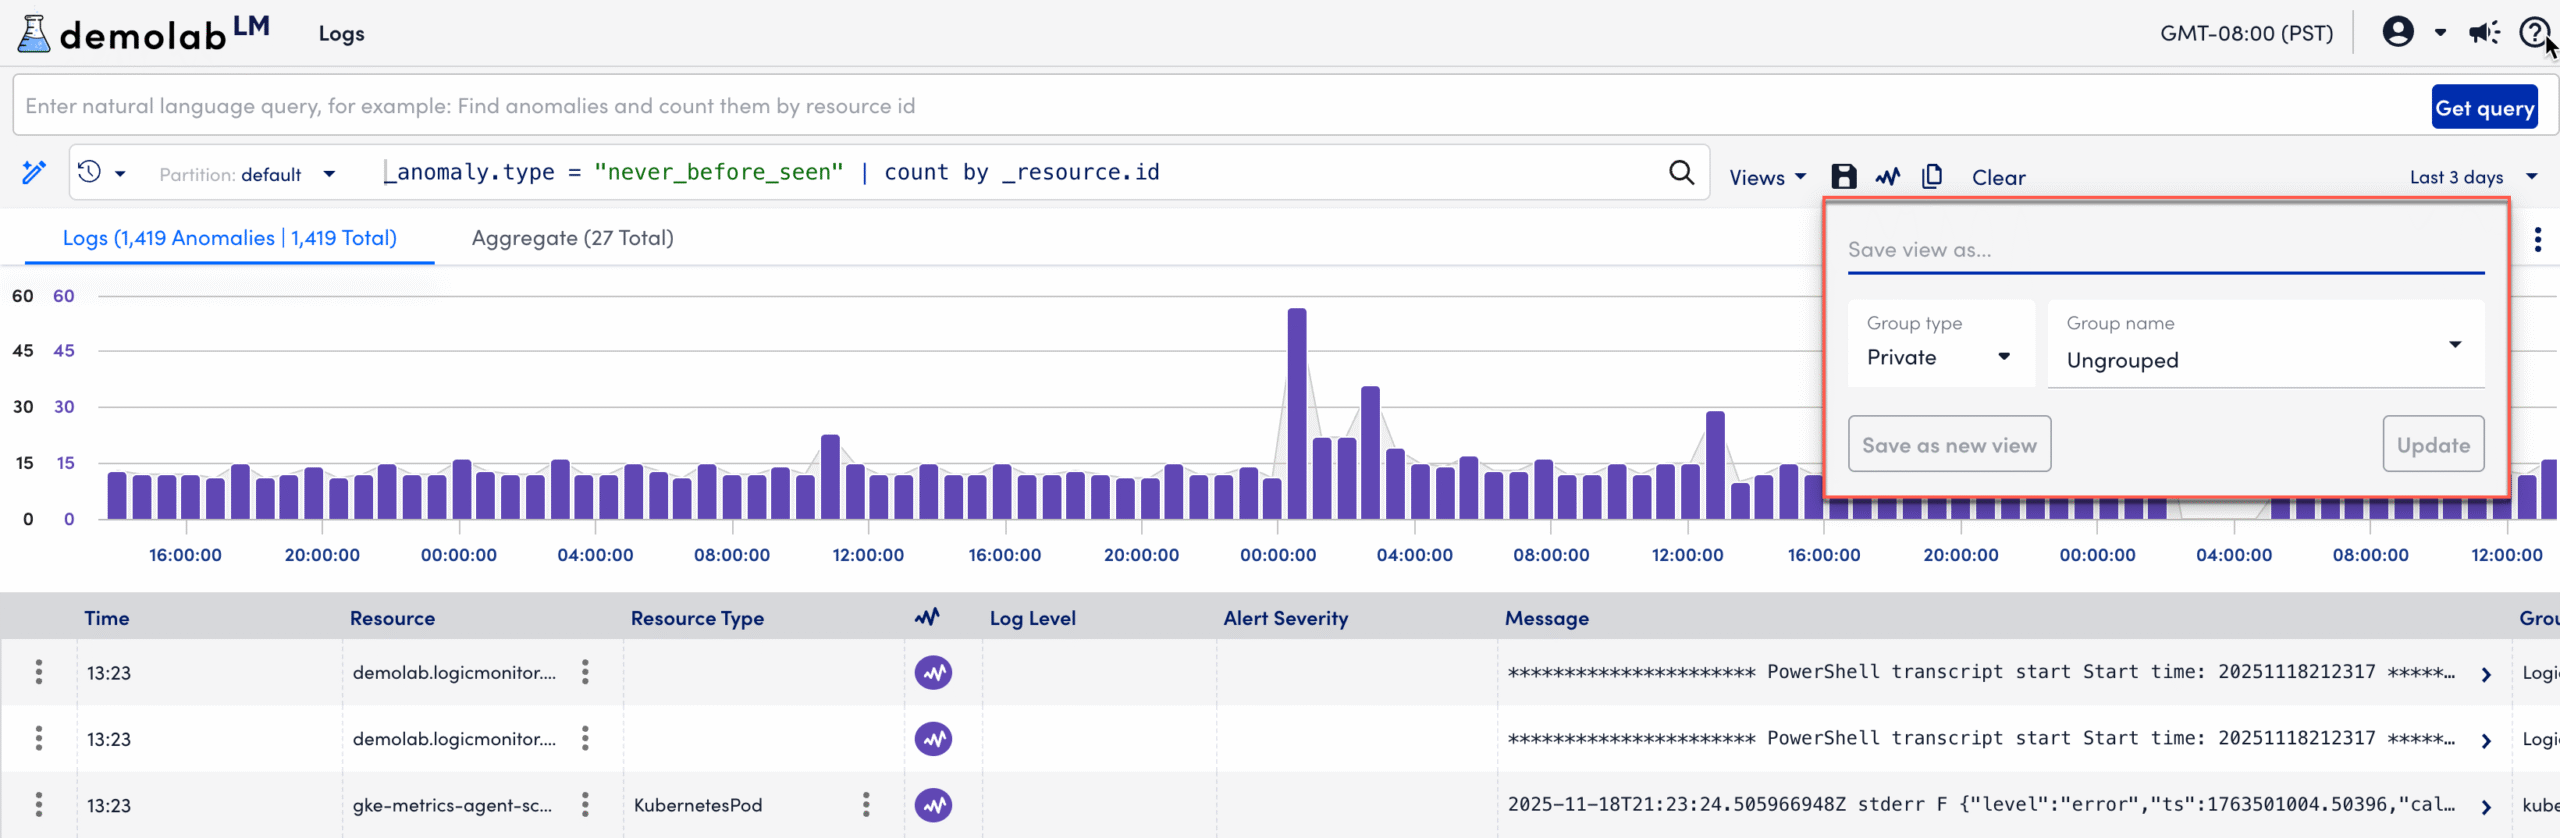
The saved view appears in the Views dropdown and is filed under the tab matching the Group Type you selected in Manage Saved Filters panel.
Note: By default, the saved view is added to the Private group and is marked as a favorite.
