Debugging Groovy Script
Last updated – 21 March, 2026
An embedded Groovy script in your LogicMonitor account runs inside the same JVM as your Collector.
The guidelines to run Groovy scripts on LogicMonitor Collector are as follows:
- The Groovy script must be lightweight.
- When integrated into a DataSource, the Groovy script must execute within a minute.
- The Groovy script must fit within the memory resources of the Collector JVM.
- The Groovy script with errors can interfere with the Collector stability.
Recommendation: If the script you are developing requires iterations during testing, you can set up a sandbox environment for debugging. By installing a new LogicMonitor Collector that you use only for DataSource development and script testing, you can create space to develop code and verify how it interacts with the Collector. For more information, see Adding Collector.
To debug a Groovy script, you can follow any of the following methods:
- Debug Groovy script using Collector Debug window
- Debug Groovy script using a DataSource
- Debug Groovy script using Test Script
Requirements for Debugging Groovy Script
To debug a Groovy script using Test Script, enable the Enable Test Script switch on the Security page. For more information, see Security Settings.
Debugging Groovy Script Using Collector Debug Window
A Groovy script within a LogicMonitor DataSource runs directly on the Collector machine, using the version of Java and Groovy provided in that environment. To run in the same environment, you can use a built-in !groovy command in the Collector Debug window. For more information, see Collector Debug Facility.
- In LogicMonitor, navigate to Settings > Collectors.
- For the Collector that you want to debug, select
 More and then select Run Debug Command.
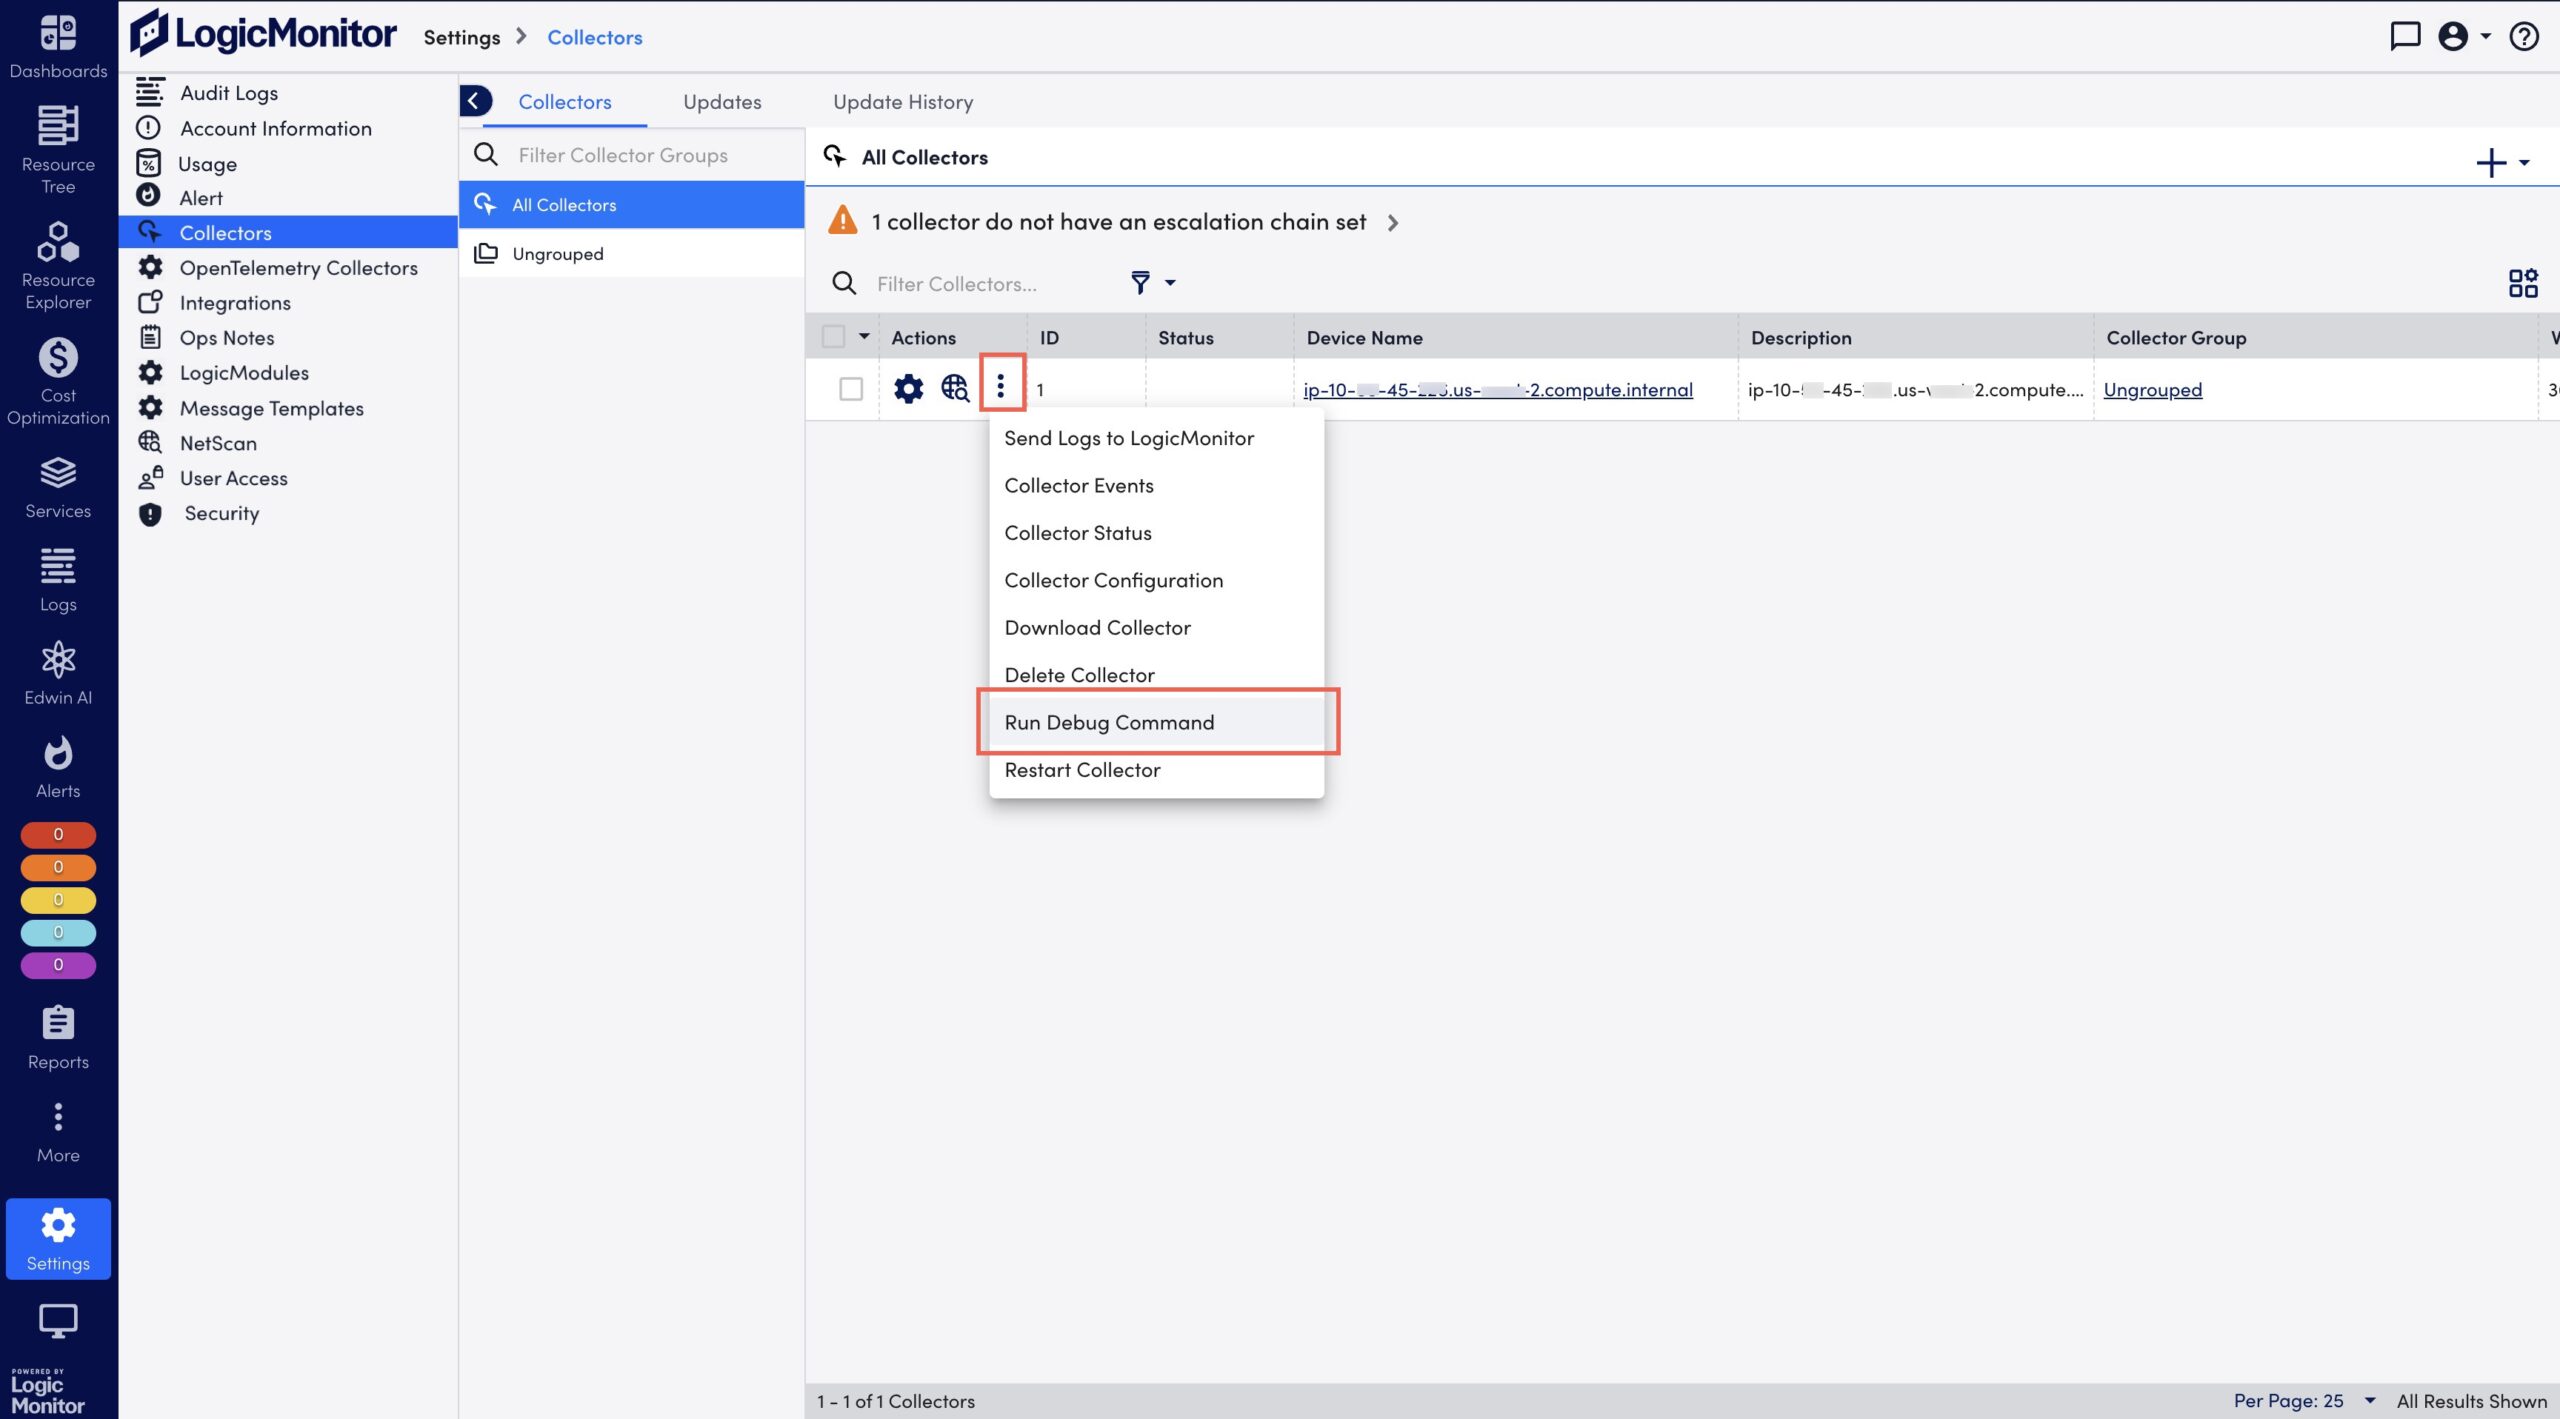
A dialog box confirming your action of opening the Collector Debug window displays. - Select Confirm. The Collector Debug window opens in a new tab.
- Type
!groovyin the Collector Debug window.
The Input Groovy Script modal displays. - Edit the code and select Submit.
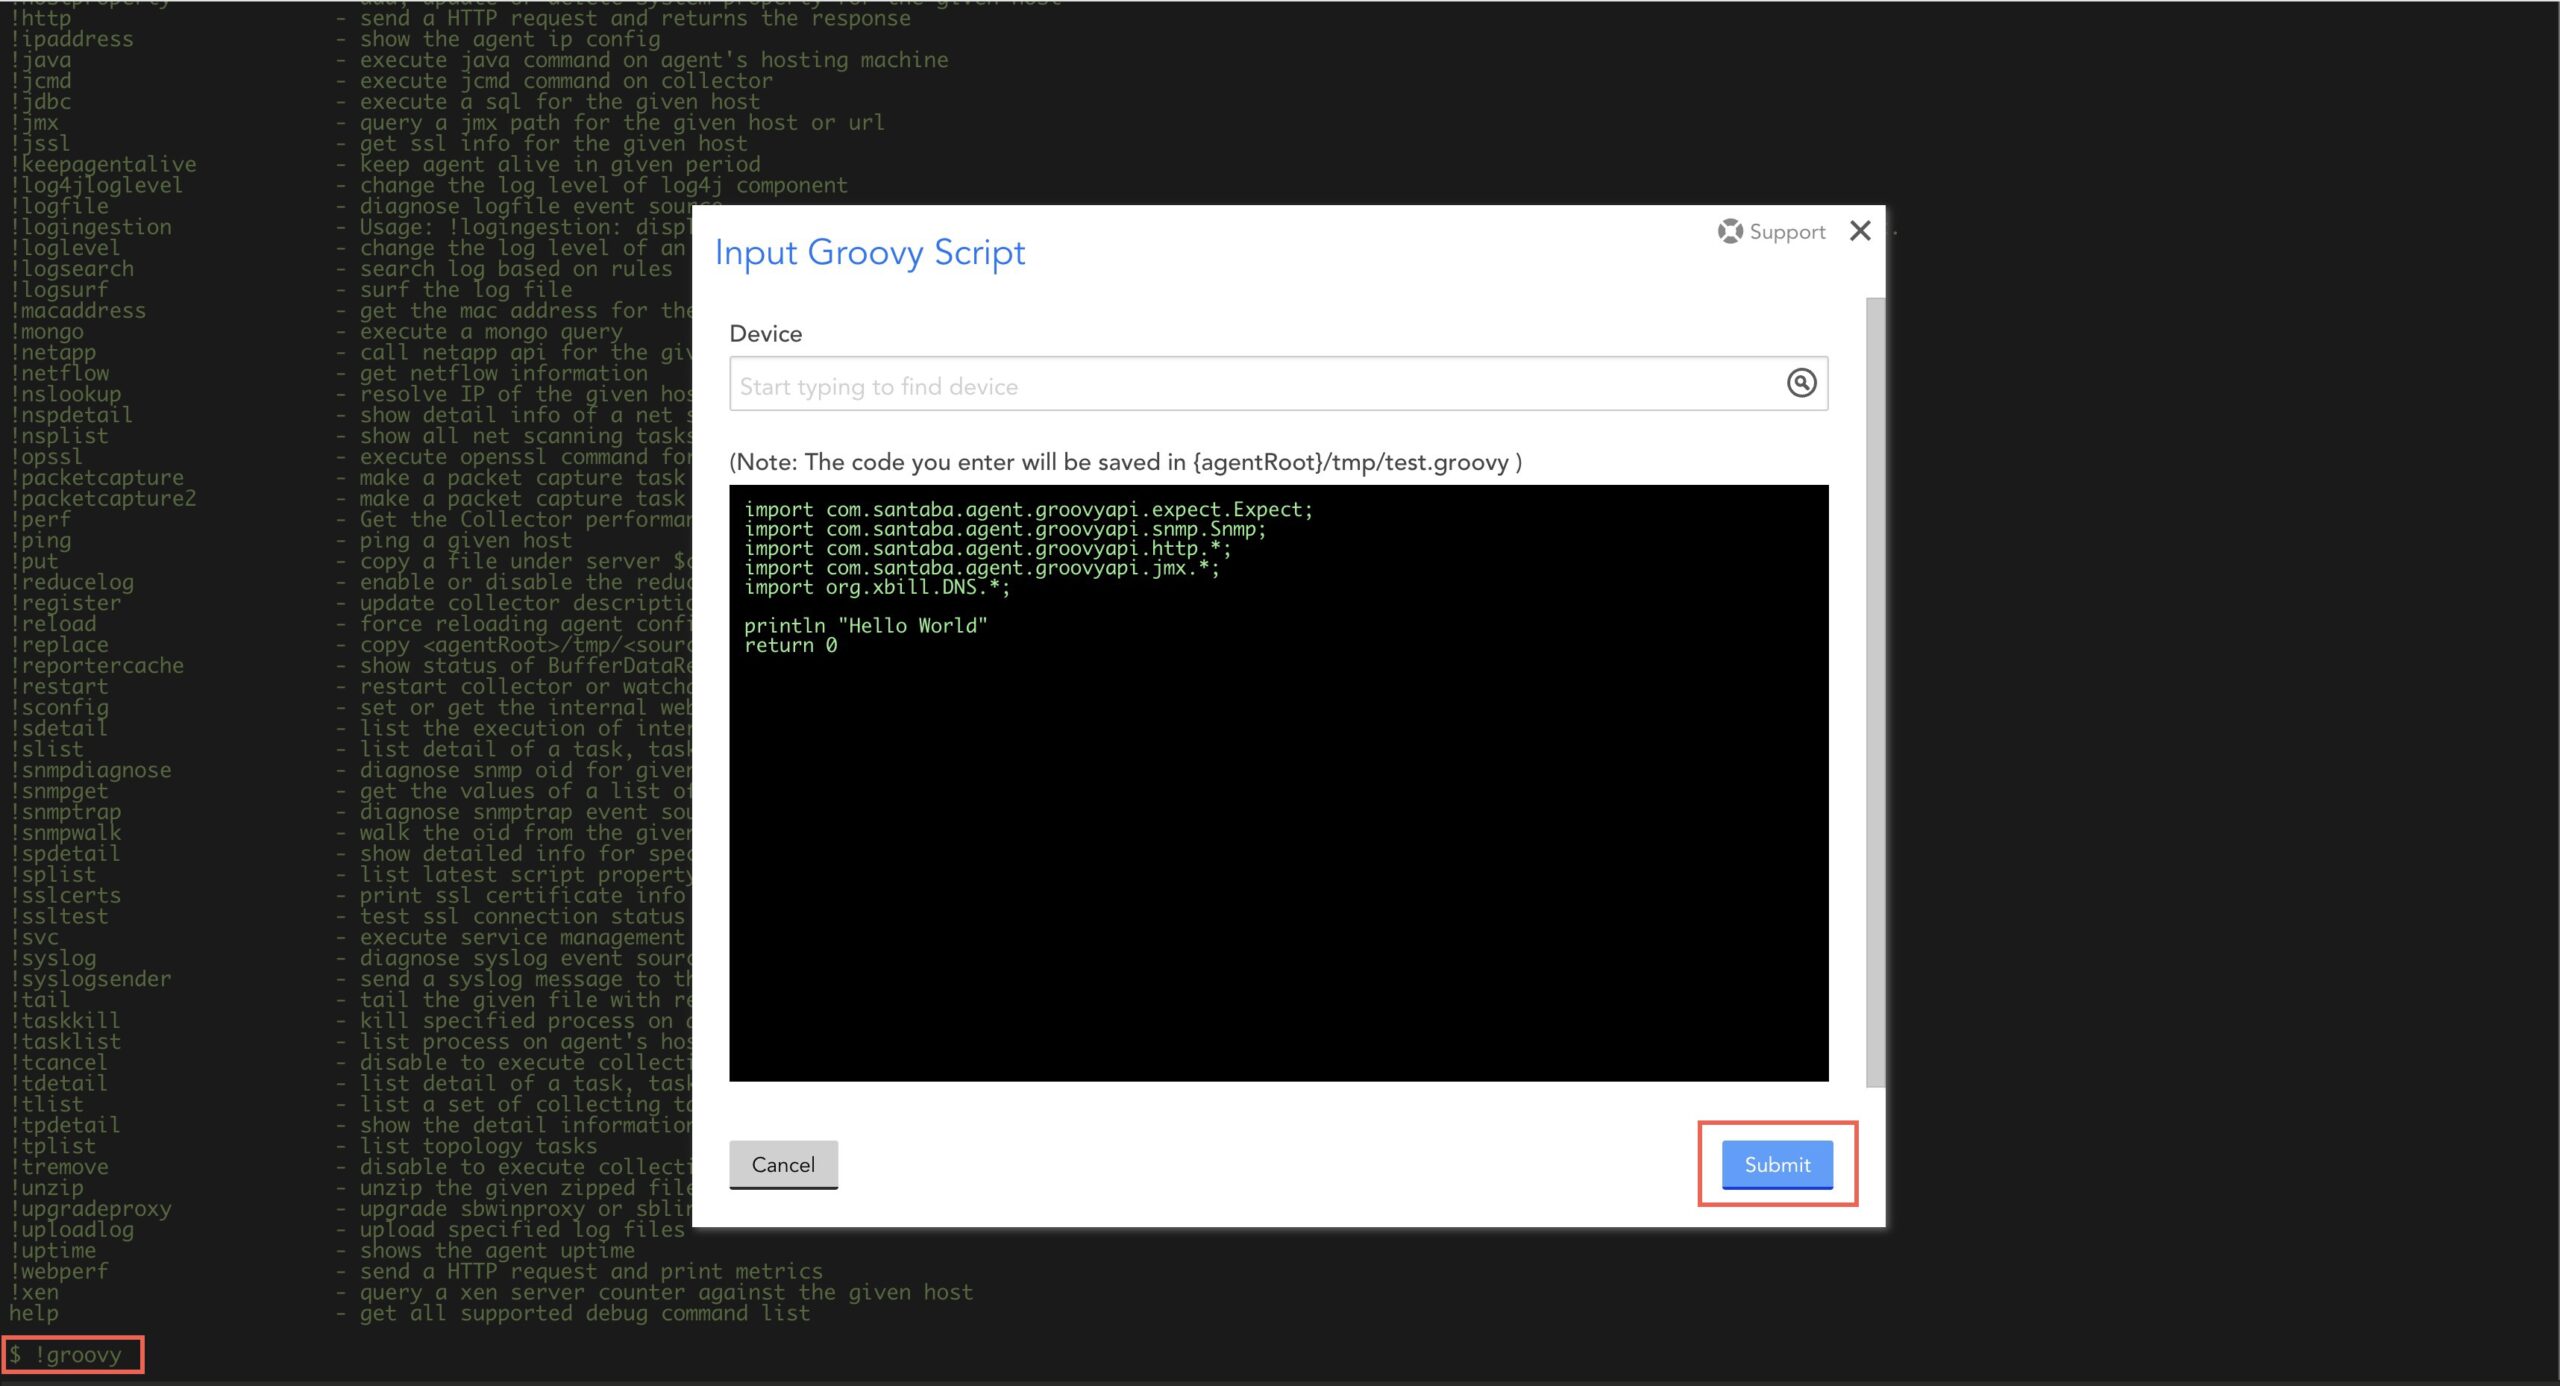
The Collector runs the script and displays the result in the Collector Debug window.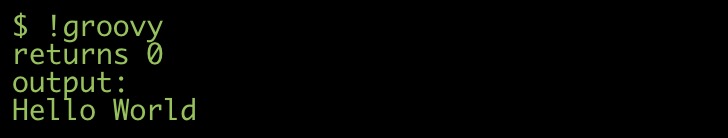
Note: Repeat steps 4-5 until the script works as expected.
- Close the Collector Debug window.
After successfully debugging the script, follow one of the two methods to copy the source code:
- Copy the source code from the Input Groovy Script dialog box.
- Copy the auto-generated file that contains the source code from
agentRoot/tmp/test.groovy.
Debugging Groovy Script Using DataSource
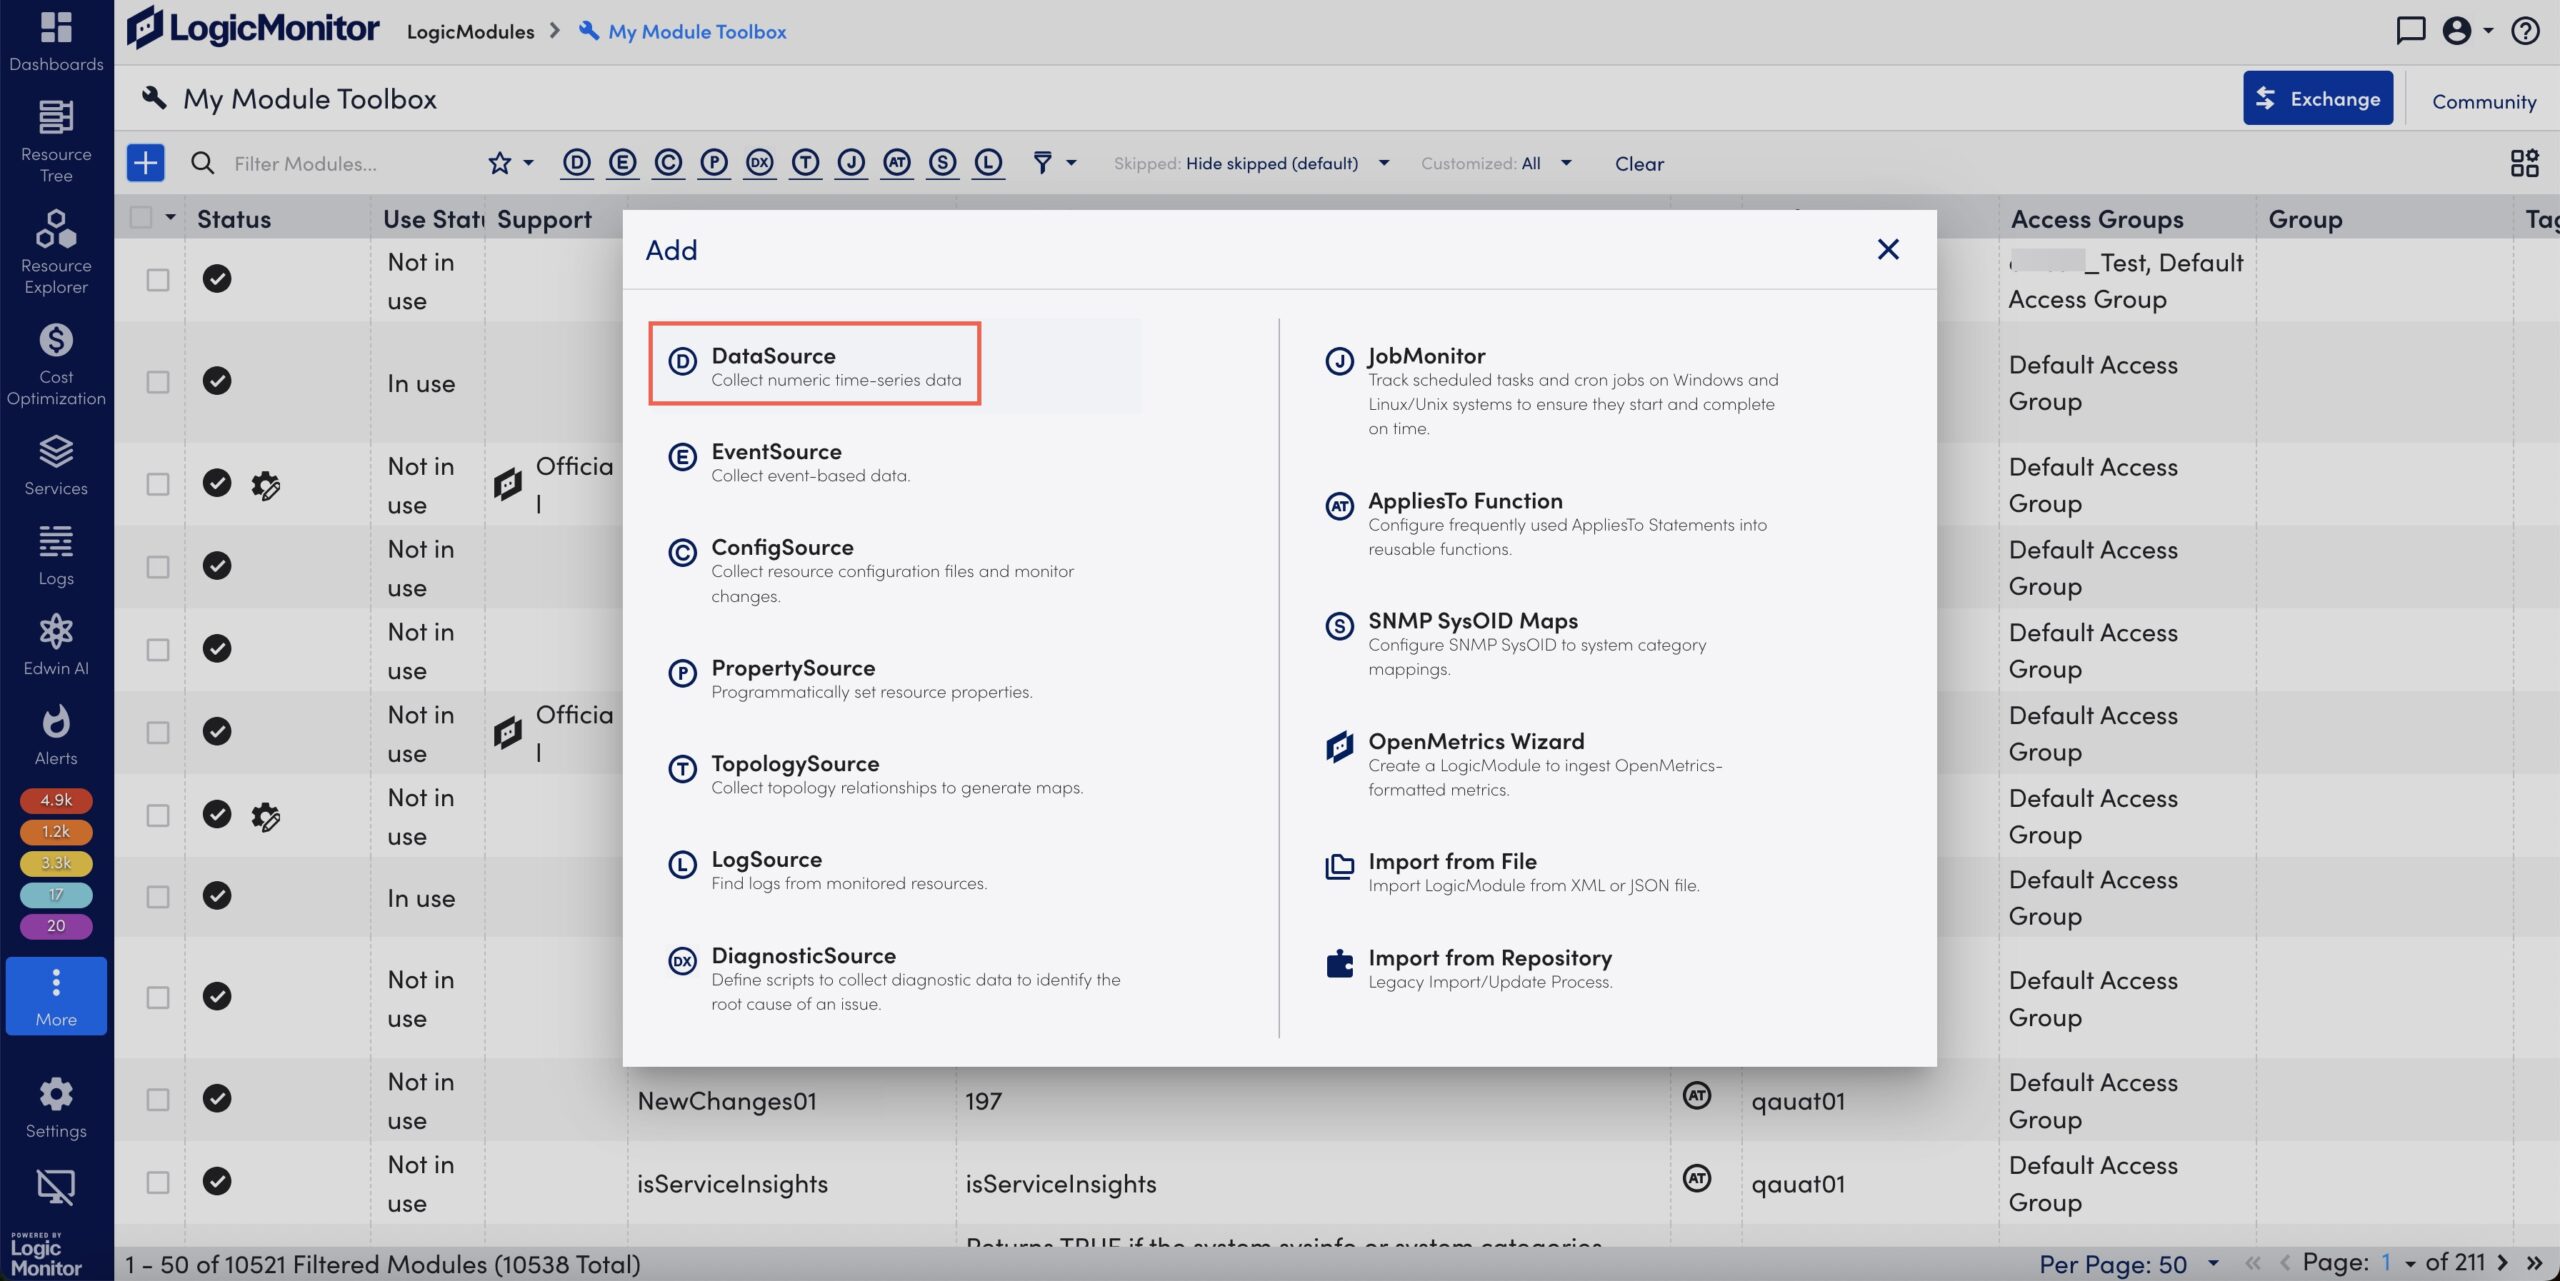
- In LogicMonitor, navigate to Modules.
- On the My Module Toolbox page, select
 Add.
Add. - In the Add modal, select DataSource.
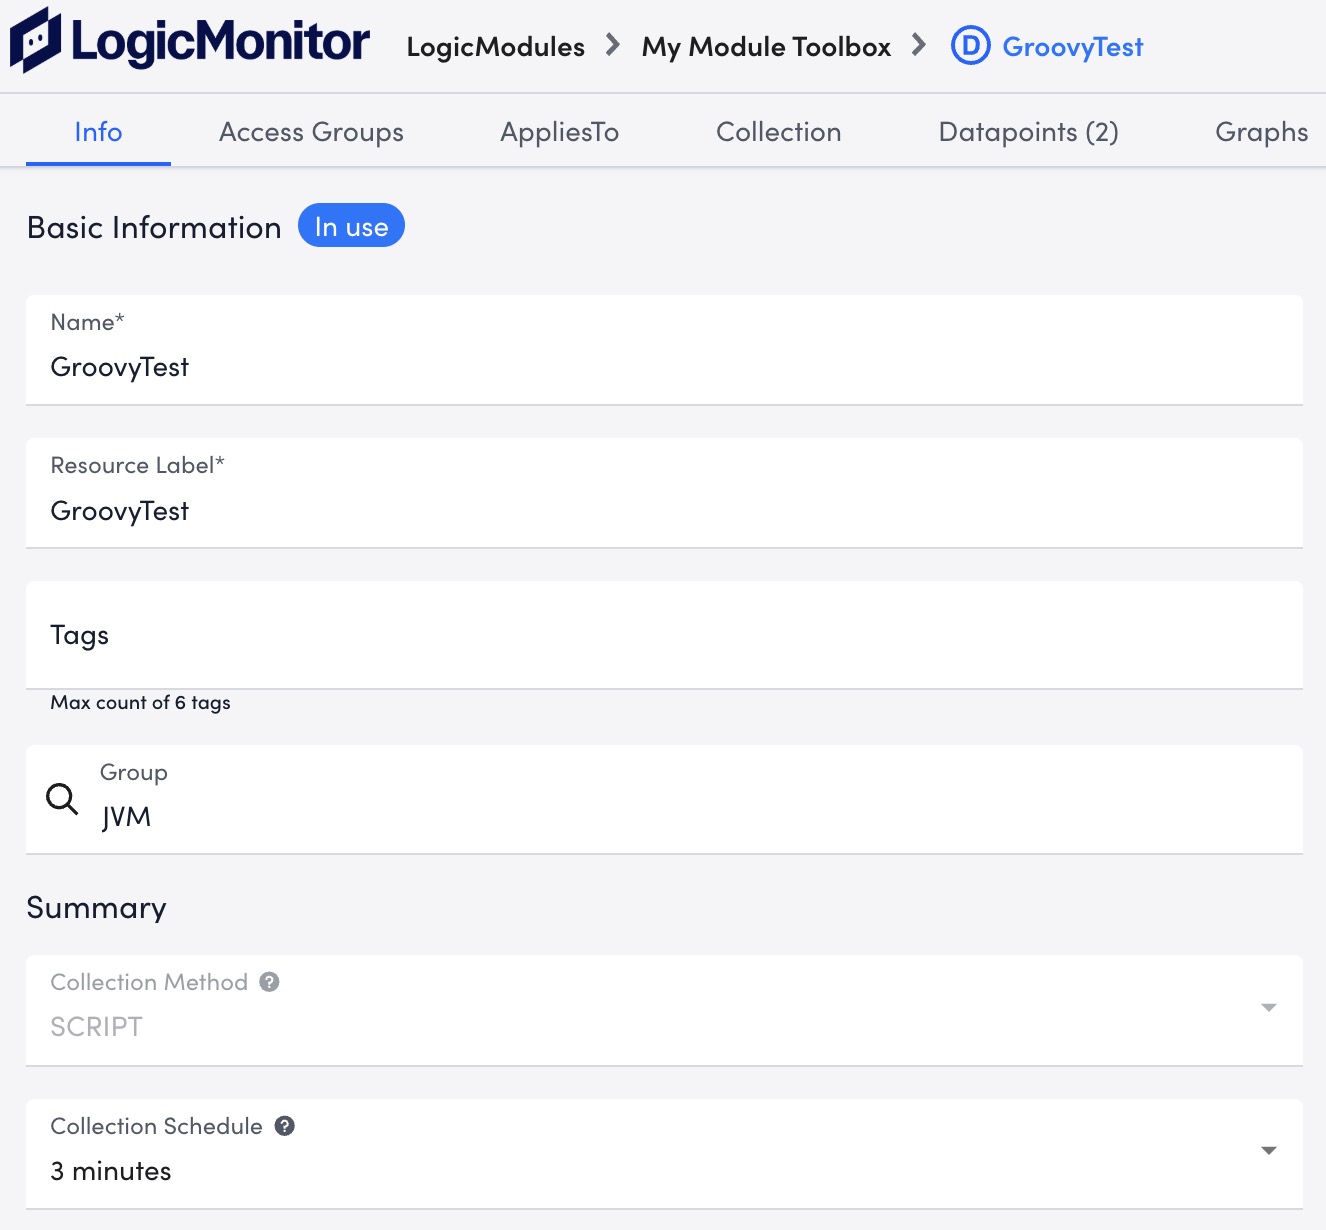
- Create a new DataSource with the desired name, group, and polling interval, and specify the following information:
- Select a device monitored by your sandbox Collector.
- Select “SCRIPT” from the Collection Method dropdown menu.
- Configure the DataSource to match the hostname of the device using the AppliesTo function wizard.
For example, theSystem.hostname == "127.0.0.1"function matches the device monitored by the sandbox Collector. If there is no device monitored by your sandbox Collector, add a device. For more information, see Adding Resources. - Select “Embedded Groovy Script” from the Script Type dropdown menu.
- Enter the code in the Embedded Groovy Script field.
For example, a minimal script to print “3”.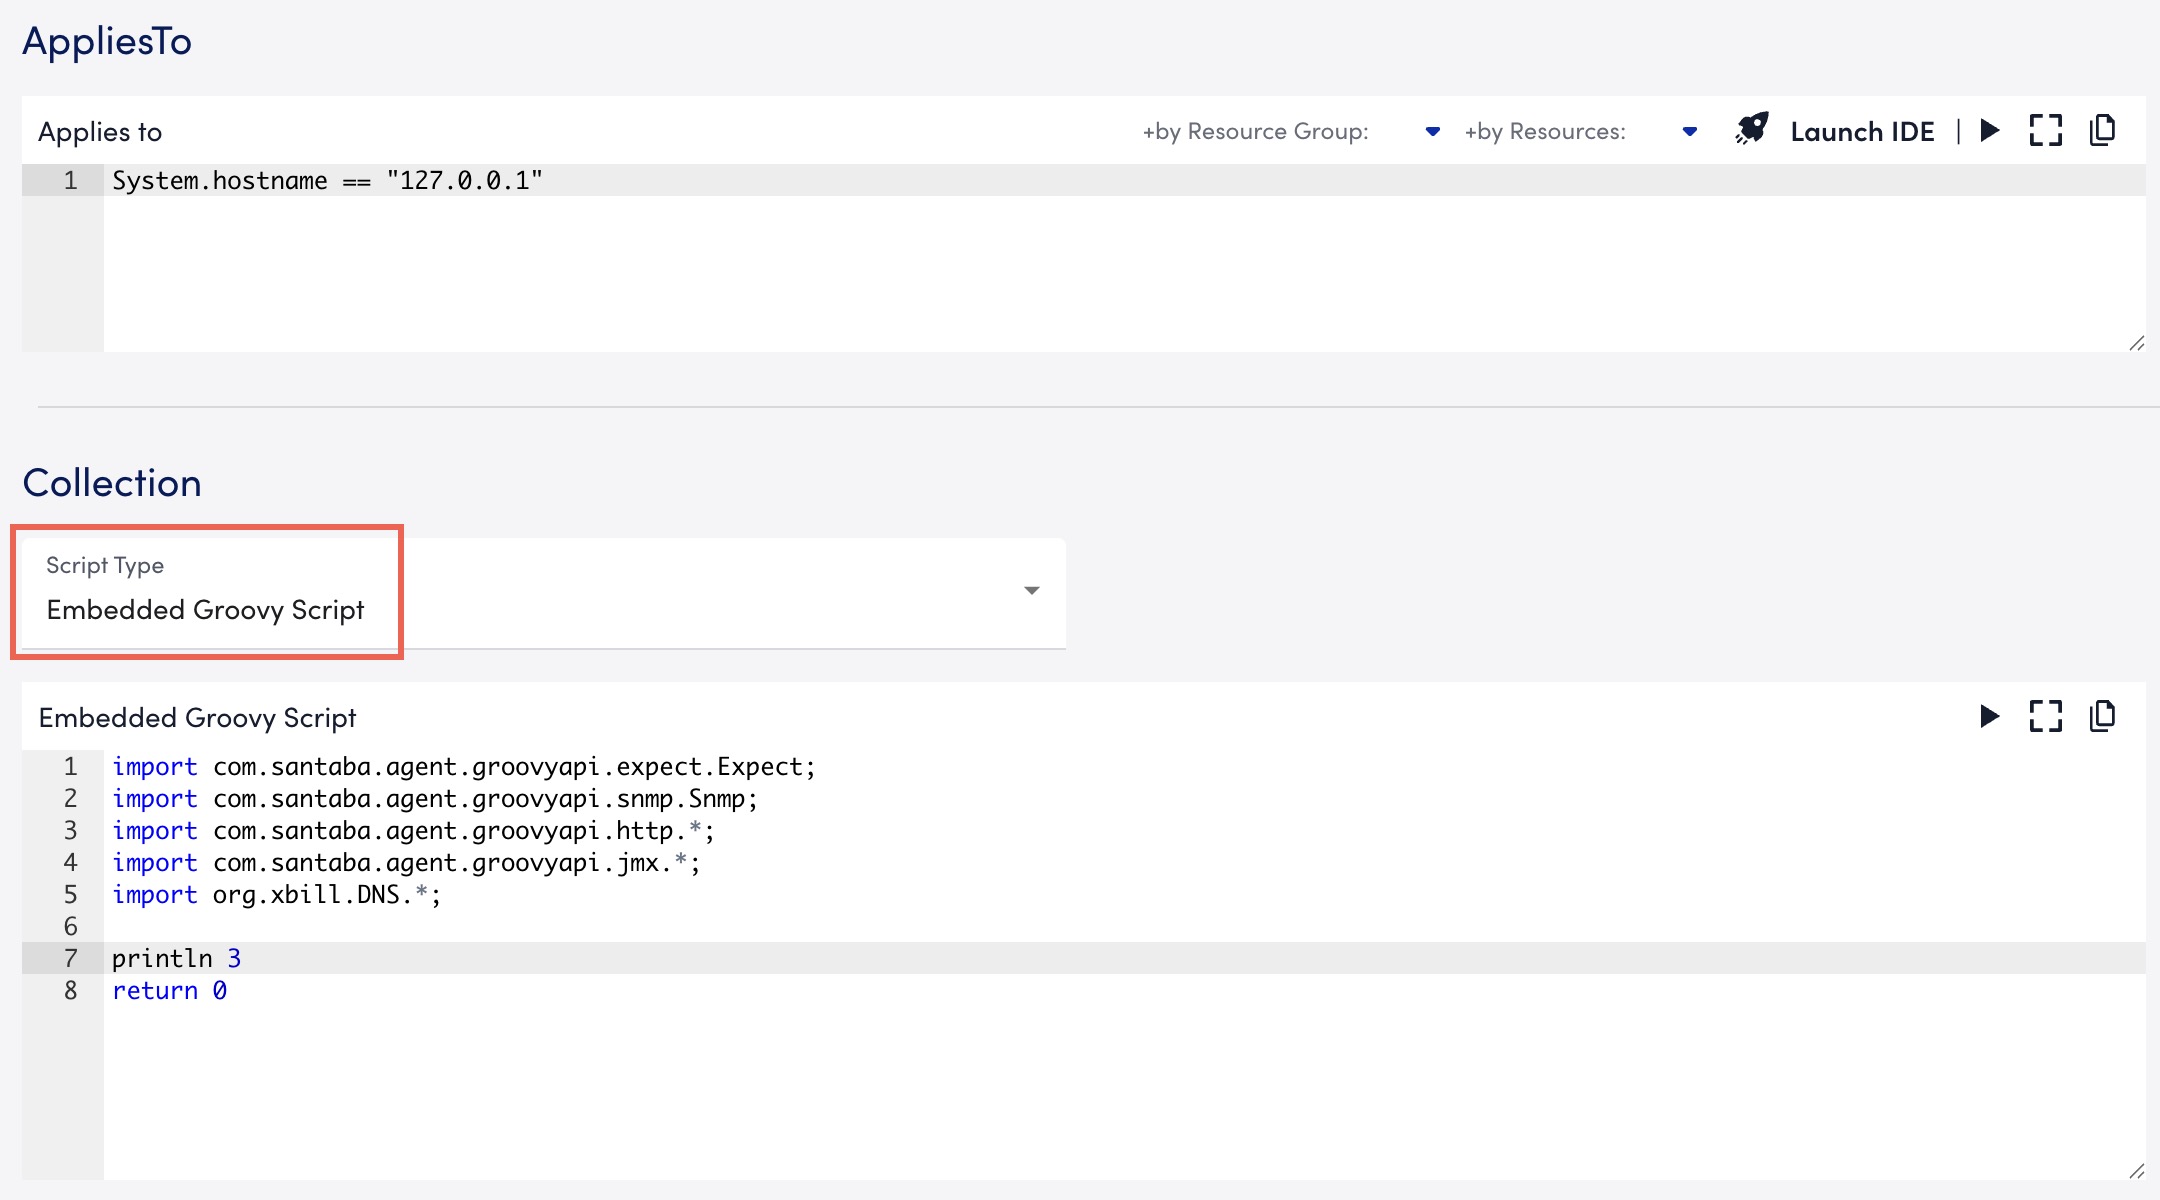
- Select the Datapoints tab, and do the following:
- Select Add a Normal Datapoint.
- In the Name field, enter a name for the datapoint. For example, ElapseTime.
- Select “Execution time of script in milliseconds” from the Datapoint source dropdown menu.
The datapoint source provides helpful feedback on how the script is running.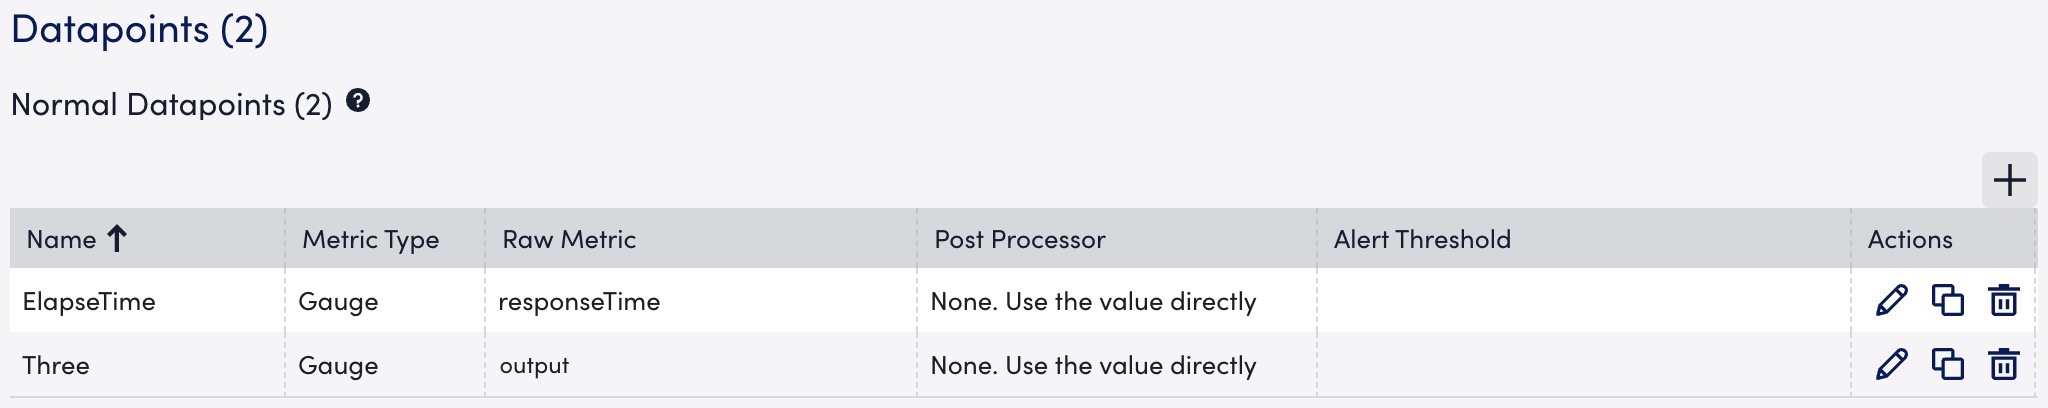
If the Groovy script has exit codes, add another datapoint to monitor their return value. You can monitor the content of standard output, if your script prints values. In this example the script prints a value, so a datapoint with the name Three is added to capture the output.
- Select Save.
Verifying DataSource
After creating the DataSource and associating it with a device monitored by your sandbox Collector, you can verify execution.
- In LogicMonitor, navigate to the Resource Tree.
- Locate the resource where the DataSource is applied.
- In the Raw Data tab, check for valid numbers in the ElapseTime and Three columns.
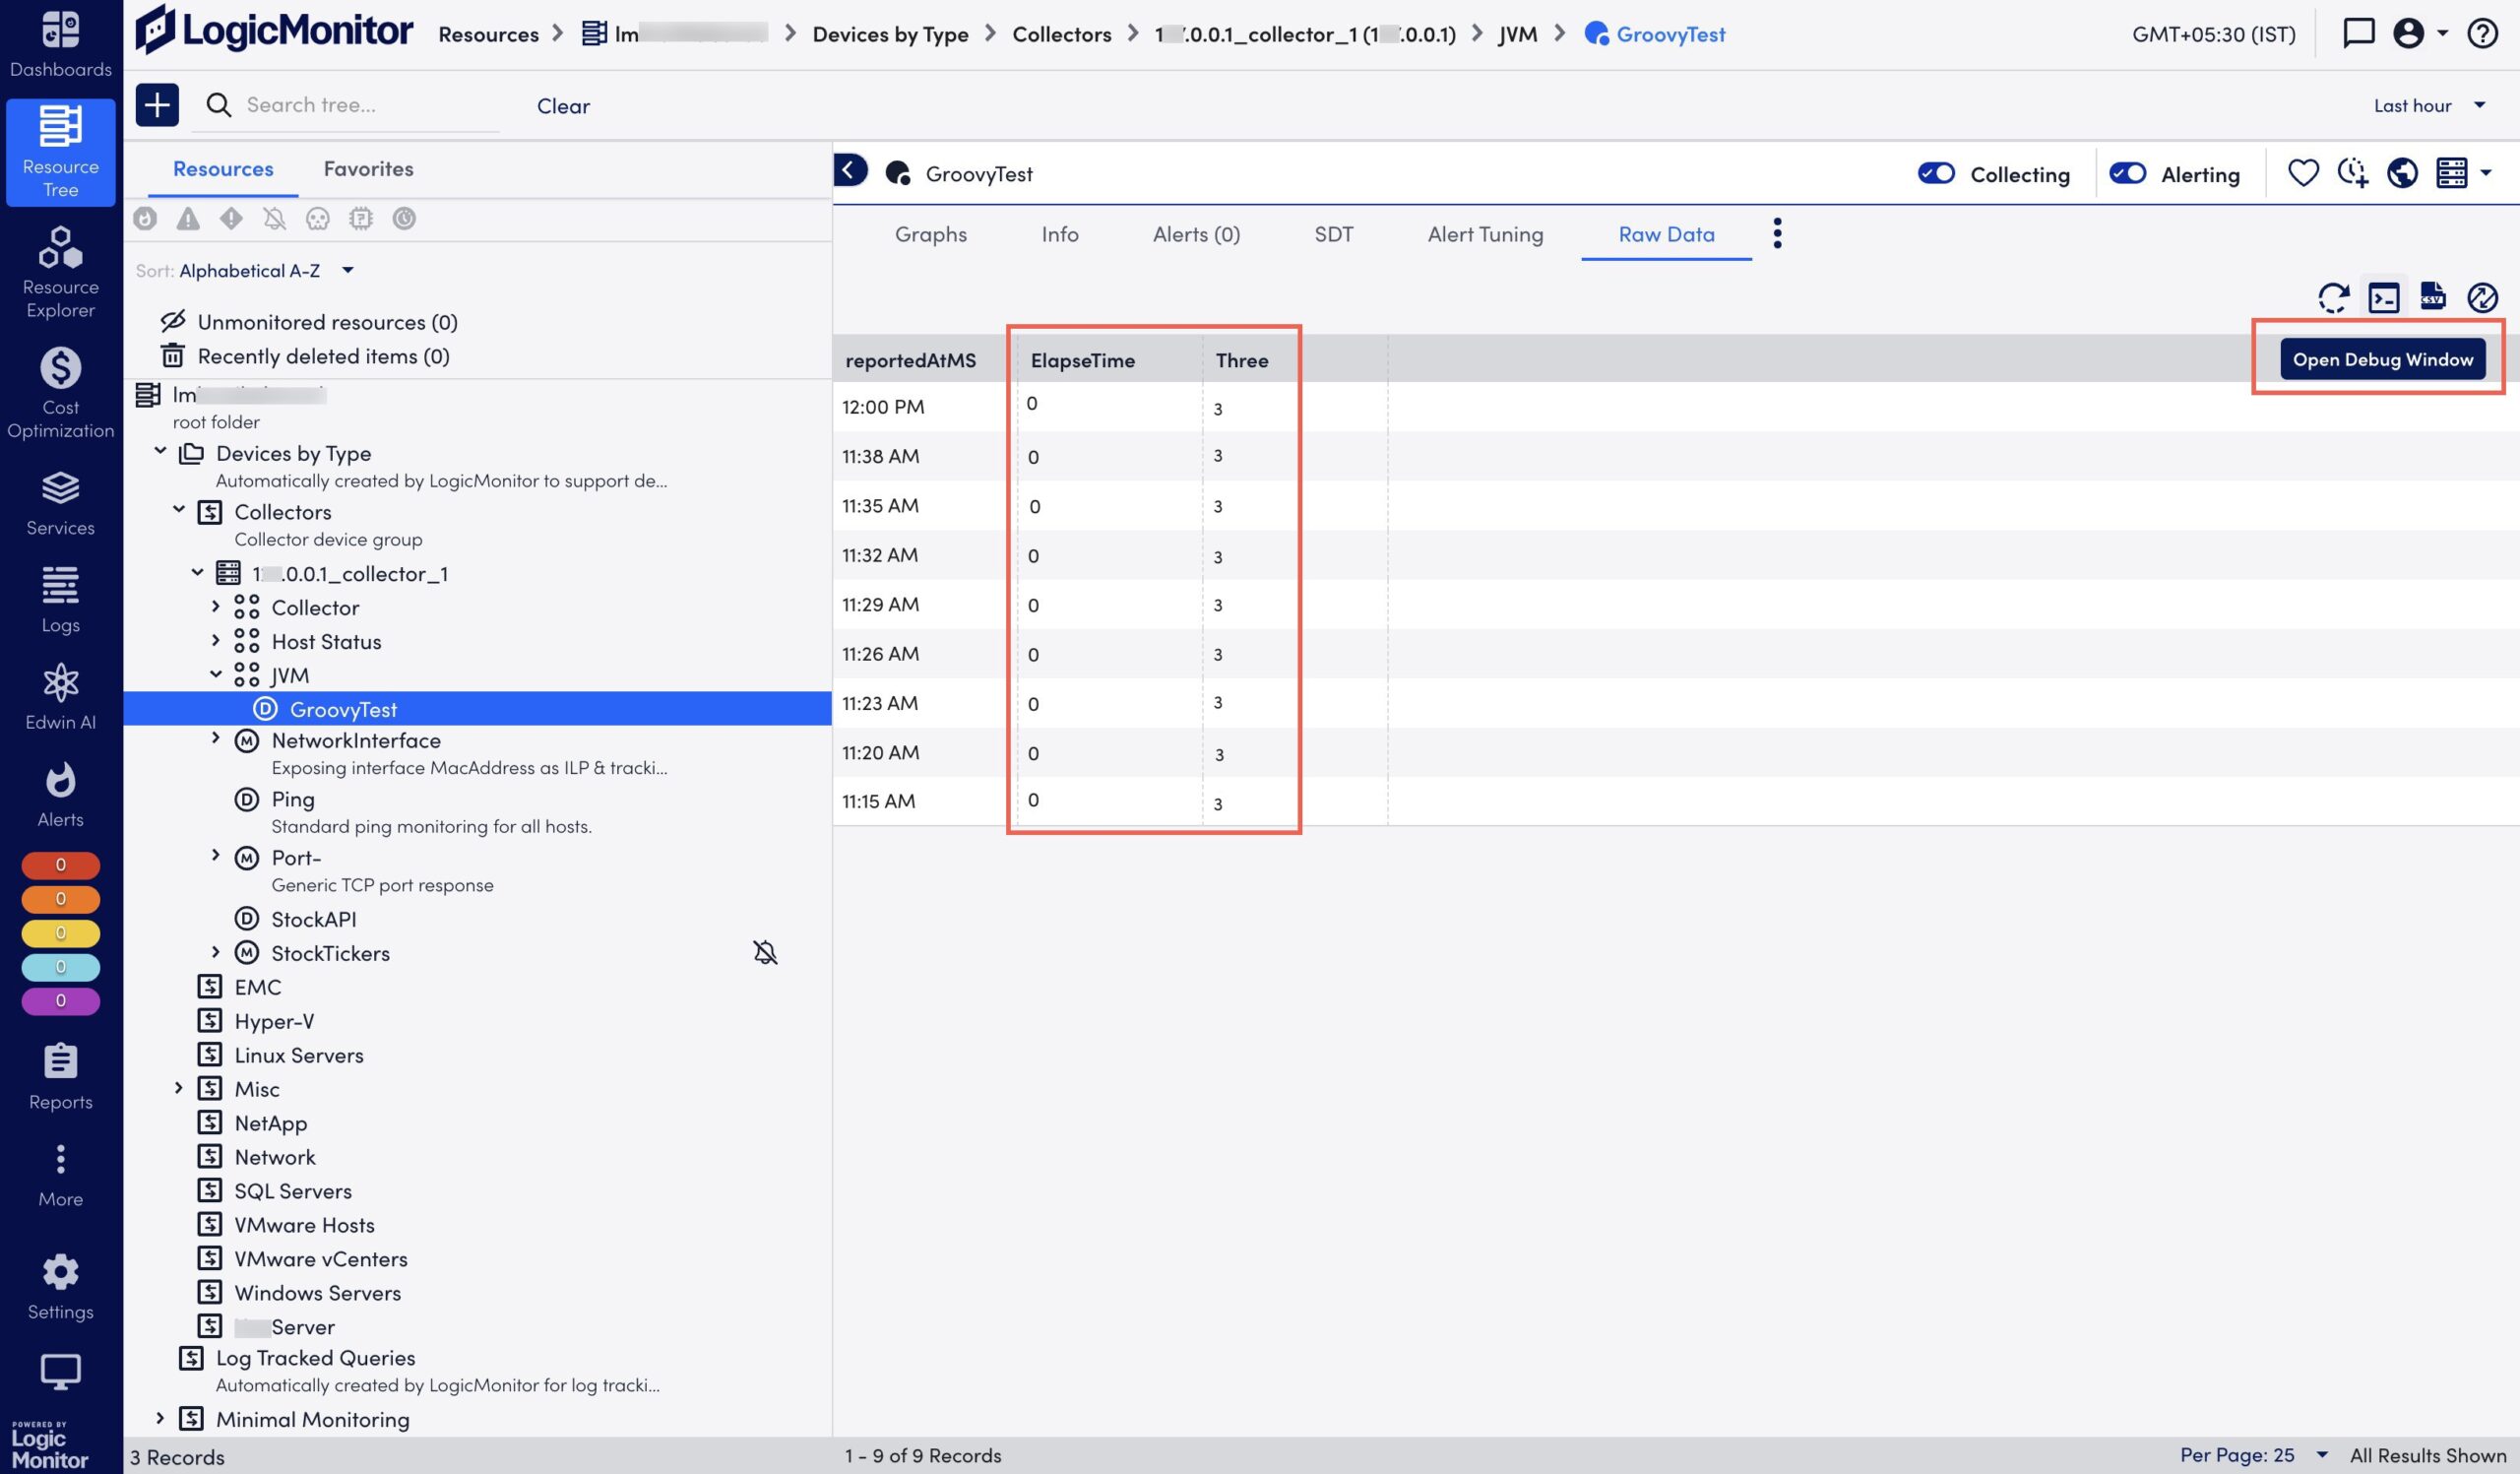
Check Collector events to ensure no recent messages are logged in the Event log.
Debugging Groovy Script Using Test Script
You can test a Groovy script using the Test Script feature available in a DataSource. This method lets you test individual script components (Active Discovery or Collection) without opening the Collector Debug Command window.
- In LogicMonitor, navigate to Modules.
- On the My Module Toolbox page, select Add.
- In the Add modal, select DataSource.
- Select the AppliesTo tab, and then select
 Test AppliesTo to test the device where the script is applied.
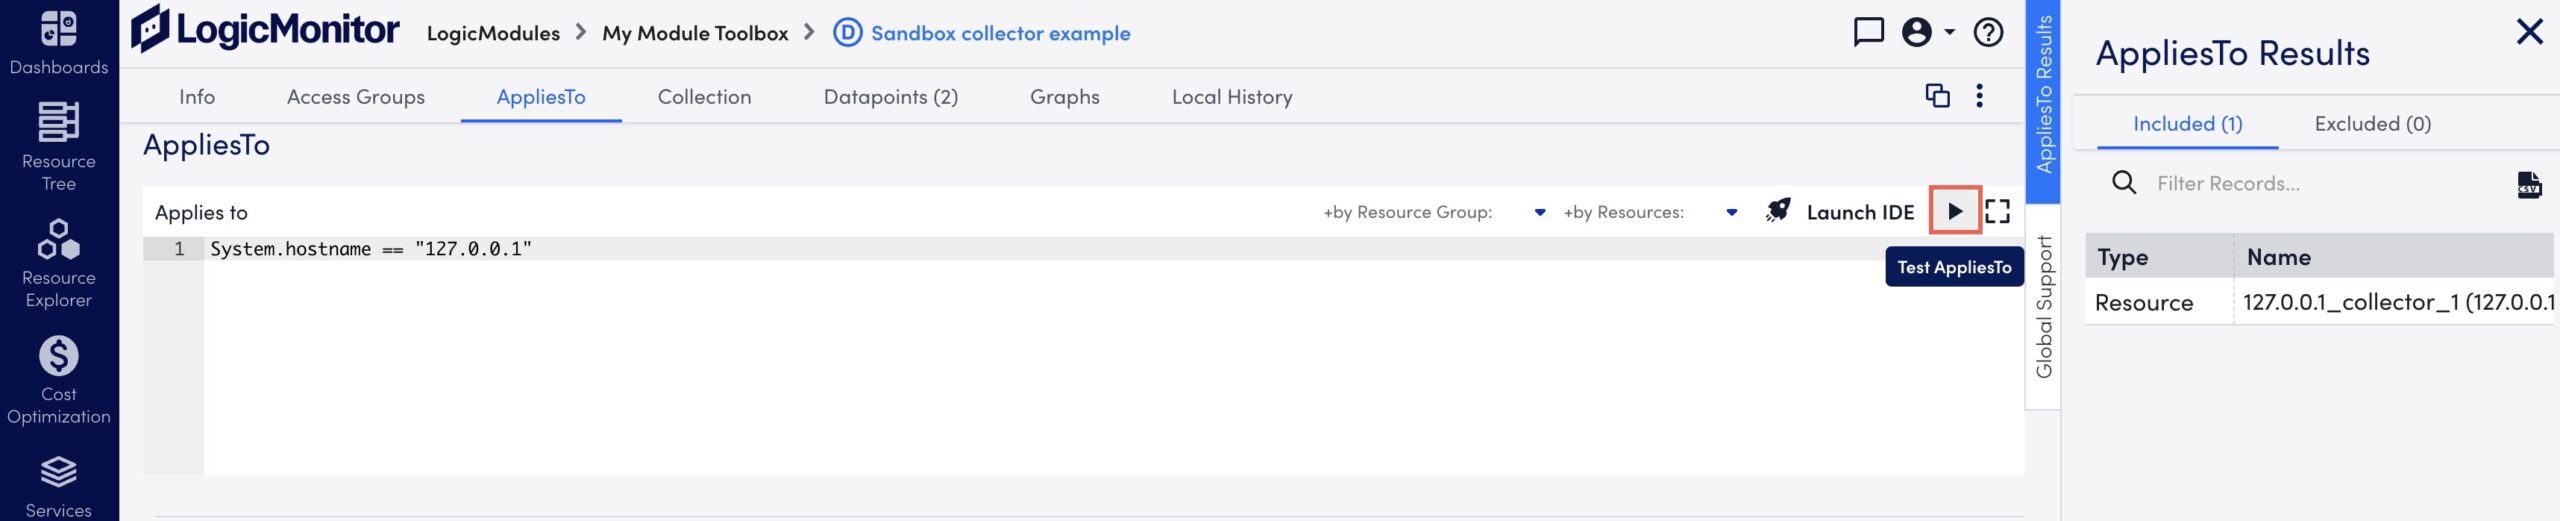
- Select the Collection tab, and do the following:
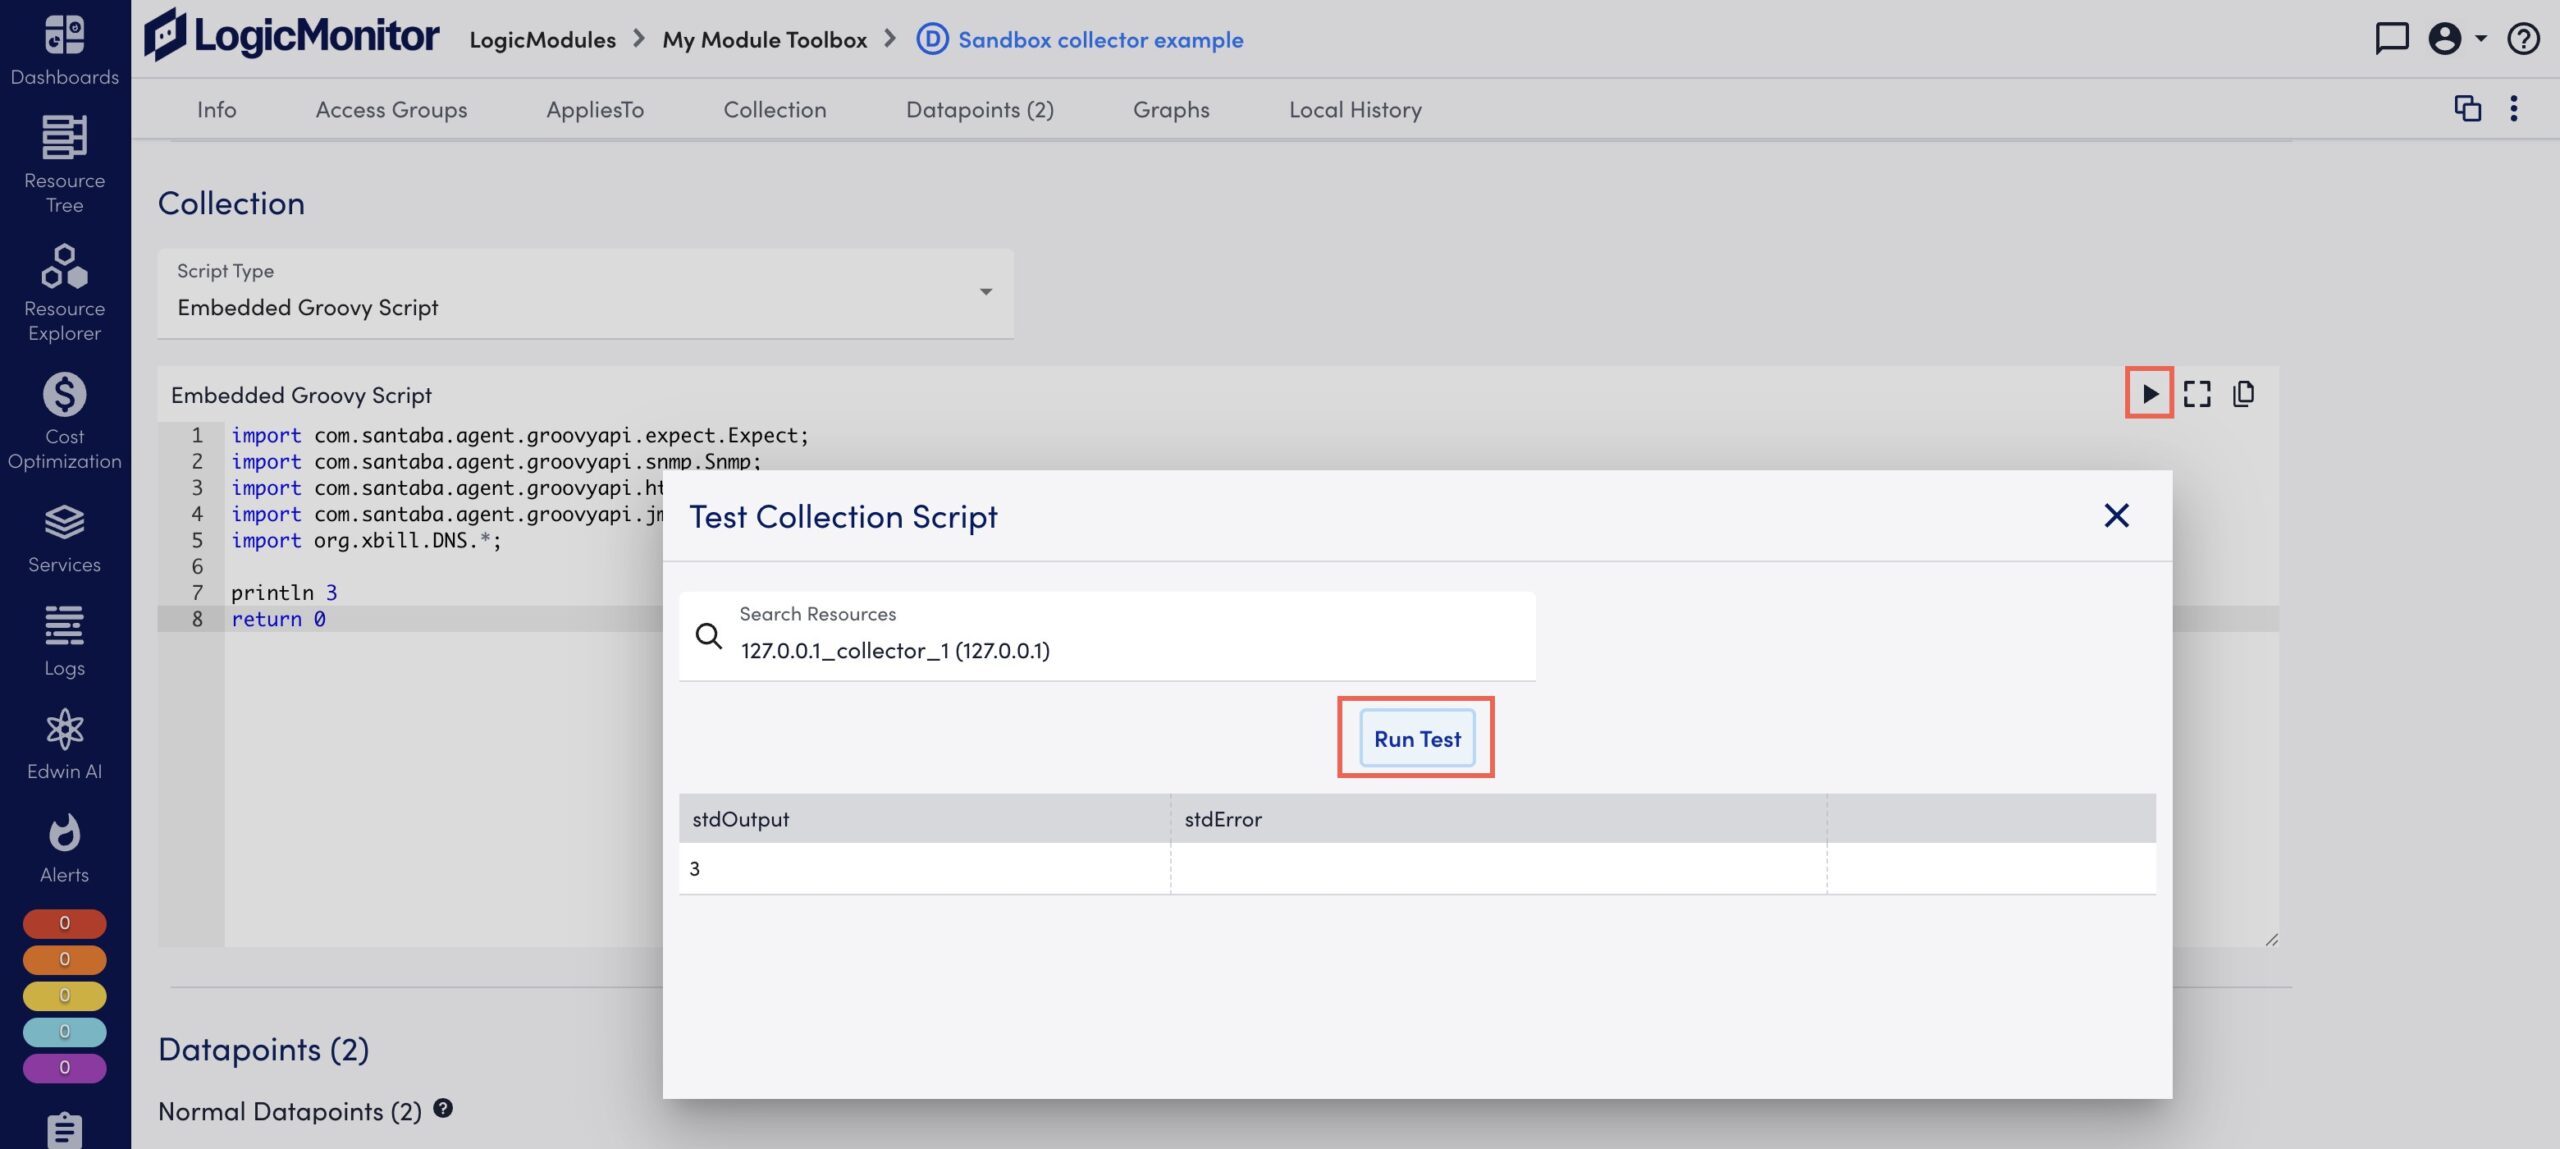
- Select “Embedded Groovy Script” from the Script Type dropdown menu.
- Enter the Groovy script.
- Select Test Script.
The Test Collection Script modal displays. - In the Search Resources field, search and select a resource.
- Select Run Test.
The script result displays in the stdOutput.