Remediation Operation for Resources
Last updated - 09 July, 2026
LogicMonitor enables you to run user created and LogicMonitor supported out-of-the-box RemediationSource modules to fetch data to help troubleshoot issues directly from a resource. You can run multiple RemediationSources at the same time across one or more resources, but the same module cannot be run in parallel on a single resource.
Note: Manual running of RemediationSource is currently not supported for Kubernetes clusters, LM_Logs_Tracked_Queries, Uptime, SaaS, Synthetics, WebCheck, PingCheck, and Services.
When LogicMonitor runs a RemediationSource, the status changes as the execution progresses. The following table describes the supported execution status:
| Execution Status | Indicates |
|---|---|
| Not started | The RemediationSource module is not yet run. |
| In progress | The RemediationSource module is currently running. |
| Success | The RemediationSource module is run successfully and has collected relevant data. |
| Invalid Request | LogicMonitor server received an invalid JSON request. |
| Reject | LogicMonitor Collector could not handle the incoming request from the server. |
| Exception | The RemediationSource module failed to run due to an error in the Collector. |
| Timeout | Timeout occurs when a script fails to run due to reasons such as the resource is dead, Collector is down, and so on. |
After the RemediationSource runs, LogicMonitor displays the remediation status. The following table describes the supported remediation status:
| Remediation Status | Indicates |
|---|---|
| Success | The remediation script explicitly sets the value of the RemediationSource variable to true (boolean) or “true” (string) based on the internal logic. This value is parsed and displays as Success in the UI but does not guarantee that the issue has been resolved. |
| Failure | The remediation script explicitly sets the value of the RemediationSource variable to false (boolean) or “false” (string) based on the internal logic. This value is parsed and displays as Failure in the UI but does not guarantee the resolution status of the issue. |
| NA | The remediation status displays as NA when the RemediationSource variable is not set in the output JSON. |
After running the RemediationSource, you can view the result generated by the script. This helps identify how the issue is resolved. You can view the history of RemediationSource module runs on a resource. The history provides details of the issues and remediation performed to resolve the issue. You can view the run history of the resource for a specific time range.
You can view the output in JSON or plain text format. You can select the format that suits your needs. Details of the supported formats are as follows:
- JSON format—In the JSON format, the rendered output is contained in a “data” field. Most LogicMonitor supported RemediationSources provide output in JSON format to avoid issues with special characters, multiple languages, and to allow potential for future metadata for specifying rendering (html, markdown, and so on).
The following displays an example output in JSON format:
{
  "format": "md",
  "data": "|%CPU|COMMAND|\n|----|-------|\n|4.0 |systemd|\n|1.0 |sshd   |"
}- Plain text format—If the output is not a valid JSON in the “data” field, the output falls back to the plain text format.
Requirements for Running RemediationSource
To run a RemediationSource module, you need the following:
- Toggle the Enable Running Remediation Sources switch on the Security page.
For more information, see Security Settings. - A LogicMonitor user with resource permissions for “Remediation: Execute” settings for the resource group.
For more information, see Resources Role Permissions. - Install EA Collector 39.200 or later on your machine.
For more information, see Adding Collector. - Manually created RemediationSource or out-of-the-box RemediationSource modules imported in My Module Toolbox and applied to the resources.
For more information, see RemediationSource Configuration. - Resources including cloud resources monitored by local Collectors.
For more information, see Enabling Cloud Monitoring using Local Collector.
Running RemediationSource
- In LogicMonitor, navigate to Resource Tree.
- Locate the resource to which a RemediationSource module is applied.
- Select the Remediation tab.
- In the Actions column, select
 Run for the RemediationSource that you want to run.
Warning: When the system begins to run the RemediationSource, you cannot pause or cancel the process.
The system runs the RemediationSource module and updates the execution status.
When the process is complete, you can view the output of the recent run in the Overview tab.
Note: If the script output is large, it is truncated to a maximum size of 32 KB.
Viewing RemediationSource Run Result
- In LogicMonitor, navigate to Resource Tree.
- Locate the resource to which a RemediationSource module is applied.
- Select the Remediation tab.
- Select a RemediationSource.
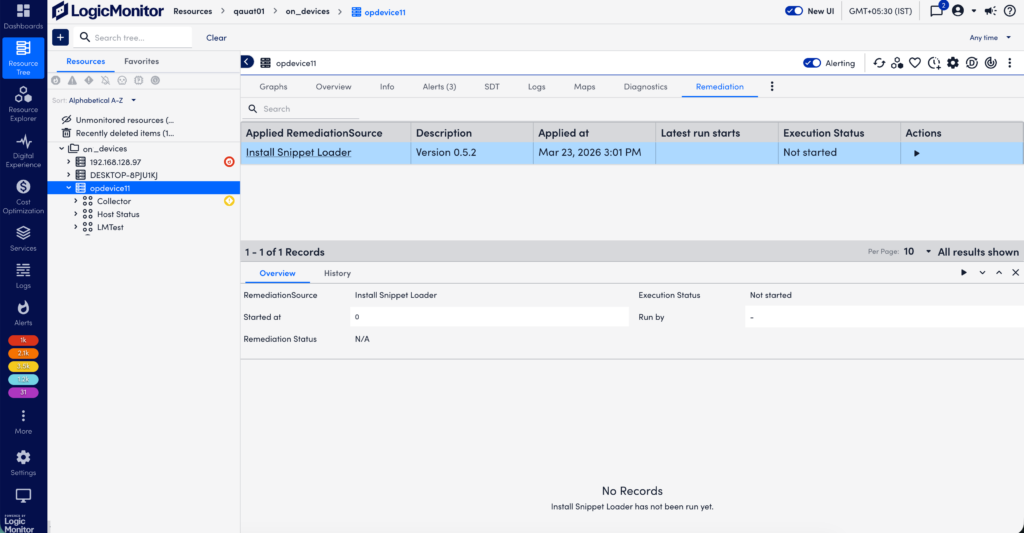
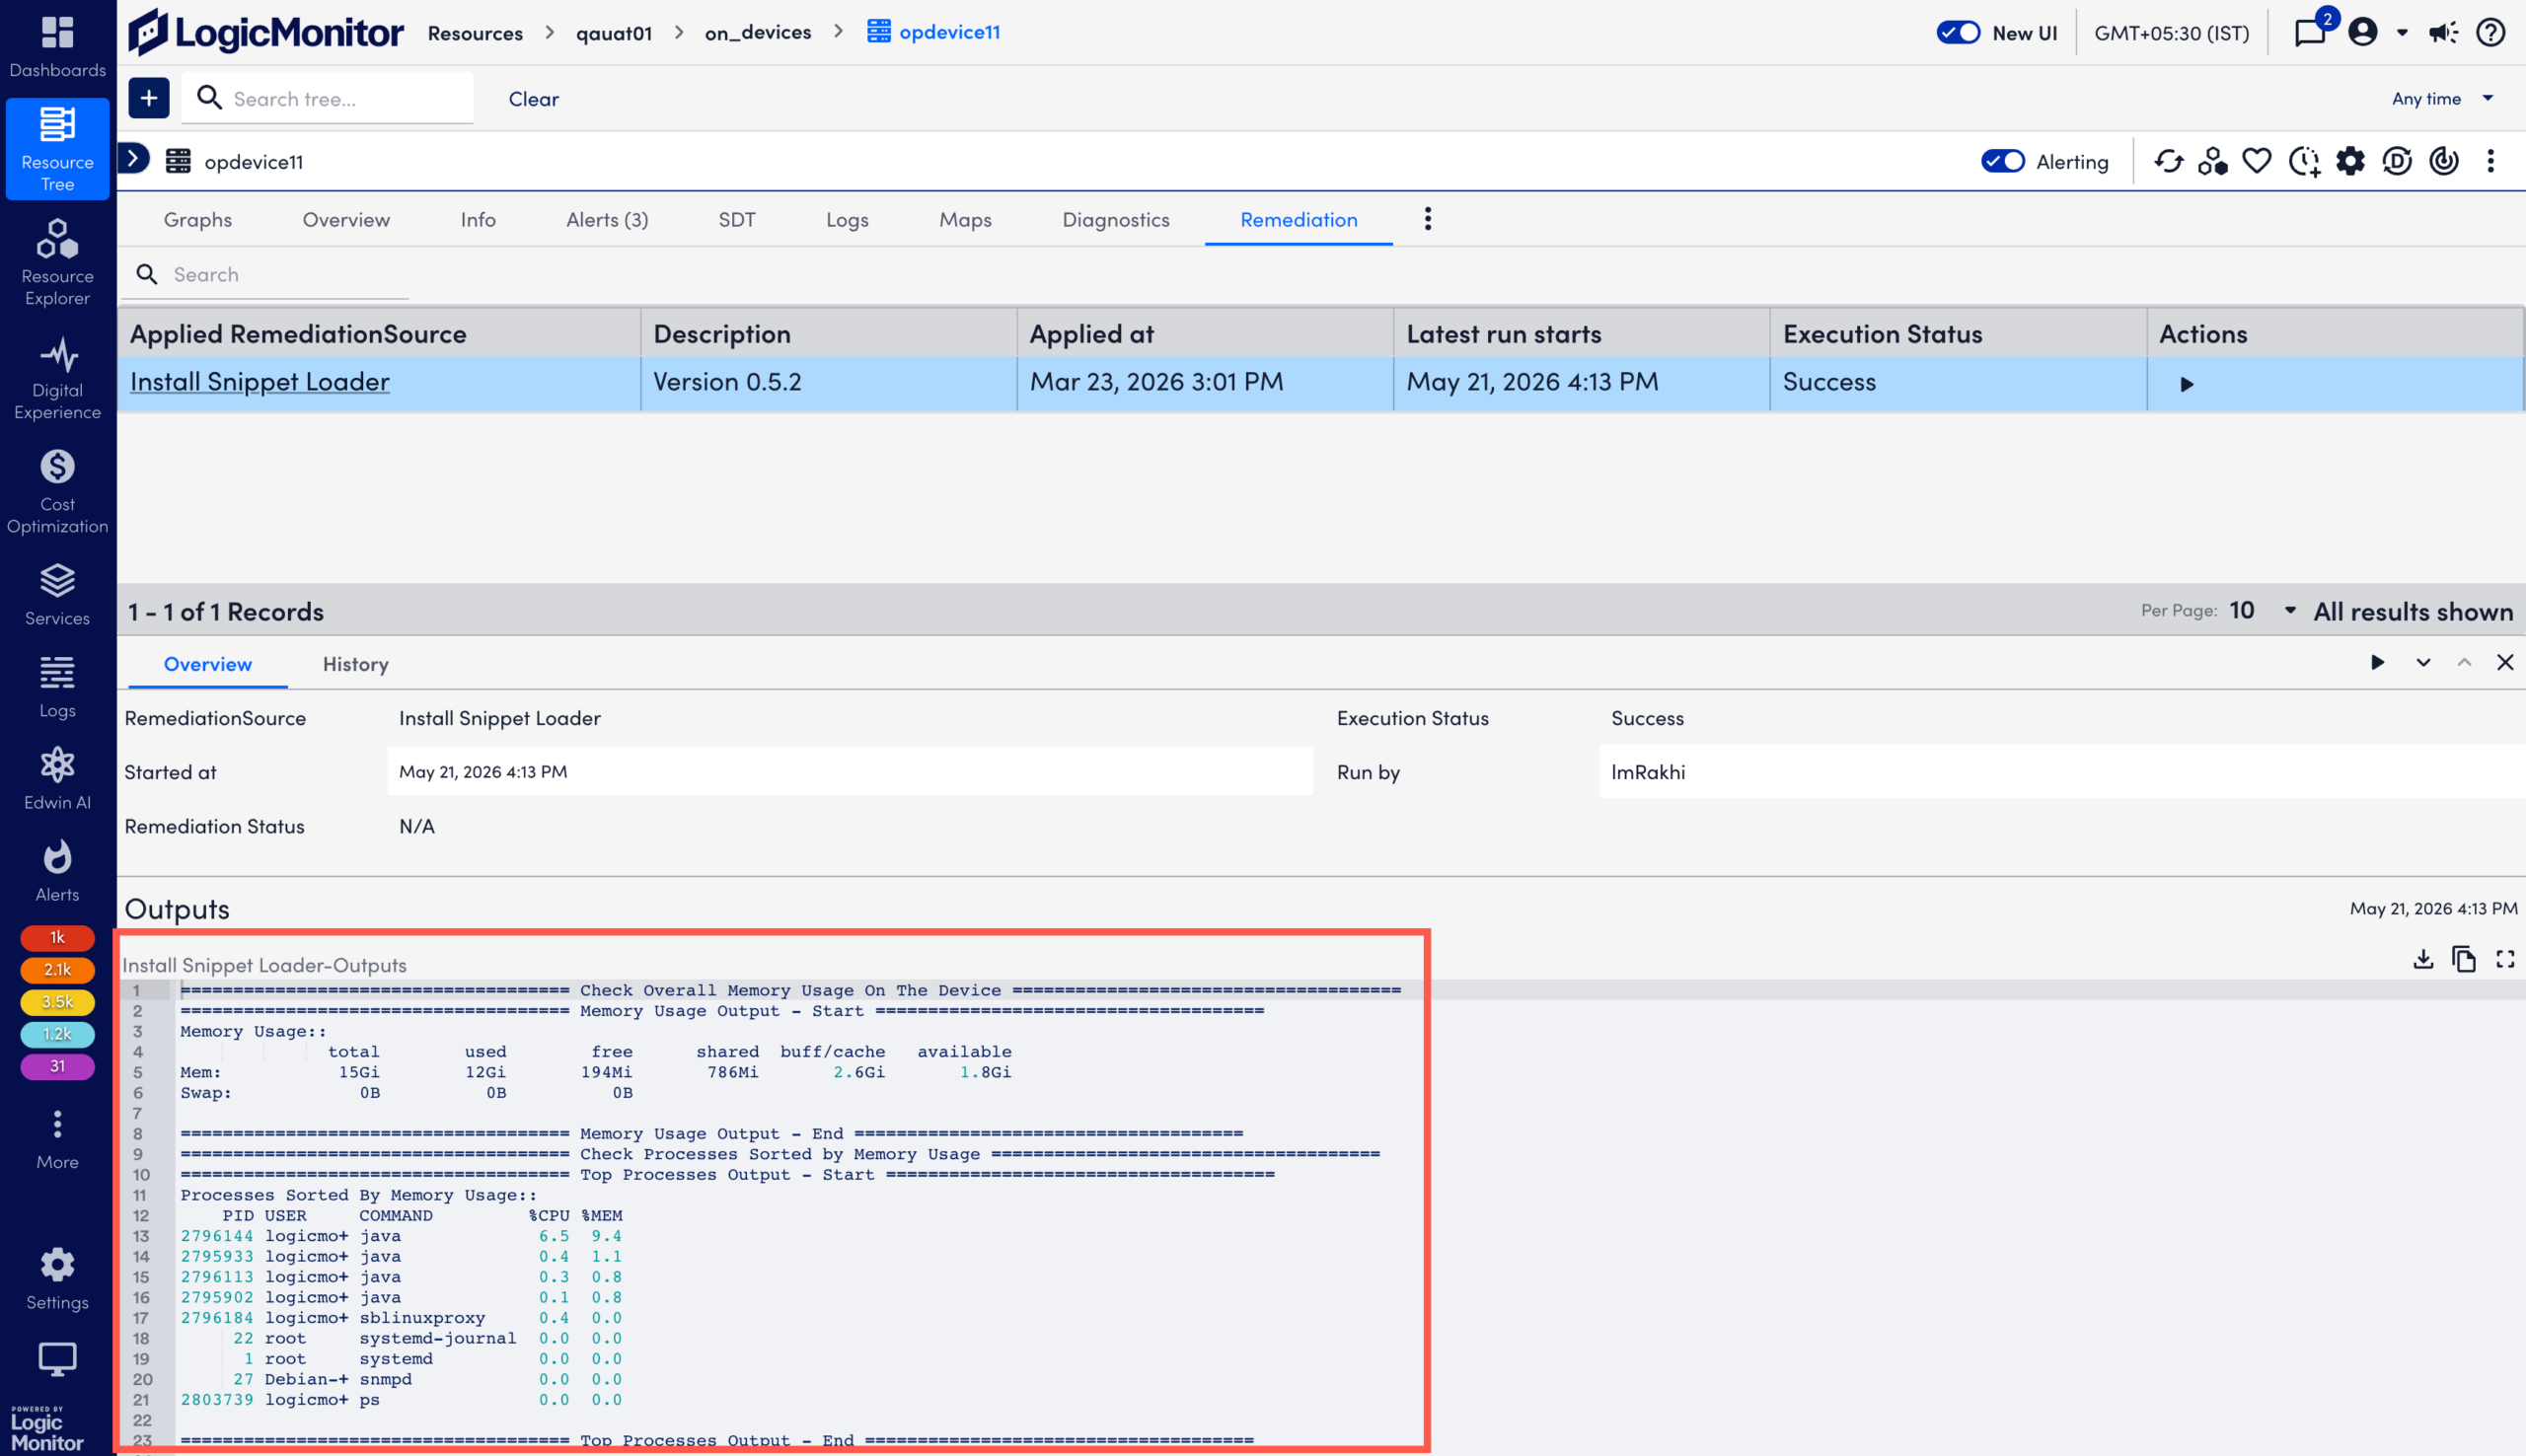
By default, the Overview tab displays the following details:- Name of the RemediationSource
- Execution status
- Date and time when the RemediationSource run started
- Username of the user who triggered the RemediationSource
- Remediation status
- Output details
- Option to view output in fullscreen mode, download, and copy the output
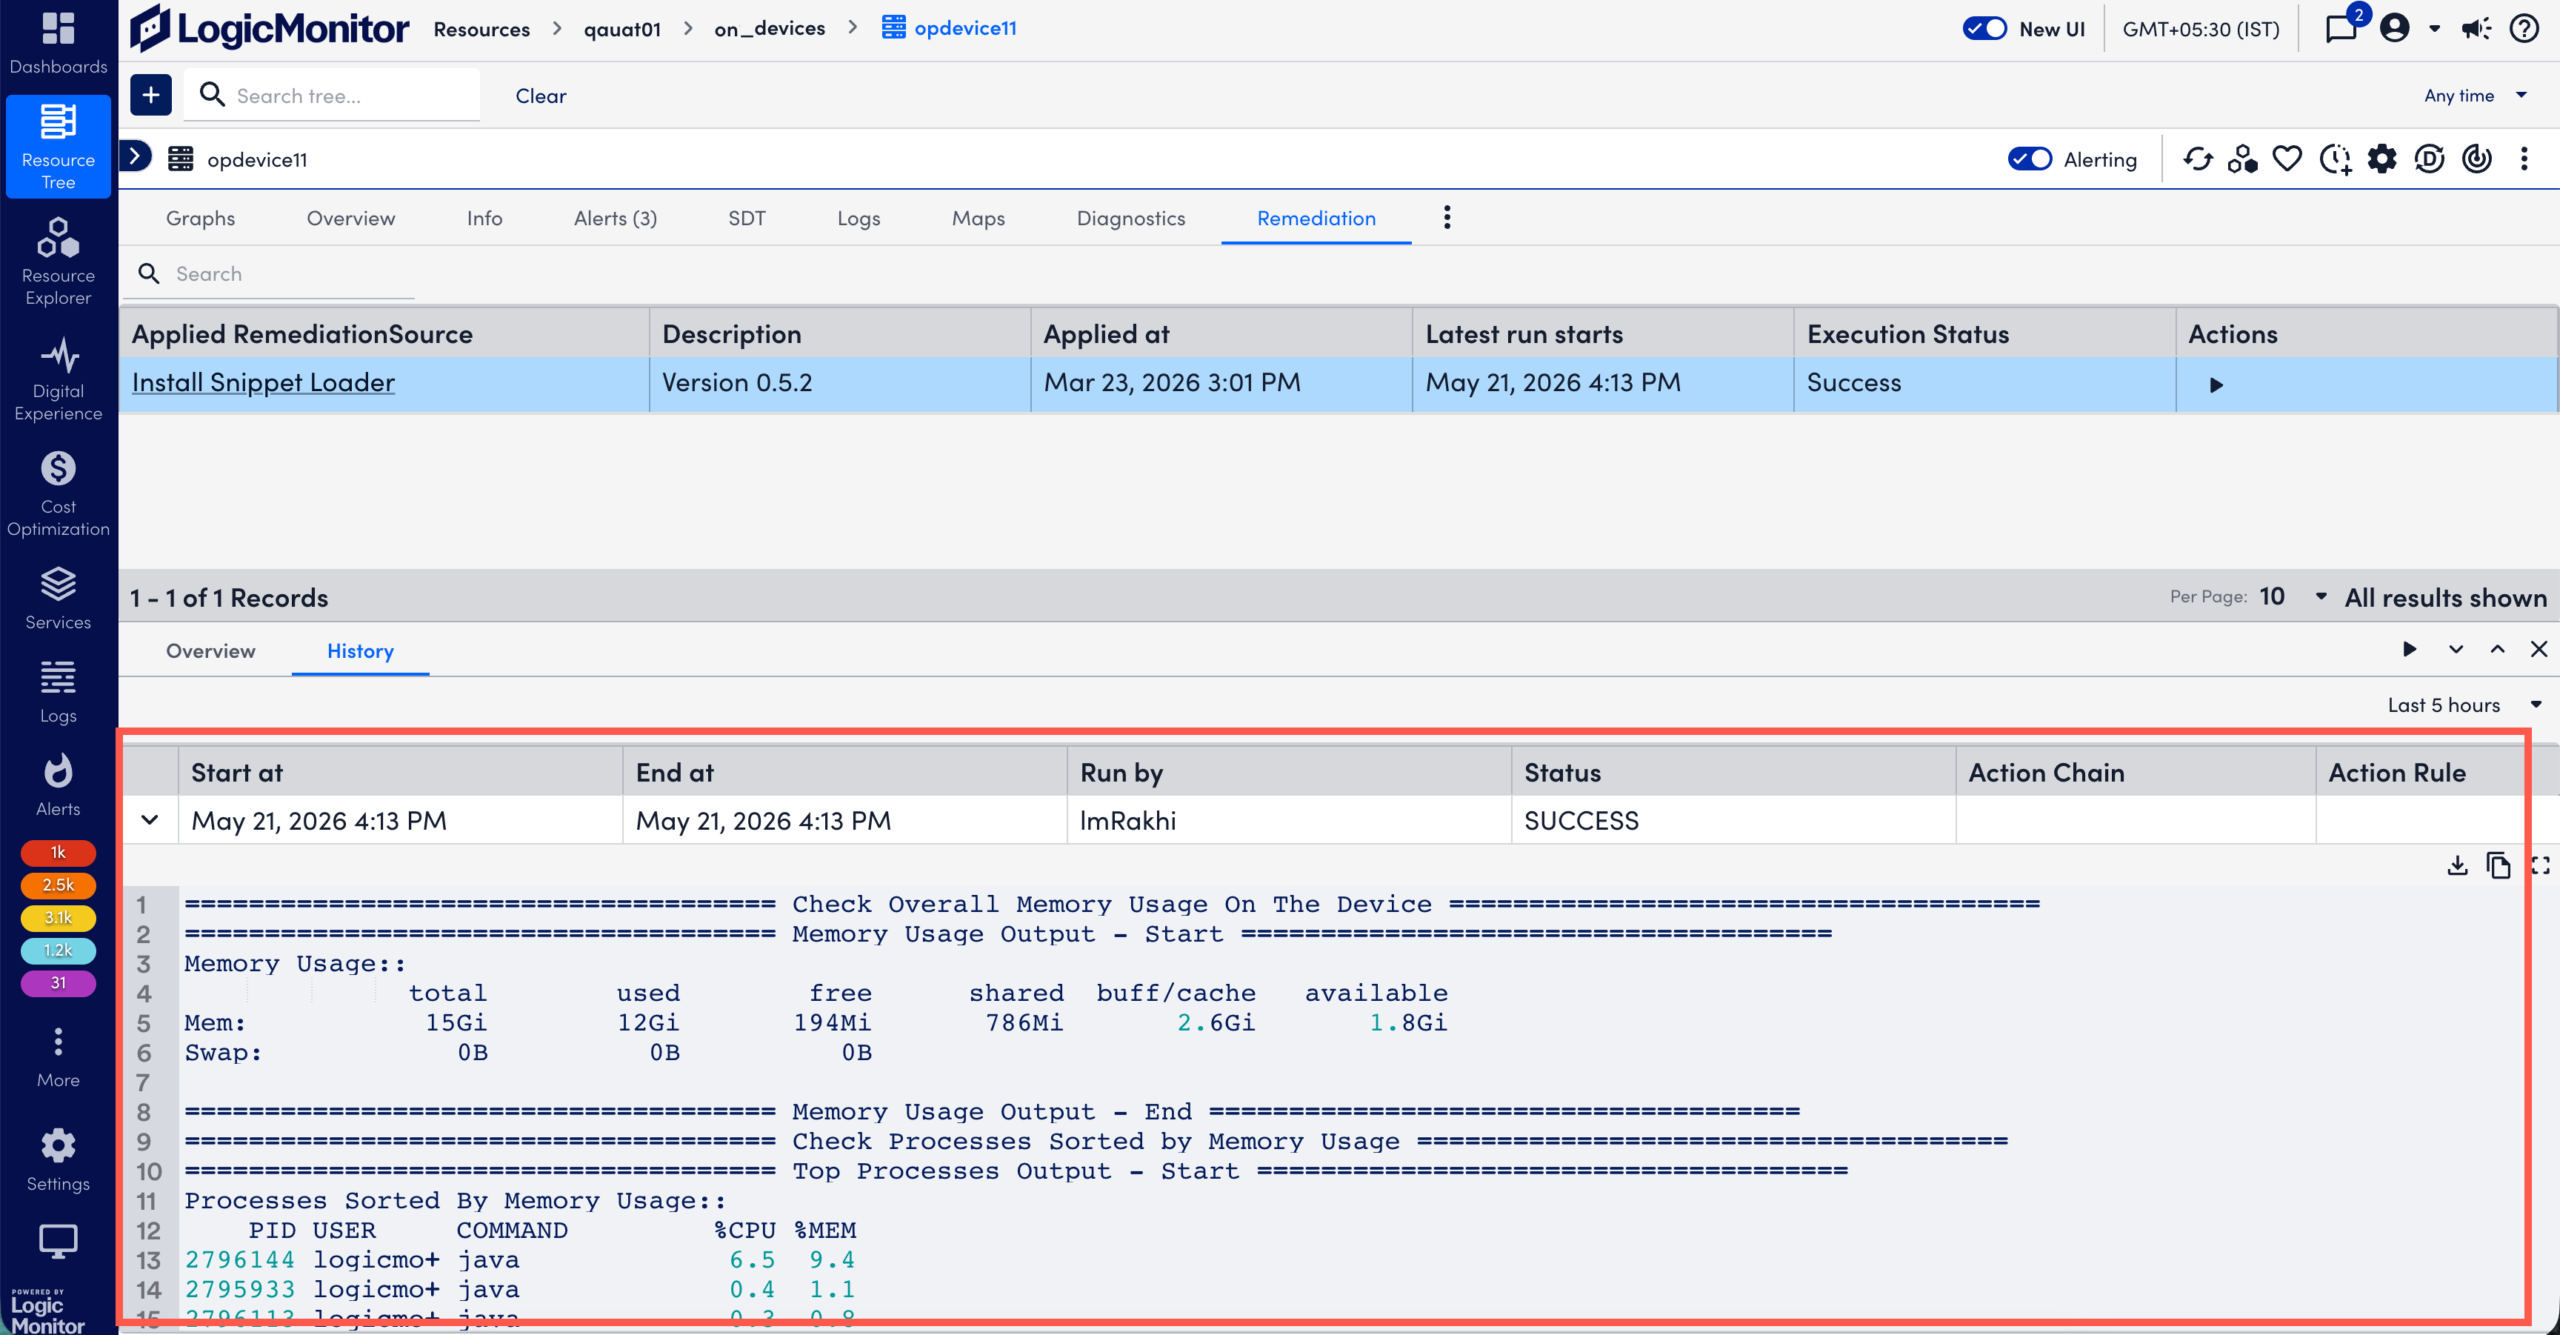
- Select the History tab.
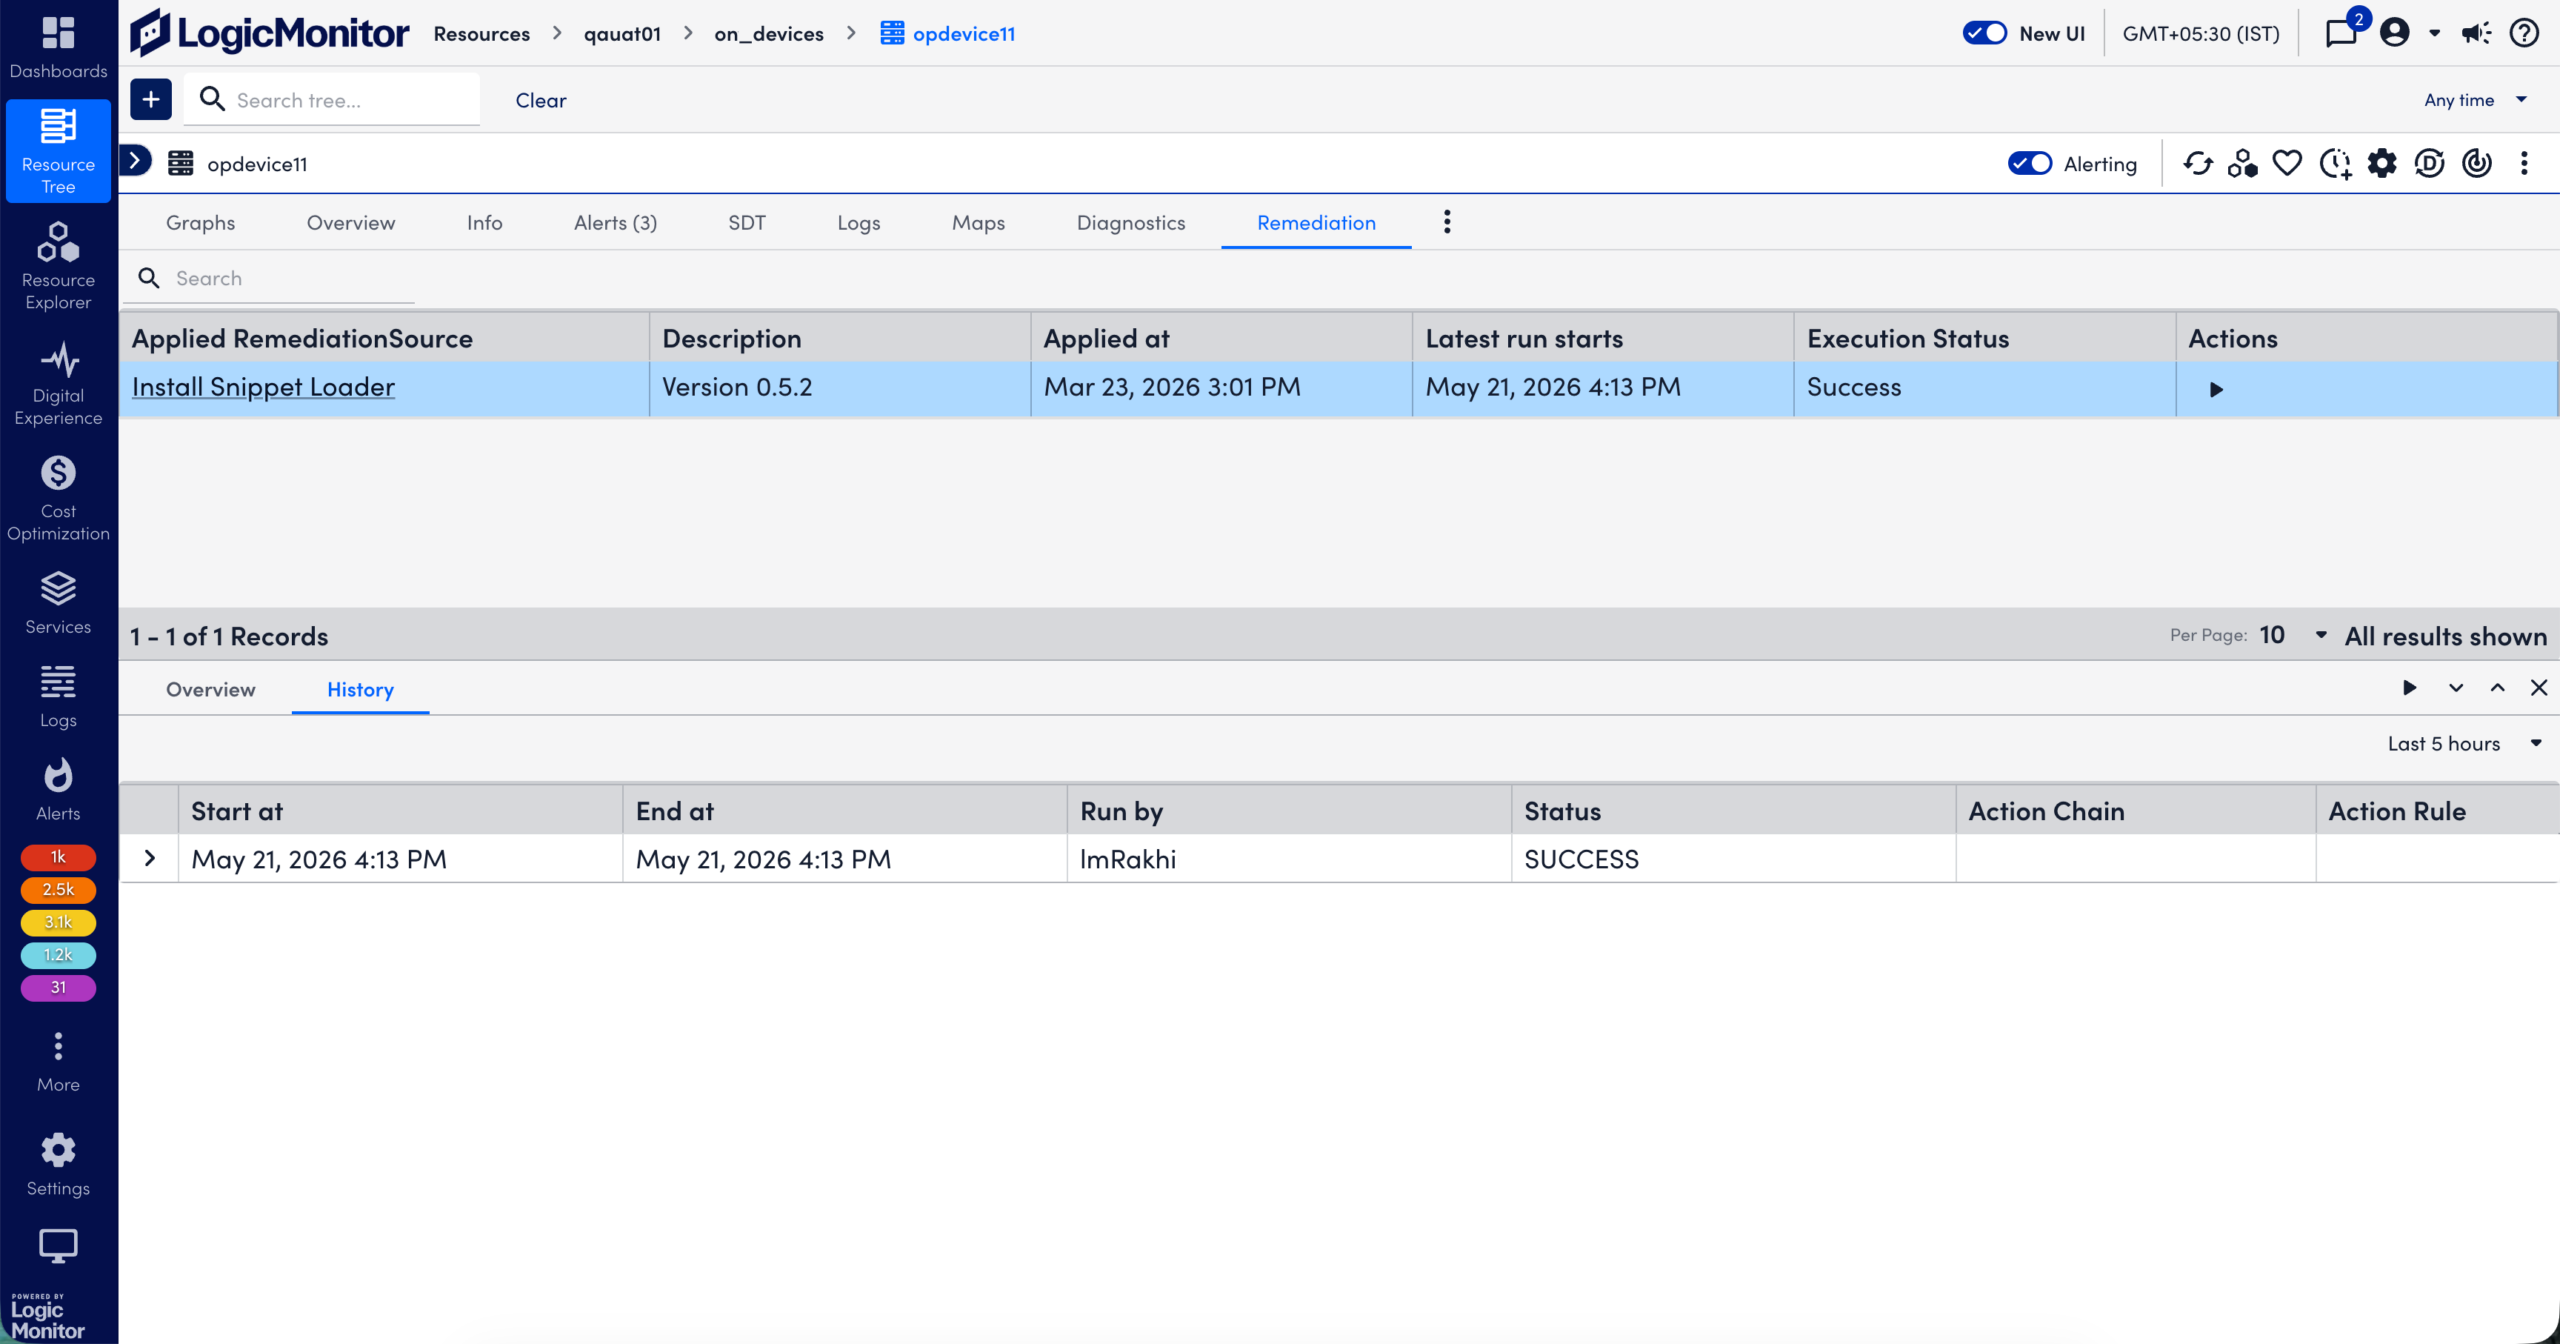
- (Optional) Select a time range.
- Select a record to view the run history.